. 2014 Feb 4;19(2):319-30.
doi: 10.1016/j.cmet.2013.12.016.

Circadian clocks and feeding time regulate the oscillations and levels of hepatic triglycerides

Affiliations

Circadian clocks and feeding time regulate the oscillations and levels of hepatic triglycerides

Yaarit Adamovich et al. Cell Metab. .

Abstract

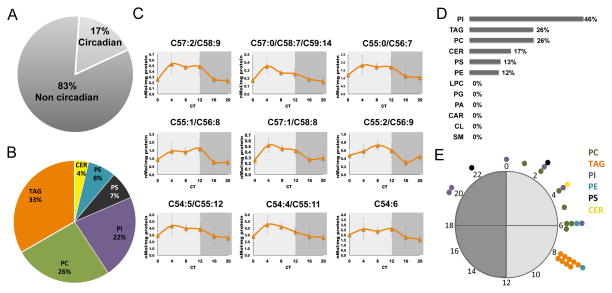
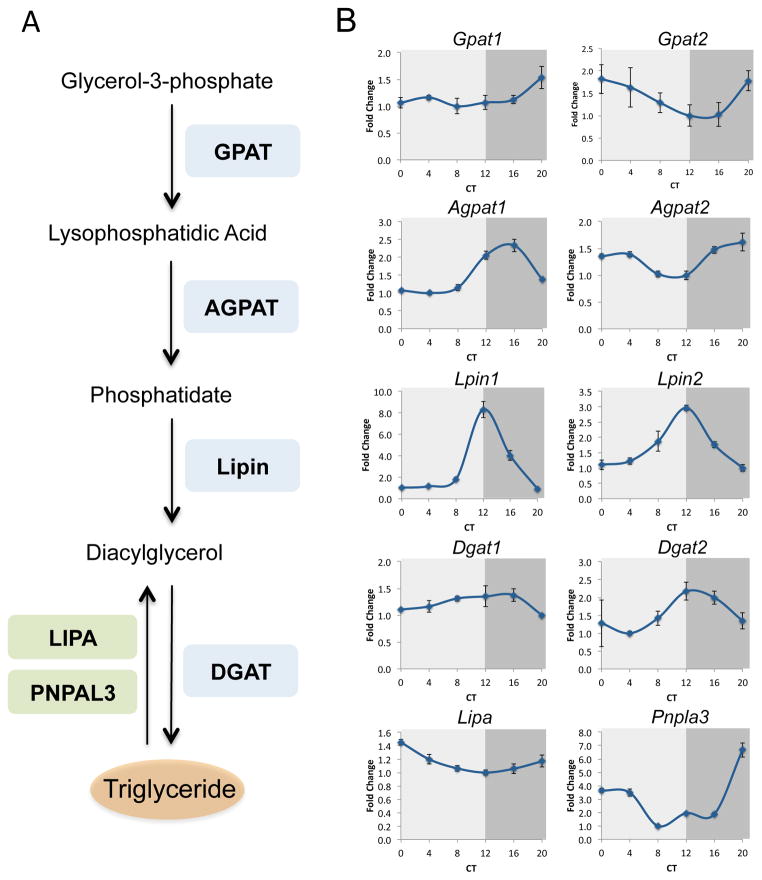
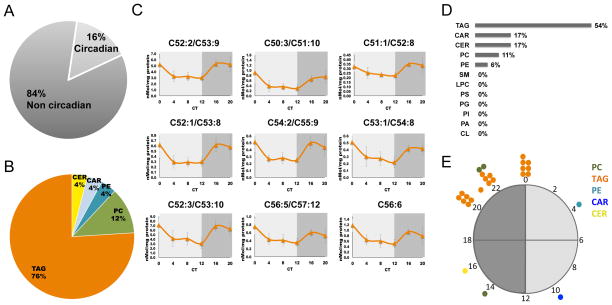
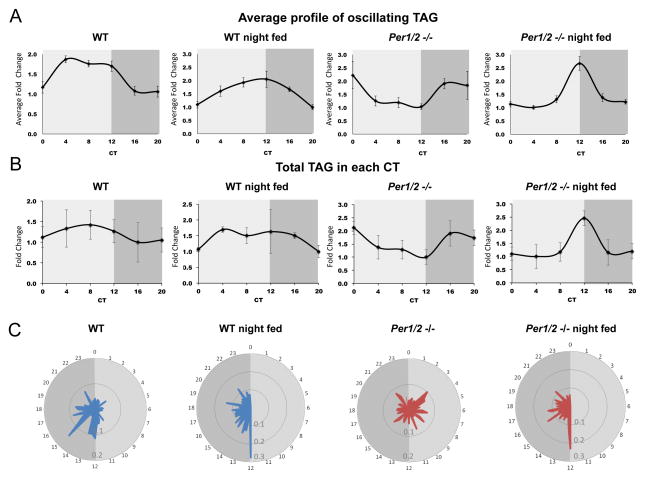
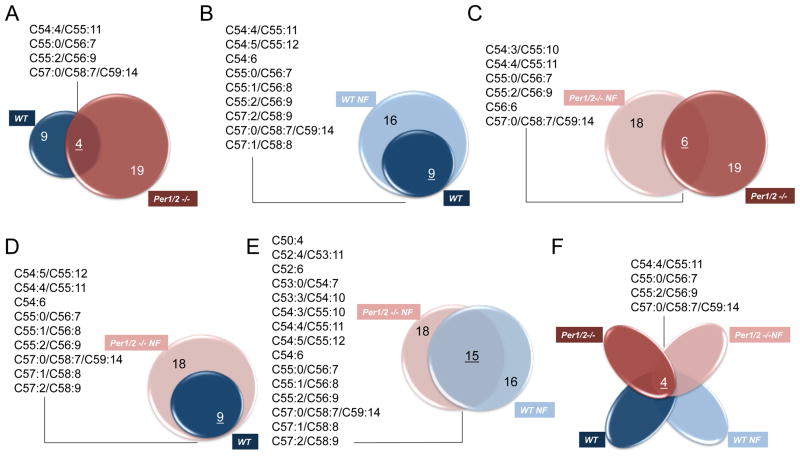
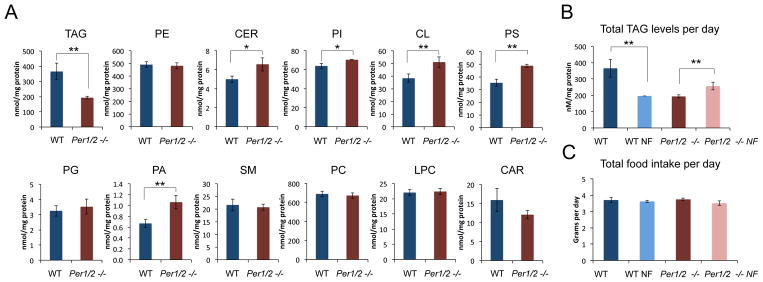
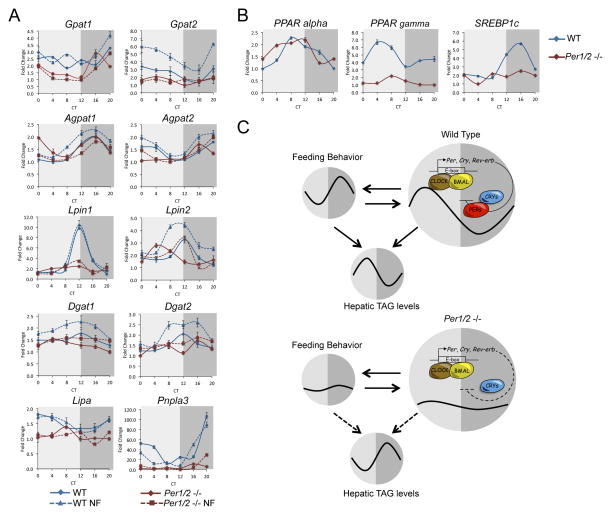
Circadian clocks play a major role in orchestrating daily physiology, and their disruption can evoke metabolic diseases such as fatty liver and obesity. To study the role of circadian clocks in lipid homeostasis, we performed an extensive lipidomic analysis of liver tissues from wild-type and clock-disrupted mice either fed ad libitum or night fed. To our surprise, a similar fraction of lipids (∼17%) oscillated in both mouse strains, most notably triglycerides, but with completely different phases. Moreover, several master lipid regulators (e.g., PPARα) and enzymes involved in triglyceride metabolism retained their circadian expression in clock-disrupted mice. Nighttime restricted feeding shifted the phase of triglyceride accumulation and resulted in ∼50% decrease in hepatic triglyceride levels in wild-type mice. Our findings suggest that circadian clocks and feeding time dictate the phase and levels of hepatic triglyceride accumulation; however, oscillations in triglycerides can persist in the absence of a functional clock.


Figures

Figure 1
Figure 1. Analysis of mouse liver lipidome
A., The percentage of lipids that were found to exhibit a circadian pattern of accumulation in livers of WT mice based on JTK_CYCLE analysis (6 time points, n=4 for each, P value <0.05). Out of the 159 measured and identified, 27 lipids exhibited circadian pattern of accumulation. B., Oscillating lipids species distributed according to their types. C., Accumulation profiles of oscillating TAG presented as mean +/− STDEV. D., The percentage of oscillating lipid species within each lipid type. E., Day-time distribution of peak phases of oscillating lipids. TAG in orange, PC in green, PI in purple, PS in black, PE in light blue, and CER in yellow. Circadian Time (CT), CT0 is the time the light used to be turned on and CT12 is the time light used to be turned off. Dark gray represents the subjective night and light gray the subjective day. See also Figure S1.
Figure 2
Figure 2. Circadian regulation of hepatocytes triglyceride metabolism
A., Schematic depiction of the triglyceride biosynthesis pathway (glycerol-3-phosphate pathway) and triglyceride catabolism. Glycerol-3-phosphate acyltransferase (GPAT), 1-acylglycerol-3-phosphate acyltransferase (AGPAT), diacylglycerol acyltransferase (DGAT), Patatin-like phospholipase domain containing 3 (PNPLA3), and Lysosomal acid lipase (LIPA). B., WT mice were sacrificed under constant darkness at 4 h intervals throughout the day. Total RNA was prepared from liver and mRNA expression levels were determined by quantitative real-time PCR and presented as fold change relative to the lowest value. Data are presented as mean +/− STDEV, with a mix of 4 animals per time point. Circadian Time (CT).
Figure 3
Figure 3. Liver lipidome analysis of Per 1/2 null mice
A., The percentage of lipids that were found to exhibit a circadian pattern of accumulation in livers of PER1/2 −/− mice based on JTK_CYCLE analysis (6 time points, n=4 for each, P value <0.05). Out of the 159 measured and identified lipids, 25 lipids exhibited circadian pattern of accumulation. B., Oscillating lipids species distributed according to their types. C., Accumulation profiles of representative oscillating TAG presented as mean +/− STDEV. Circadian Time (CT). D., The percentage of the oscillating lipid species within each lipid type. E., Day-time distribution of peak phases of oscillating lipids. TAG in orange, PC in green, PE in light blue, CAR in blue, and CER in yellow. See also Figure S2 and Figure S3.
Figure 4
Figure 4. Analysis of feeding and clock-dependency of circadian hepatic TAG accumulation
A., Profile of oscillating TAG identified based on JTK_CYCLE analysis for WT and Per1/2 −/− mice fed either ad libitum or exclusively during the night. Data are presented as mean +/− STDEV of fold induction for all oscillating TAG relative to the lowest point for each one. B., Accumulation profiles of total TAG levels in livers of WT and Per1/2 −/− mice fed either ad libitum or exclusively during the night. Data are presented as mean +/− STDEV of fold induction for total TAG levels relative to the lowest point. The corresponding P values based on JTK_CYCLE analysis were 0.31, 0.03, 0.02, 0.02, respectively. C., A radar plot presenting the circadian food consumption of WT and Per1/2 −/− mice fed either ad libitum or exclusively during the night. The time of day is indicated in hours, and y-axis shows the food consumption in grams. See also Figures S4, S5 and S7, and Table S6.
Figure 5
Figure 5. Dissection of oscillating TAG species based on feeding time and circadian clocks
Overlap analysis between the specific TAG species that oscillated under the different experimental setup. A., WT fed ad libitum and Per1/2 −/− fed ad libitum. B., WT night fed and WT fed ad libitum. C., Per1/2 −/− night fed and Per1/2 −/− fed ad libitum. D., WT fed ad libitum and Per1/2 −/− night fed. E., WT night fed and Per1/2 −/− night fed. F., WT fed ad libitum, WT night fed, Per1/2 −/− fed ad libitum and Per1/2 −/− night fed. For each scheme, the list of overlapping TAG species is detailed. Night Fed (NF).
Figure 6
Figure 6. The effect of feeding time and circadian clocks on total TAG levels in the liver
A., Comparison of the total hepatic levels of the different lipid types, quantified throughout the day, between WT and Per1/2 −/− mice fed ad libitum. B., Comparison of the total hepatic TAG levels, quantified throughout the day in WT fed ad libitum, WT night fed, Per1/2 −/− fed ad libitum and Per1/2 −/− night fed mice. C., Comparison of the total daily food intake of WT fed ad libitum, WT night fed, Per1/2 −/− fed ad libitum and Per1/2 −/− night fed mice. The data are presented on a bar graph (mean +/− SEM, n=4 for the lipid analysis and n=8 for the food consumption). Night Fed (NF). P values < 0.05 are marked in * and < 0.01 in **. See also Figure S6.
Figure 7
Figure 7. Circadian expression of enzymes participating in TAG homeostasis and master lipid regulators in WT and Per1/2 null mice
A., WT and Per1/2 −/− mice, fed either ad libitum or exclusively during the night were sacrificed under constant darkness, at 4 h intervals throughout the day. Total RNA was prepared from liver and mRNA expression levels of enzymes participating in TAG metabolism were determined by quantitative real-time PCR and presented as fold change relative to the lowest value. B., Circadian mRNA expression profiles of master lipid regulators in WT and Per1/2 −/− mice fed ad libitum. Data are presented as mean +/− STDEV, with a mix of 4 animals per time point. Dark grey represent the subjective night and light gray the subjective day. C., A schematic model depicting the intricate circadian regulation of hepatic TAG levels by circadian clocks and feeding behavior. Night Fed (NF). Circadian Time (CT).

References

    1. Akhtar RA, Reddy AB, Maywood ES, Clayton JD, King VM, Smith AG, Gant TW, Hastings MH, Kyriacou CP. Circadian cycling of the mouse liver transcriptome, as revealed by cDNA microarray, is driven by the suprachiasmatic nucleus. Curr Biol. 2002;12:540–550. - PubMed
    1. Asher G, Reinke H, Altmeyer M, Gutierrez-Arcelus M, Hottiger MO, Schibler U. Poly(ADP-ribose) polymerase 1 participates in the phase entrainment of circadian clocks to feeding. Cell. 2010;142:943–953. - PubMed
    1. Asher G, Schibler U. Crosstalk between components of circadian and metabolic cycles in mammals. Cell Metab. 2011;13:125–137. - PubMed
    1. Bass J. Circadian topology of metabolism. Nature. 2012;491:348–356. - PubMed
    1. Brown SA, Kowalska E, Dallmann R. (Re)inventing the circadian feedback loop. Dev Cell. 2012;22:477–487. - PubMed

Publication types