. 2014 Feb 7;5(1):9.
doi: 10.1186/2040-2392-5-9.

Engrailed2 modulates cerebellar granule neuron precursor proliferation, differentiation and insulin-like growth factor 1 signaling during postnatal development

Affiliations

Engrailed2 modulates cerebellar granule neuron precursor proliferation, differentiation and insulin-like growth factor 1 signaling during postnatal development

Ian T Rossman et al. Mol Autism. .

Abstract

Background: The homeobox transcription factor Engrailed2 (En2) has been studied extensively in neurodevelopment, particularly in the midbrain/hindbrain region and cerebellum, where it exhibits dynamic patterns of expression and regulates cell patterning and morphogenesis. Because of its roles in regulating cerebellar development and evidence of cerebellar pathology in autism spectrum disorder (ASD), we previously examined an ENGRAILED2 association and found evidence to support EN2 as a susceptibility gene, a finding replicated by several other investigators. However, its functions at the cell biological level remain undefined. In the mouse, En2 gene is expressed in granule neuron precursors (GNPs) just as they exit the cell cycle and begin to differentiate, raising the possibility that En2 may modulate these developmental processes.

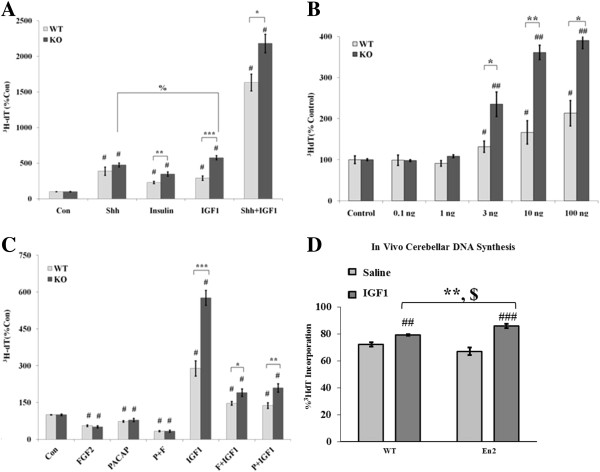
Methods: To define En2 functions, we examined proliferation, differentiation and signaling pathway activation in En2 knockout (KO) and wild-type (WT) GNPs in response to a variety of extracellular growth factors and following En2 cDNA overexpression in cell culture. In vivo analyses of cerebellar GNP proliferation as well as responses to insulin-like growth factor-1 (IGF1) treatment were also conducted.

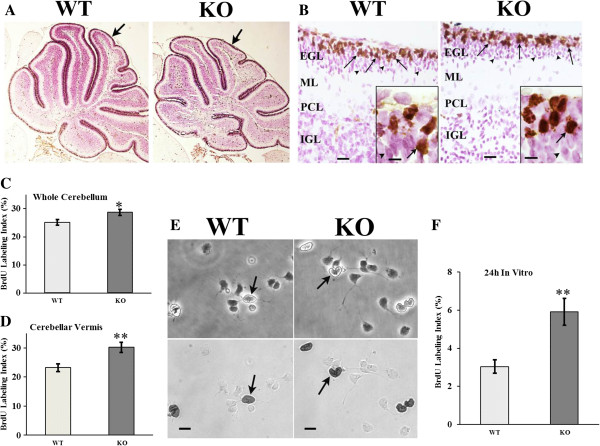
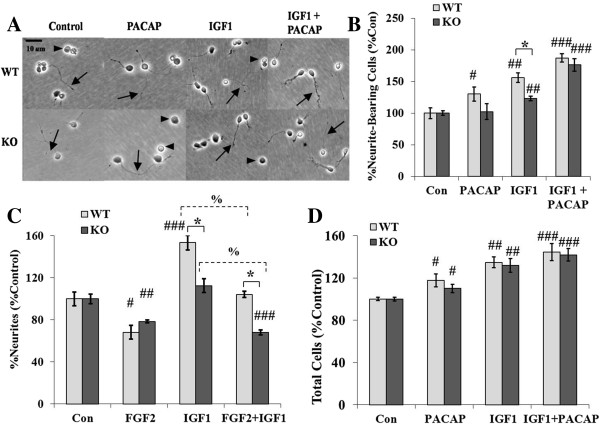
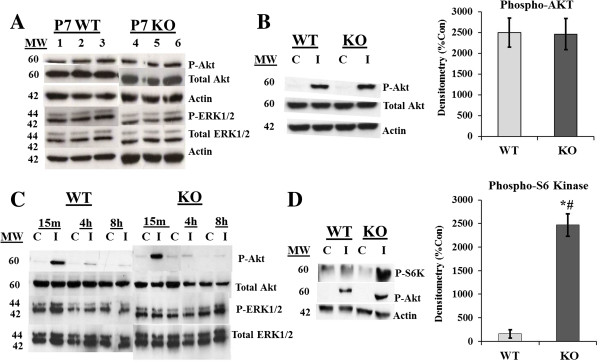
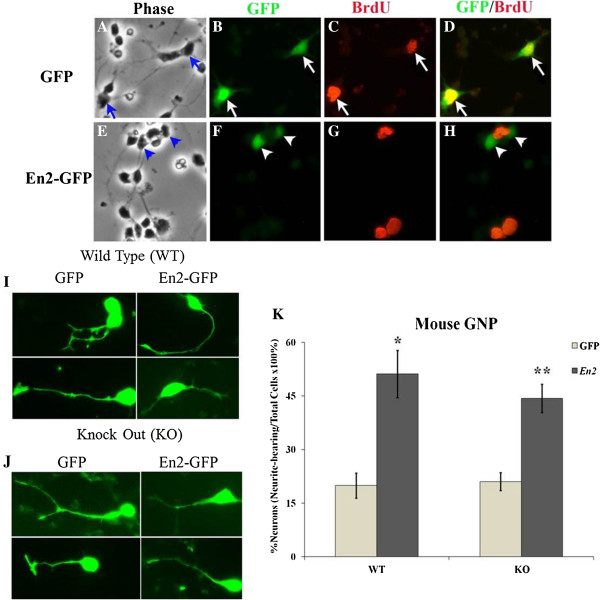
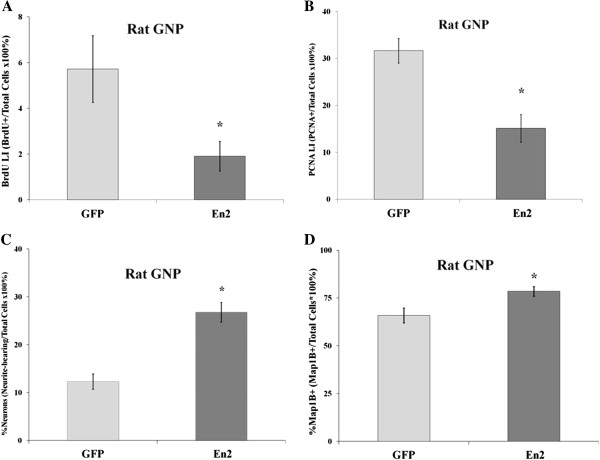
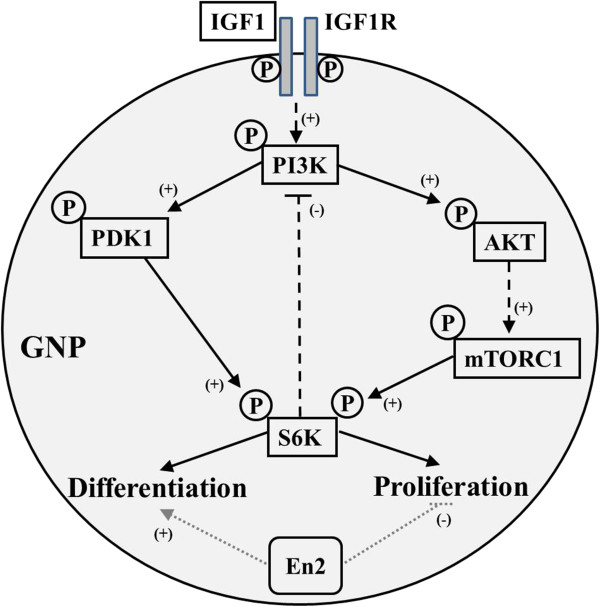
Results: Proliferation markers were increased in KO GNPs in vivo and in 24-h cultures, suggesting En2 normally serves to promote cell cycle exit. Significantly, IGF1 stimulated greater DNA synthesis in KO than WT cells in culture, a finding associated with markedly increased phospho-S6 kinase activation. Similarly, there was three-fold greater DNA synthesis in the KO cerebellum in response to IGF1 in vivo. On the other hand, KO GNPs exhibited reduced neurite outgrowth and differentiation. Conversely, En2 overexpression increased cell cycle exit and promoted neuronal differentiation.

Conclusions: In aggregate, our observations suggest that the ASD-associated gene En2 promotes GNP cell cycle exit and differentiation, and modulates IGF1 activity during postnatal cerebellar development. Thus, genetic/epigenetic alterations of EN2 expression may impact proliferation, differentiation and IGF1 signaling as possible mechanisms that may contribute to ASD pathogenesis.


Figures

Figure 1
Figure 1
GNP proliferation in the cerebellum in vivo and in vitro. P7 WT and KO mice were injected with BrdU and killed 2 h later to perform BrdU LI analysis in the EGL. (A) Low magnification (4×) images of 5-μm sagittal sections from WT and KO cerebellar vermis are shown. As previously described [14,16], the KO cerebellum exhibits an overall smaller size. Arrows point to lobule IV. (B) At higher magnification, representative vermis sections show the middle top portion of the folium of lobule IV. Overall tissue cytoarchitecture appeared similar, and BrdU labeled GNPs were localized normally in both genotypes. Arrows denote proliferating GNPs in the outer EGL immunostained for S-phase marker BrdU; arrowheads denote post-mitotic GNPs in the inner EGL. Insets show cells in the EGL. Bar = 50 μm; inset bar = 10 μm. (C) When assessed across the entire extent of the cerebellum, the BrdU LI was moderately increased in the KO. (D) There was a greater increase in the KO LI when assessed within the cerebellar vermis. N = 4-5 animals per genotype; 8–14 sections were counted per entire cerebellum; 4–6 sections were counted per vermis region. (E) Twenty-four-hour cultures of WT and KO GNPs in control media are shown after fixation and BrdU immunocytochemisty. Upper panels show isolated GNPs under phase microscopy, whereas lower panels reveal brightfield images. Arrows point to cells in phase that exhibit BrdU immunostaining in lower panels. Bar = 10 μm. (F) The GNP BrdU LI in vitro was two-fold greater in the KO compared to WT cells. For each experiment, GNPs were isolated from groups of 4–6 mice per genotype. N = 3 culture dishes per genotype per experiment, and three experiments were performed. EGL: External germinal layer; ML: molecular Layer; PCL: Purkinje cell layer; IGL: inner granule layer. t-test: *p ≤ 0.05; **p ≤ 0.01.
Figure 2
Figure 2
IGF1 stimulates greater DNA synthesis in En2 KO GNPs in culture and in vivo. (A) Mitogenic stimulation of KO and WT GNPs was measured in 24 h cultures using 3H-dT incorporation. IGF1 (10 ng/ml) and high-dose insulin (10 μg/ml) differentially increased KO DNA synthesis compared to WT, while Shh (3 μg/ml) elicited similar increases in both genotypes. Co-administration of IGF1 and Shh synergistically increased DNA synthesis, though differential genotype responses to IGF1 remained. Data presented as percent control 3H-dT incorporation ± SEM; control: 350–550 cpm/well; growth factors: 800–2,200 cpm/well; 4–6 mice/genotype/experiment; 3–6 wells/treatment/experiment, derived from three experiments. (B) IGF1 elicited differential genotype responses at doses above 1 ng/ml (Note: IGF1 elicited 3-4-fold increased KO DNA synthesis in Figure 2A-B; WT responses were less consistent across experiments.) N = 6-9 wells/group, from 3 experiments. (C) Anti-mitogens reduced DNA synthesis similarly across genotypes. FGF2 (10 ng/ml) and PACAP (10 nM) attenuated, but did not abolish, differential genotype responses to IGF1. N = 6-9 wells/group from three experiments. (D) In vivo, IGF1 (10μg/gbw) also differentially increased cerebellar 3H-dT incorporation (see Methods). 3H-dT incorporation after saline injection was not different between genotypes (WT = 73% + 1.6; KO = 66% + 3.5; p = 0.08). IGF1 significantly increased DNA synthesis over saline injection in both genotypes, however WT DNA synthesis increased 9.7% while KO DNA synthesis increased 28%. Two-way ANOVA yielded significant genotype × IGF1 interaction. KO: N = 9 saline, N = 6 IGF1; WT: N = 12 saline, N = 6 IGF1; N = 6 experiments, a minimum of one pup per genotype was injected with saline and IGF1 in each experiment. Con: Control; F: FGF2; P: PACAP: t-test *, compared between genotypes, p < 0.05; **p < 0.01; ***p < 0.001; t-test #, compared to genotype control, p < 0.05; ##p < 0.01; ###p < 0.001; %, compared within genotype, p < 0.05; $: two-way ANOVA, IGF1 F(1,29) = 28.5, p < 0.0001, genotype F(1,29) = 0.11, p = 0.74, genotype × IGF1 interaction F(1,29) = 4.88, p = 0.035.
Figure 3
Figure 3
En2 KO GNPs exhibit normal survival but diminished response to neuritogenic signals compared to WT GNPs. KO and WT GNPs were cultured in defined media without and with PACAP (10 nM), IGF1 (10 ng/ml) or both, and the percent of living, neurite-bearing cells was assessed under phase microscopy. (A) KO and WT GNP morphology was qualitatively similar in response to PACAP and IGF1, though numbers of neurite-bearing cells differed, as quantified in B-C. Arrows denote neurites extending many cell bodies from neuronal somas. Arrowheads identify cells without neurites >2 cell somas. (B) PACAP and IGF1 each induced fewer neurite-bearing KO GNPs compared to WT GNPs. However, in combination IGF1 and PACAP stimulated KO GNP neuritogenesis equivalent to WT. For each group, 2–3 dishes were assessed in each experiment for each genotype, derived from three experiments, yielding N = 6-9 dishes/group/genotype. (C) Anti-mitogenic growth factors failed to overcome differentiation deficits observed in the absence of En2. FGF2 reduced neurite outgrowth in both genotypes, whereas IGF1 again stimulated neuritogenesis in WT cells only. In combined factor treatment, WT cells exhibited outgrowth equivalent to control media, but KO cells displayed outgrowth inhibition similar to FGF2 treatment alone. These data suggest cell cycle exit and differentiation are mediated through different pathways in GNPs, and the absence of En2 reduces IGF1 neuritogenic effects. N = 6-14 dishes/group/genotype. (D) Cell survival is similar in 24-h culture in WT and KO GNPs in response to trophic factors (compared to counts at 2 h; 200–400 cells counted/dish at 24 h), suggesting differences in DNA synthesis and neuritogenesis are unlikely to reflect differences in survival or death. N = 6-11 dishes/group/genotype. t-test *, compared between genotypes, p ≤ 0.05; t-test #, compared to genotype control, p ≤ 0.05; ## p ≤ 0.01; ### p ≤ 0.001; t-test %, compared within genotype, p ≤ 0.0001.
Figure 4
Figure 4
IGF1 induces greater levels of phospho-S6 kinase in KO GNPs compared to WT cells. (A) Untreated cerebellar lysates from freshly dissected 7-day-old (P7) WT and KO mice demonstrate identical baseline levels of both P-Akt and P-ERK. (B) The levels of P-Akt protein induced by a 30-min pulse of IGF1 was quantified in WT and KO GNPs by Western blot with densitometric analysis, and no significant differences were found between genotypes (C = control; I = IGF1). (C) IGF1 induced robust, but similar increases in P-Akt in both WT and KO GNPs after a 15-min pulse. This effect was attenuated at 4 h and 8 h, and no activity was found at 24 h (data not shown). P-ERK, on the other hand, appeared constitutively activated in these culture conditions, with no change in levels in either genotype following IGF1 treatment. (D) Phospho-S6 kinase, which is downstream of Akt, was markedly upregulated in KO GNPs pulsed 30 min with IGF1 compared to untreated GNPs. In contrast, IGF1 failed to upregulate phospho-S6 kinase in WT GNPs (though it robustly increased P-Akt), suggesting En2 may be an important negative regulator of the S6 kinase pathway. Total S6 kinase protein levels were not different between genotypes (not shown). Densitometry quantification in B and D is expressed in arbitrary units as percent control ± SEM. n = 3 experiments per genotype (3 animals per experiment, per genotype); #, Significance compared to genotype control, p ≤ 0.05; **, significance compared across genotypes, p ≤ 0.01.
Figure 5
Figure 5
Overexpression of En2 cDNA decreases mitotic labeling and increases neurite outgrowth of P7 mouse GNPs. P7 mouse GNPs were transfected for 5 h with GFP control or En2-GFP cDNA vectors and 24 h later following BrdU treatment were fixed and immunostained for BrdU. Transfection efficiency was approximately 10% for each vector, with similar total numbers of transfected cells. Cells are shown (400×) under phase (A, E) or fluorescence (B-D; F-H) microscopy, after transfection with GFP control vector (A-D) and En2-GFP vector (E-H), revealing GFP (green; B, F), BrdU (red; C, G) and double labeling (D, H). Arrows point to double-labeled cells in A-D, whereas arrowheads in E-H identify cells that express GFP only, separate from cells with BrdU signal. (I) Examples of GNPs from WT mice transfected with GFP control and En2-GFP vectors that extend neurites >2 cell somas exhibiting a range in size. (J) Examples of GNPs from KO mice transfected with GFP and En2-GFP vectors that extend neurites >2 cell somas. (K)En2 overexpression increased the proportion of GNPs exhibiting neuronal morphologies by 2.5-fold in WT cells as well as by two-fold in KO cells. n = 6-15, each vector, 3–5 experiments; *, significance between GFP and En2, p ≤ 0.05; **, p ≤ 0.01.
Figure 6
Figure 6
En2 cDNA overexpression in P7 rat GNPs also elicits reduced proliferation and increased neurite outgrowth. (A) Following En2 overexpression, the BrdU LI of rat GNP at ~30 h was reduced by 67%. (B) PCNA expression was reduced 52% in P7 rat GNPs following En2 overexpression; n = 6 each vector. Data are expressed as percent PCNA + GFP+/total GFP + cells. N = 6-12 for each vector, 3 experiments. *,p ≤ 0.05. (C) Overexpression of En2 in rat GNPs doubled the proportion of cells with neuronal morphologies, replicating results observed in mouse. (D) Overexpression of En2 in rat GNPs increased the proportion of Map1b + cells among all GFP + cells, including neurite-bearing and non-neurite-bearing cells, suggesting En2 may serve to promote differentiation prior to the onset of neurite outgrowth. n = 6-15, each vector, 3–5 experiments; *, significance between GFP and En2, p ≤ 0.05.
Figure 7
Figure 7
En2 modulates IGF1’s pleiotropic effects in GNPs, potentially through altered S6 kinase activation. While En2 expression appeared to have no effect on IGF1 activation of the PI3K pathway at the level of Akt phosphorylation, the absence of En2 caused increased phosphorylation of S6 kinase. Thus, we propose a model in which En2 expression in postnatal GNPs promotes differentiation and inhibits proliferation via disruption of S6 kinase activation, a well-characterized promitogenic signal. Potential targets for En2 may include PDK1 and mTORC1, which directly phosphorylate S6K, though these interactions remain to be explored. Alternatively, En2 may alter feedback inhibition between the S6K and the PI3K pathway. Dashed lines signify indirect pathways. Arrows and (+) indicate activation. Flat head and (-) indicate inhibition. GNP = Granule neuron precursor. IGF1R = Insulin-like growth factor-1 receptor. P = Phosphorylation.

Similar articles

Cited by

References

    1. Davis CA, Noble-Topham SE, Rossant J, Joyner AL. Expression of the homeo box-containing gene En-2 delineates a specific region of the developing mouse brain. Genes Dev. 1988;2:361–371. doi: 10.1101/gad.2.3.361. - DOI - PubMed
    1. Joyner AL. Engrailed, Wnt and Pax genes regulate midbrain–hindbrain development. Trends Genet. 1996;12:15–20. doi: 10.1016/0168-9525(96)81383-7. - DOI - PubMed
    1. Bauman ML, Kemper TL. Neuroanatomic observations of the brain in autism: a review and future directions. Int J Dev Neurosci. 2005;23:183–187. doi: 10.1016/j.ijdevneu.2004.09.006. - DOI - PubMed
    1. Piven J, Saliba K, Bailey J, Arndt S. An MRI study of autism: the cerebellum revisited. Neurology. 1997;49:546–551. doi: 10.1212/WNL.49.2.546. - DOI - PubMed
    1. Scott JA, Schumann CM, Goodlin-Jones BL, Amaral DG. A comprehensive volumetric analysis of the cerebellum in children and adolescents with autism spectrum disorder. Autism Res. 2009;2:246–257. doi: 10.1002/aur.97. - DOI - PMC - PubMed