. 2014 Feb 4;106(3):752-62.
doi: 10.1016/j.bpj.2013.12.020.

The wall-stress footprint of blood cells flowing in microvessels

Affiliations

The wall-stress footprint of blood cells flowing in microvessels

Jonathan B Freund et al. Biophys J. .

Abstract

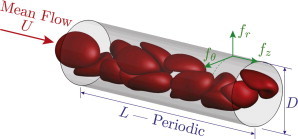
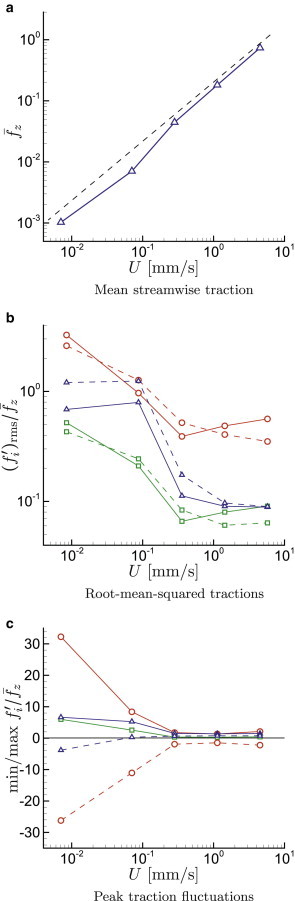
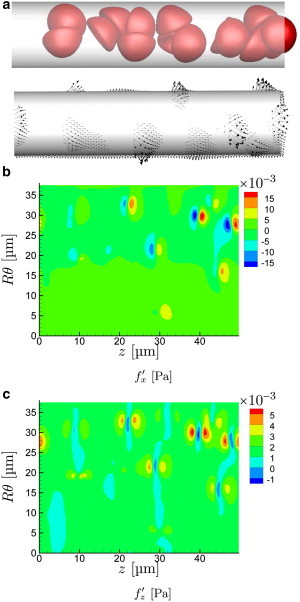
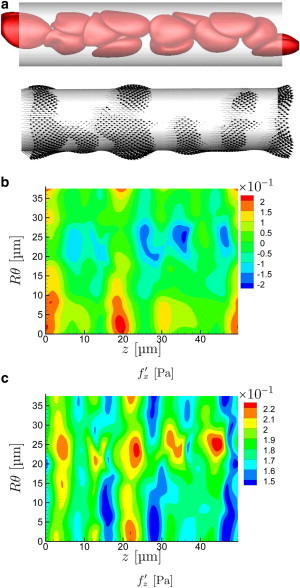
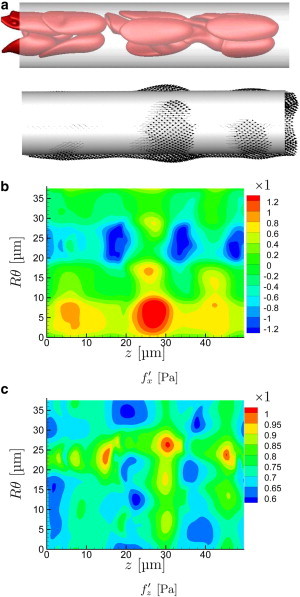
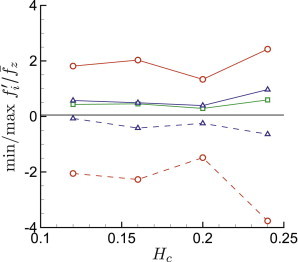
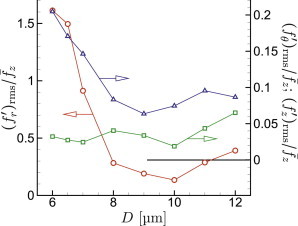
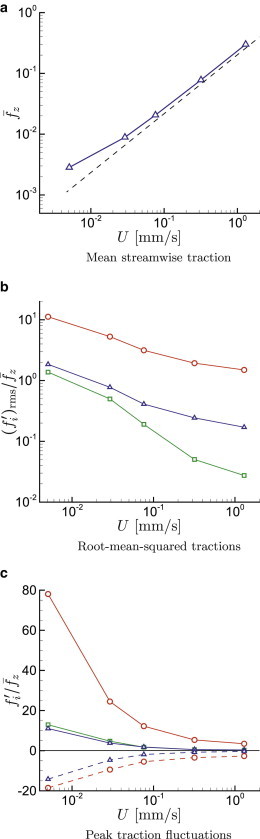
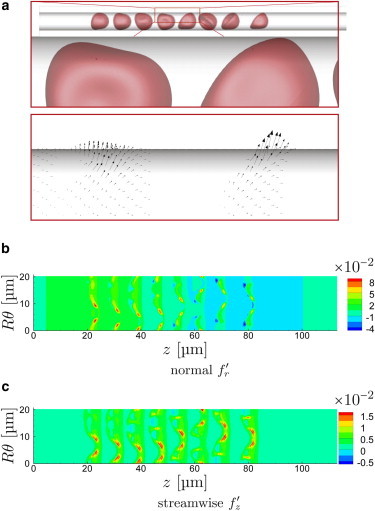
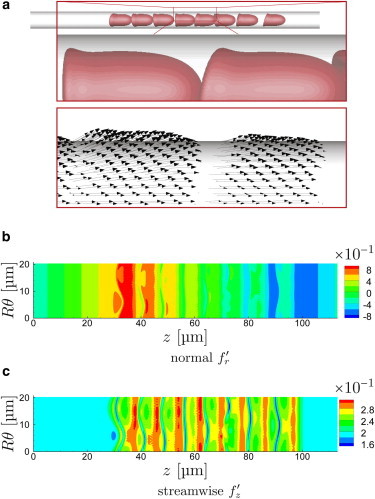
It is well known that mechanotransduction of hemodynamic forces mediates cellular processes, particularly those that lead to vascular development and maintenance. Both the strength and space-time character of these forces have been shown to affect remodeling and morphogenesis. However, the role of blood cells in the process remains unclear. We investigate the possibility that in the smallest vessels blood's cellular character of itself will lead to forces fundamentally different than the time-averaged forces usually considered, with fluctuations that may significantly exceed their mean values. This is quantitated through the use of a detailed simulation model of microvessel flow in two principal configurations: a diameter D=6.5 μm tube-a model for small capillaries through which red blood cells flow in single-file-and a D=12 μm tube-a model for a nascent vein or artery through which the cells flow in a confined yet chaotic fashion. Results in both cases show strong sensitivity to the mean flow speed U. Peak stresses exceed their means by greater than a factor of 10 when U/D≲10 s(-1), which corresponds to the inverse relaxation time of a healthy red blood cell. This effect is more significant for smaller D cases. At faster flow rates, including those more commonly observed under normal, nominally static physiological conditions, the peak fluctuations are more comparable with the mean shear stress. Implications for mechanotransduction of hemodynamic forces are discussed.


Figures

Figure 1
Figure 1
Schematics showing the anticipated mechanism for wall stress τ to increase from (a) a plasma-only Poiseuille flow model, to (b) a mean cellular flow with higher effective viscosity and blunted mean flow profile, to (c) the instantaneous wall stress fluctuation because of a passing blood cell. To see this figure in color, go online.
Figure 2
Figure 2
Simulation schematic showing streamwise fz, wall-normal fr, and circumferential fθ wall traction components. To see this figure in color, go online.
Figure 3
Figure 3
Cases with Hc=0.2, D=12μm from Table 1: (a) Mean streamwise wall traction f¯z; (b) relative root-mean-squared surface traction in the normal fr, circumferential fθ□, and streamwise fz directions, for λ=5 (solid line) and λ=1 (dashed line); (c) for λ=5, the maximum (solid line) and minimum (dashed line) wall traction perturbations during simulations: fr/f¯z, □ |fθ|/f¯z, and fz/f¯z. To see this figure in color, go online.
Figure 4
Figure 4
For a particular time in the D=12μm, U/D=0.71 s−1 case, the frames show visualization of (a) cell positions and instantaneous tractions exerted on the wall, and (b) wall-normal and (c) streamwise fluctuation components. The angle θ=0 in (b) and (c) is at the bottom and θ=3π/2 is halfway up the in-view portion of the tube as oriented in (a). (An animation of this flow is shown in supplemental Movie S1.) To see this figure in color, go online.
Figure 5
Figure 5
Same as Fig. 4 for U/D=119 s−1. (An animation of this flow is shown in supplemental Movie S2.) To see this figure in color, go online.
Figure 6
Figure 6
Same as Fig. 4 for U/D=478 s−1. (An animation of this flow is shown in supplemental Movie S3.) To see this figure in color, go online.
Figure 7
Figure 7
Relative peak wall tractions for D=12μm versus hematocrit Hc: normal fr, circumferential fθ□, and streamwise fz directions components. To see this figure in color, go online.
Figure 8
Figure 8
Relative root-mean-square wall traction for U4.5 mm/s versus vessel diameter: normal fr, circumferential fθ□, and streamwise fz components. To see this figure in color, go online.
Figure 9
Figure 9
Cases with Hc=0.2, D=6.5μm from Table 1: (a) Mean streamwise wall traction f¯z; (b) relative root-mean-square wall traction in the normal fr, circumferential fθ□, and streamwise fz directions, (c) for λ=5, the maximum (solid line) and minimum (dashed line) wall traction perturbations during simulations: fr/f¯z, □ |fθ|/f¯z, and fz/f¯z. To see this figure in color, go online.
Figure 10
Figure 10
Same as Fig. 4 for D=6.5μm, U/D=0.78 s−1. (An animation of this flow is shown in supplemental Movie S4.) To see this figure in color, go online.
Figure 11
Figure 11
Same as Fig. 4 for D=6.5μm, U/D=200 s−1. (An animation of this flow is shown in supplemental Movie S5.) To see this figure in color, go online.

References

    1. Chapman W.B. The effect of the heart-beat upon the development of the vascular system in the chick. Am. J. Anat. 1918;23:175–203.
    1. Roman B.L., Pekkan K. Mechanotransduction in embryonic vascular development. Biomech. Model. Mechanobiol. 2012;11:1149–1168. - PMC - PubMed
    1. Nicoli S., Standley C., Lawson N.D. MicroRNA-mediated integration of haemodynamics and Vegf signalling during angiogenesis. Nature. 2010;464:1196–1200. - PMC - PubMed
    1. Wang L., Zhang P., Liu F. A blood flow-dependent klf2a-NO signaling cascade is required for stabilization of hematopoietic stem cell programming in zebrafish embryos. Blood. 2011;118:4102–4110. - PubMed
    1. Liu D., Krueger J., Le Noble F. The role of blood flow and microRNAs in blood vessel development. Int. J. Dev. Biol. 2011;55:419–429. - PubMed

Publication types

LinkOut - more resources