. 2014 Feb 27;6(4):709-23.
doi: 10.1016/j.celrep.2014.01.012. Epub 2014 Feb 6.

E3 ubiquitin ligase Cbl-b suppresses proallergic T cell development and allergic airway inflammation

Affiliations

E3 ubiquitin ligase Cbl-b suppresses proallergic T cell development and allergic airway inflammation

Guilin Qiao et al. Cell Rep. .

Abstract

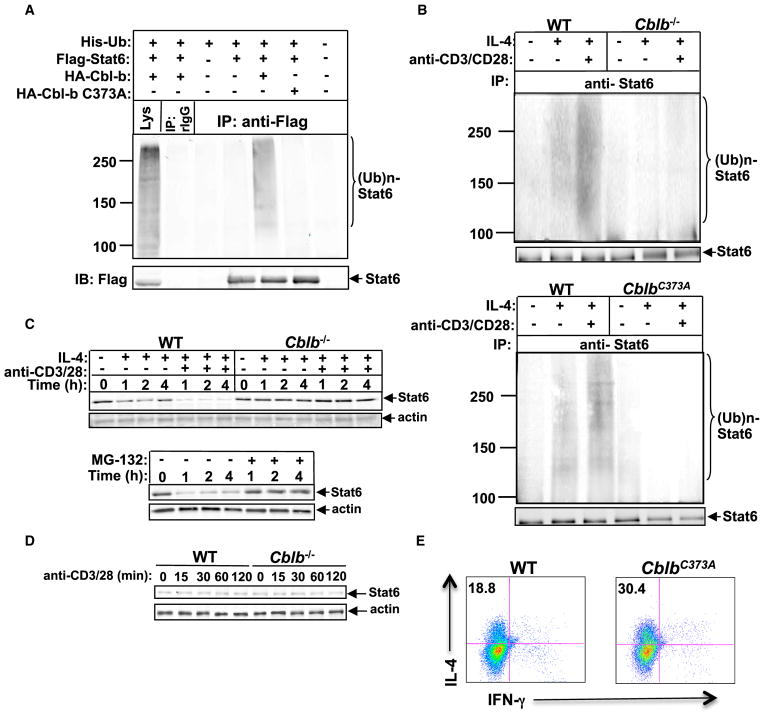
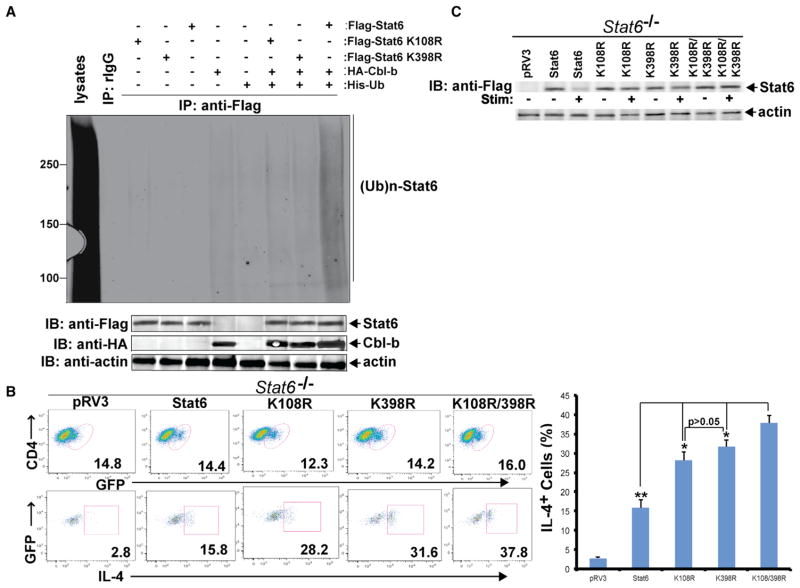
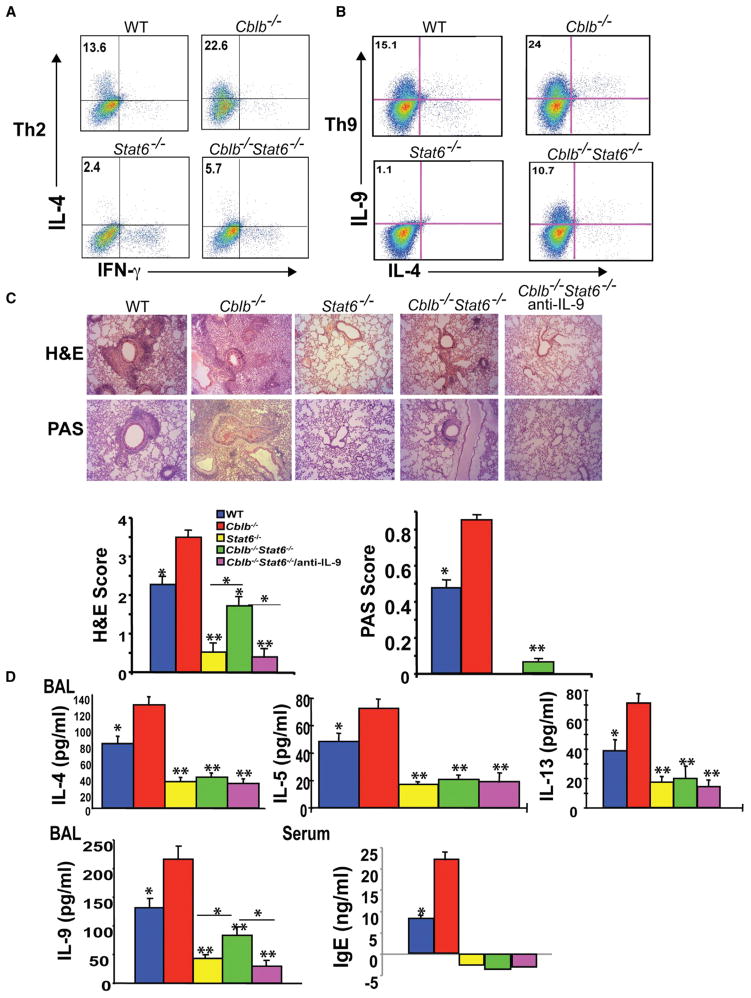
E3 ubiquitin ligase Cbl-b has emerged as a gatekeeper that controls the activation threshold of the T cell antigen receptor and maintains the balance between tolerance and autoimmunity. Here, we report that the loss of Cbl-b facilitates T helper 2 (Th2) and Th9 cell differentiation in vitro. In a mouse model of asthma, the absence of Cbl-b results in severe airway inflammation and stronger Th2 and Th9 responses. Mechanistically, Cbl-b selectively associates with Stat6 upon IL-4 ligation and targets Stat6 for ubiquitination and degradation. These processes are heightened in the presence of T cell receptor (TCR)/CD28 costimulation. Furthermore, we identify K108 and K398 as Stat6 ubiquitination sites. Intriguingly, introducing Stat6 deficiency into Cblb(-/-) mice abrogates hyper-Th2 responses but only partially attenuates Th9 responses. Therefore, our data reveal a function for Cbl-b in the regulation of Th2 and Th9 cell differentiation.


Figures

Figure 1
Figure 1. Loss of Cbl-b Favors Th2 and Th9 Cell Differentiation In Vitro
(A) ELISA results for cytokine production of purified naive CD4+CD25CD62LhiCD44lo T cells from WT or Cblb−/− mice upon stimulation with plate-bound anti-CD3 plus anti-CD28 for 48 hr (*p < 0.05, compared with Cblb−/− mice). (B and C) Intracellular staining of Th1, Th2, Th9, and Th17 cells differentiated in vitro from purified naive CD4+CD25CD62LhiCD44lo T cells of WT or Cblb−/− mice. Numbers in the quadrants in (B) indicate the percentage of IL-4/IFN-γ-producing cells in the CD4+ population. Numbers in the quadrants in (C) indicate the percentage of IL-17/IL-9-producing cells in the CD4+ population. (D) Intracellular staining of Th2 cells and Th9 cells differentiated in vitro from DO11.10 and DO11.10.Cblb−/− naive CD4+ cells. Numbers in the quadrants indicate the percentage of IL-4- and IL-9-producing cells. Data are representative of three independent experiments.
Figure 2
Figure 2. Cblb−/− Mice Are Highly Susceptible to Asthma Induction and Display Heightened Th2 and Th9 Responses
(A) Airway inflammation and mucus production in OVA-sensitized WT and Cblb−/− mice as determined by H&E staining (top) and PAS staining (bottom). Original magnification, ×40 (H&E), ×100 (PAS). Semiquantitative analysis of the severity of peribronchial inflammation and the abundance of PAS-positive mucus-containing cells was performed (n = 5; *p < 0.05, compared with Cblb−/− mice). (B) Inflammatory cells from BAL fluid. (C) Respiratory system resistance (Rsr) in WT and Cblb−/− mice after OVA rechallenge. (D) Serum IgE and BAL IFN-γ, IL-4, IL-5, IL-9, and IL-13 detected by ELISA (*p < 0.05 and **p < 0.01, compared with Cblb−/− mice). (E) H&E staining of lungs in BALB/c nude mice (n = 4) that were adoptively transferred (i.v.) with naive CD4+ T cells (5 ×10⁶) from WT or Cblb−/− mice, permitted to equilibrate 30 days to avoid homeostatic proliferation, and immunized with OVA as in (A). Original magnification ×100. (F) IFN-γ, IL-4, IL-5, IL-9, and IL-13 concentrations in the BAL fluid and IgE in the serum of OVA-sensitized BALB/c nude mice receiving naive WT or Cblb−/− CD4+ T cells, detected by ELISA (*p < 0.05 and **p < 0.01, compared with Cblb−/− mice). Data represent three independent experiments (mean ± SD).
Figure 3
Figure 3. Loss of Cbl-b Results in Heightened Activation of Stat6
(A) Immunoassay of phosphorylation of JAK-1, JAK-3, and Stat6 in CD4+ T cells of WT and Cblb−/− mice treated with mouse IL-4 (5 ng/ml) at different times. (B) Flow-cytometric analysis of the phosphorylation of Stat6 at Y641 in WT and Cblb−/− CD4+ T cells during Th2 cell differentiation. (C) Immunoassay of transcription factors (Stat6, GATA3, c-Maf, JunB, IRF4, and T-bet) in nuclear extracts of differentiated Th1, Th2, and Th9 cells from WT and Cblb−/− mice in response to anti-CD3 restimulation for 4 hr. β-actin was used to indicate equal protein loading. (D) ChIP assay of Stat6 binding to the Gata3 S7 region or the Il9 promoter region in nuclear extracts of naive WT and Cblb−/−CD4+ T cells stimulated with anti-CD3, anti-CD28, and IL-4, or anti-CD3, anti-CD28, IL-4, and TGF-β for 0.5 hr and 24 hr. The band intensities were quantified using the Li-Cor Odyssey Imaging System. (E) Naive CD4+ T cells from WT and Cblb−/− mice cultured under Th2 differentiation conditions and retrovirally transfected with two bicistronic retroviruses expressing GFP-GATA3 or GFP vector. The IL-4-expressing cells were assessed by intracellular staining. Data shown are gated on the GFP+ population. Data are representative of three independent experiments.
Figure 4
Figure 4. Stat6 Specifically Associates with Cbl-b upon IL-4 or TCR/CD28 Stimulation
(A) Immunoprecipitation (IP) of proteins from CD4+ T cells purified from BALB/c mice treated with mouse IL-4 (5 ng/ml), anti-CD3 plus anti-CD28, or both for 15 min with anti-Stat6, anti-GATA-3, anti-c-Maf, and anti-JunB, respectively, and blotted with anti-Cbl-b or anti-c-Cbl. (B) Affinity precipitation of lysates from CD4+ T cells stimulated with IL-4 or anti-CD3 plus anti-CD28, or both with GST or GST-Stat6 (aa 1–680), captured by glutathione sepharose beads, and analyzed by immunoblot analysis with antibodies against Cbl-b, Itch, TRAF-2, TRAF-6, c-Cbl, and Nedd4. The expression of GST fusion protein was confirmed by anti-GST immunoblotting. (C) Schematic design of Cbl-b mutants. (D) Top: IP of proteins from lysates of 293T cells transiently transfected with Flag-tagged Stat6 and HA-tagged Cbl-b, or Cbl-b N1/3 or Cbl-b C2/3 mutants and treated with IL-4 with anti-HA, followed by immunoblot analysis with anti-Flag. Middle and bottom: immunoblot analysis of whole-cell lysates with anti-HA and anti-Flag. (E) Schematic design of Stat6 mutants. (F) Affinity precipitation of proteins from lysates of BALB/c CD4+ T cells stimulated with or without anti-CD3 and anti-CD28 with GST-Stat6, GST-Stat6 TAD, or GST-Stat6 SH2 mutant, captured by glutathione sepharose beads, and analyzed by immunoblot analysis with anti-Cbl-b. Immunoblot analysis of whole-cell lysates with anti-Cbl-b was used as a loading control. (G) Top: IP of cytosolic and nuclear extracts of naive WT CD4+ T cells stimulated with anti-CD3, anti-CD28, and IL-4 for 0, 5, 15, 30, 60, and 90 min with anti-Stat6, and blotted with anti-Cbl-b and anti-Stat6, respectively. Bottom: Immunoblot analysis of the cytosolic and nuclear extracts with anti-G6DPH (for detection of cytoplasmic protein), and anti-YY1 (for detection of nuclear protein), respectively. Data represent one of three independent experiments.
Figure 5
Figure 5. Cbl-b Is the E3 Ubiquitin Ligase for Stat6
(A) IP of proteins from lysates of 293T cells transiently transfected with plasmids encoding with Flag-tagged Stat6, HA-tagged Cbl-b, or Cbl-b C373A mutant, and His-tagged ubiquitin with anti-Flag, followed by immunoblot analysis (IB) with anti-Flag and anti-HA, respectively. (B) IP of proteins from CD4+ T cells from WT and Cblb−/− mice (top) or WT and CblbC373A mice (bottom) pretreated with MG-132 for 30 min, and stimulated with IL-4 in the presence or absence of anti-CD3 and anti-CD28 with anti-Stat6, followed by immunoblotting with anti-ubiquitin and reblotting with anti-Stat6. (C) Top: immunoblot analysis of total protein levels of Stat6 of WT and Cblb−/− CD4+ T cells stimulated for 1, 2, and 4 hr with IL-4 in the presence or absence of anti-CD3 plus anti-CD28. Bottom: immunoblot analysis of Stat6 protein expression of WT CD4+ T cells treated with anti-CD3, anti-CD28, and IL-4 for 1, 2, and 4 hr with or without MG-132. Actin was used as a loading control. (D) Immunoblot analysis of Stat6 protein expression of WT and Cblb−/− CD4+ T cells stimulated with anti-CD3 and anti-CD28 for 15, 30, 60, and 120 min. (E) Intracellular staining of Th2 cells differentiated in vitro from purified naive CD4+CD25CD62LhiCD44lo T cells of WT or CblbC373A mice. Numbers in the quadrants indicate the percentage of IL-4/IFN-γ-producing cells in the CD4+ population. Results are representative of three independent experiments.
Figure 6
Figure 6. K108 and K398 Are Stat6 Ubiquitination Sites
(A) IP of lysates of 293T cells transfected with Flag-tagged Stat6, Stat6 K108R, or Stat6 K398R together with HA-tagged Cbl-b and His-tagged ubiquitin with anti-Flag, and followed by immunoblotting with anti-His. The lysates were blotted with anti-Flag, anti-HA, and anti-actin. (B) Intracellular staining of Stat6−/− CD4+ T cells reconstituted with Stat6 or Stat6 K108R, K398R, or both, or an empty vector by lentiviral infection, and differentiated under Th2-polarizing condition with anti-iL-4. Numbers in the quadrants indicate the percentage of GFP+IL-4-producing cells in the CD4+ population. (C) Immunoblotting analysis of lysates of Stat6−/− CD4+ T cells lentivirally reconstituted with Stat6 or Stat6 K108R, Stat6 K398R, or both, and stimulated with anti-CD3, anti-CD28, and IL-4 for 2 hr. Results are representative of two independent experiments.
Figure 7
Figure 7. Loss of Stat6 Abrogates Hyper-Th2 and Th9 Responses in Cblb−/− Mice
(A and B) Intracellular staining of Th2 and Th9 cells differentiated in vitro from purified naive CD4+CD25CD62LhiCD44lo T cells of WT, Cblb−/−, Stat6−/−, and Cblb−/−Stat6−/− mice. Numbers in the quadrants indicate the percentage of IL-4/IFN-γ-producing cells (A) or IL-9/IL-4-producing cells (B) in the CD4+ population. (C) H&E and PAS staining of the lungs of WT, Cblb−/−, Stat6−/−, and Cblb−/−Stat6−/− mice treated or untreated with anti-iL-9. Original magnification ×100 (*p < 0.05 and **p < 0.01, compared with Cblb−/− mice; Mann-Whitney test). (D) ELISA of IFN-γ, IL-4, IL-5, IL-9, and IL-13 concentrations in the BAL fluid and IgE in the serum of OVA-sensitized WT, Cblb−/−, Stat6−/−, and Cblb−/−Stat6−/− mice treated or untreated with anti-iL-9. Data represent three independent experiments (mean ± SD).

Similar articles

Cited by

References

    1. Bachmaier K, Krawczyk C, Kozieradzki I, Kong YY, Sasaki T, Oliveira-dos-Santos AJ, Mariathasan S, Bouchard D, Wakeham A, Itie A, et al. Negative regulation of lymphocyte activation and autoimmunity by the molecular adaptor Cbl-b. Nature. 2000;403:211–216. - PubMed
    1. Bachmaier K, Toya S, Gao X, Triantafillou T, Garrean S, Park GY, Frey RS, Vogel S, Minshall R, Christman JW, et al. E3 ubiquitin ligase Cblb regulates the acute inflammatory response underlying lung injury. Nat Med. 2007;13:920–926. - PubMed
    1. Bettelli E, Oukka M, Kuchroo VK. T(H)-17 cells in the circle of immunity and autoimmunity. Nat Immunol. 2007;8:345–350. - PubMed
    1. Chang HC, Sehra S, Goswami R, Yao W, Yu Q, Stritesky GL, Jabeen R, McKinley C, Ahyi AN, Han L, et al. The transcription factor PU. 1 is required for the development of IL-9-producing T cells and allergic inflammation. Nat Immunol. 2010;11:527–534. - PMC - PubMed
    1. Chatila TA. Interleukin-4 receptor signaling pathways in asthma pathogenesis. Trends Mol Med. 2004;10:493–499. - PubMed

Publication types

MeSH terms