. 2014 Mar;124(3):1268-82.
doi: 10.1172/JCI72030. Epub 2014 Feb 10.

CXCL5-secreting pulmonary epithelial cells drive destructive neutrophilic inflammation in tuberculosis

CXCL5-secreting pulmonary epithelial cells drive destructive neutrophilic inflammation in tuberculosis

Geraldine Nouailles et al. J Clin Invest. 2014 Mar.

Abstract

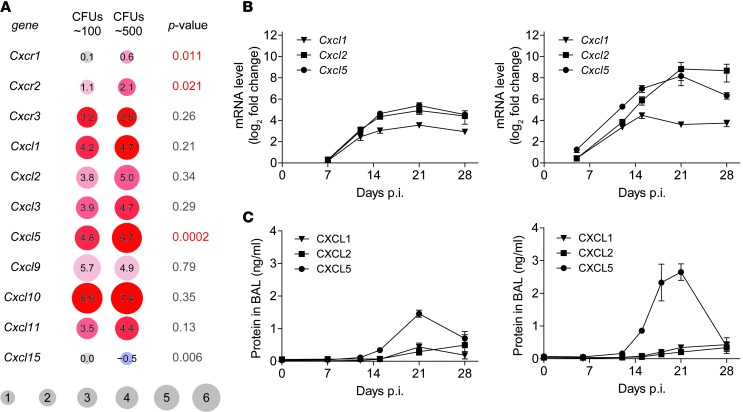
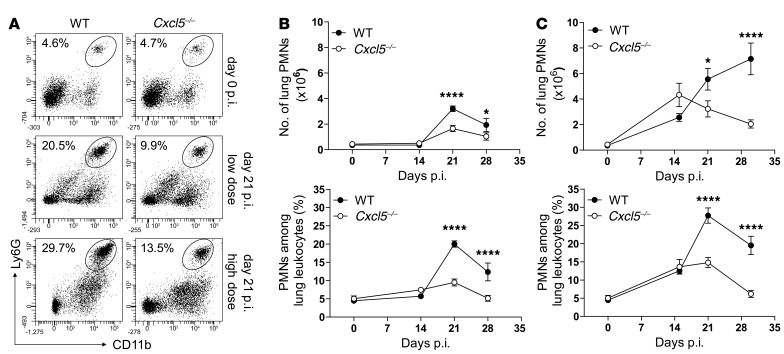
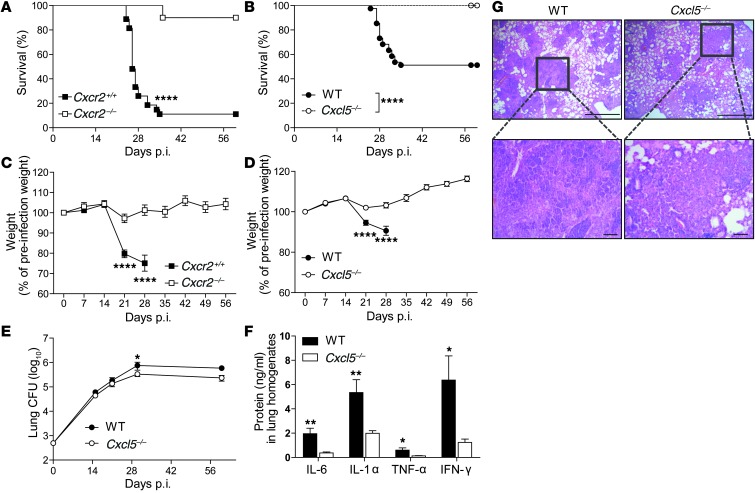
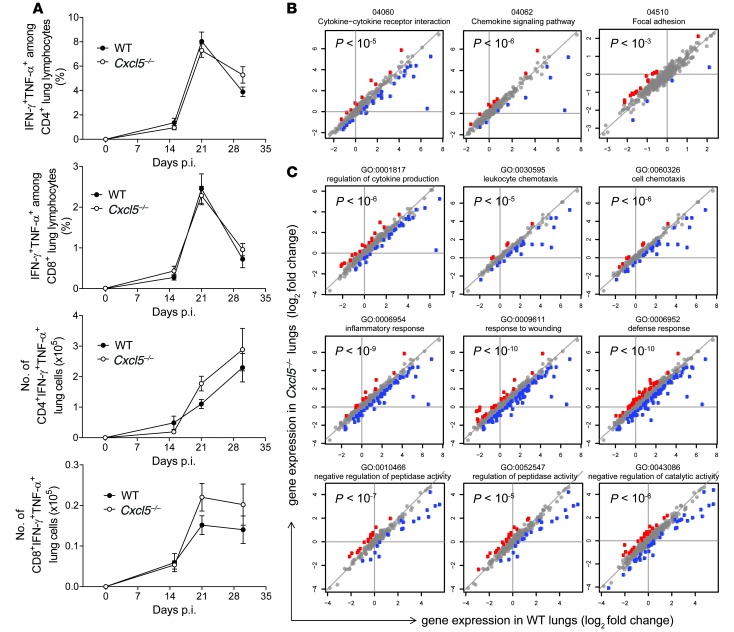
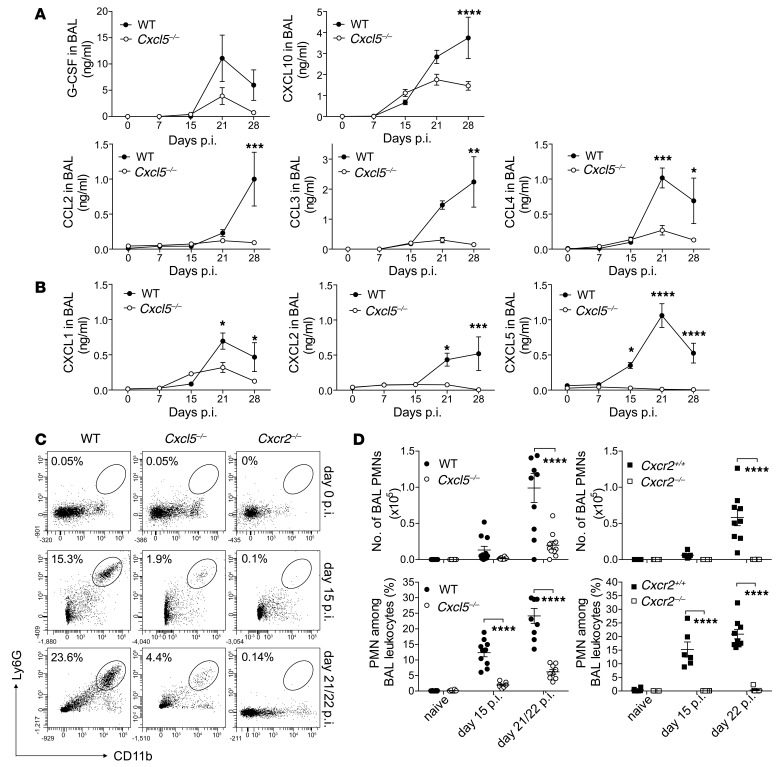
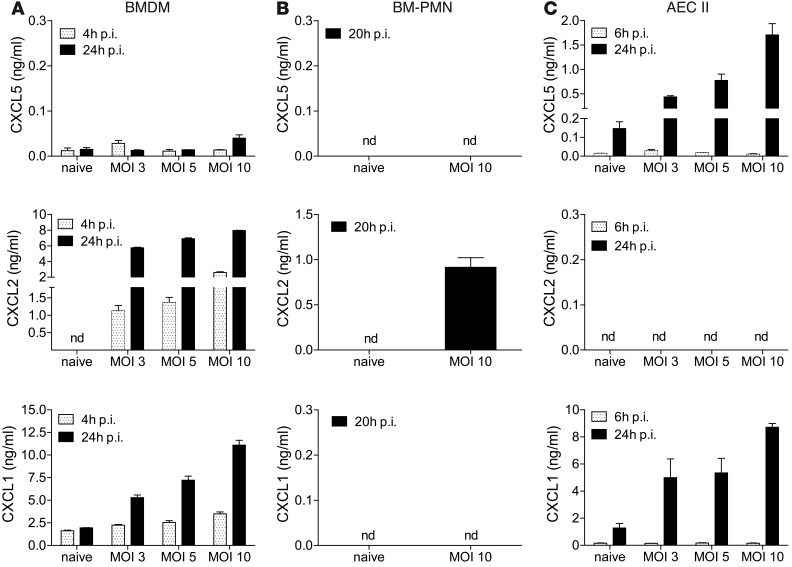
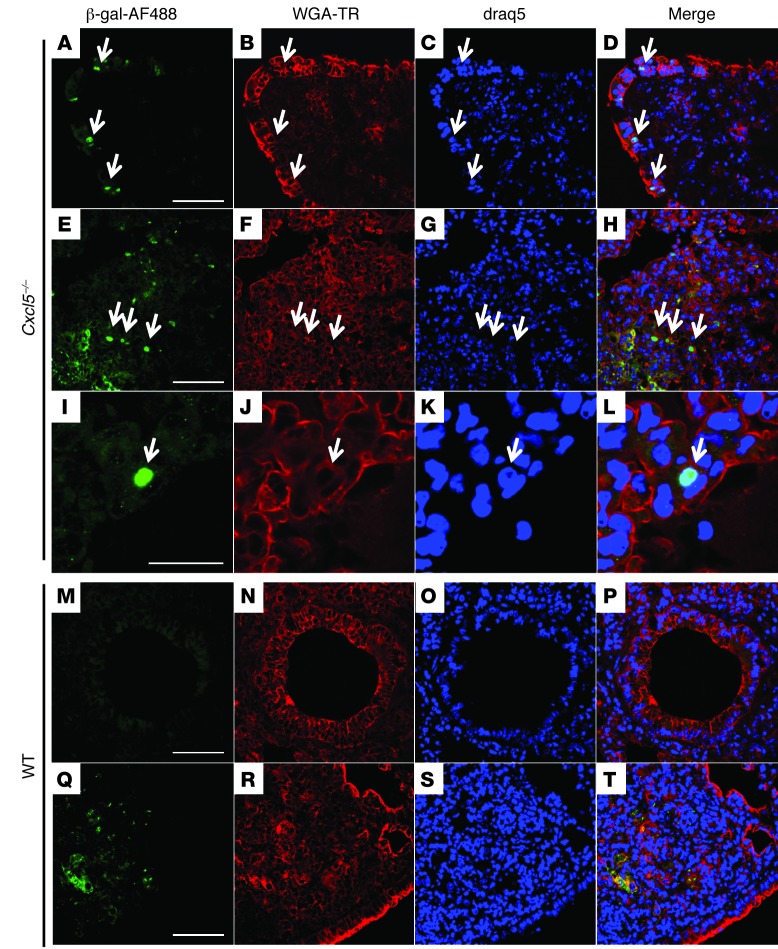
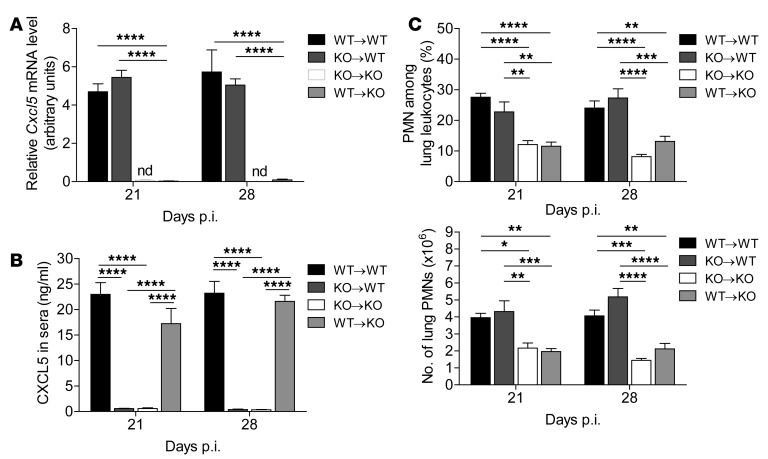
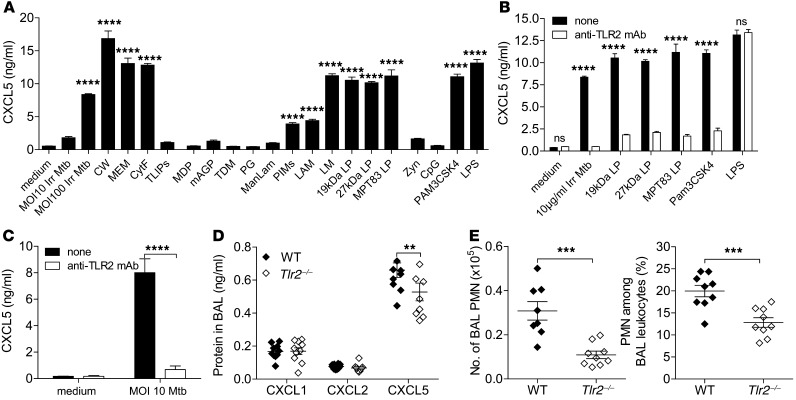
Successful host defense against numerous pulmonary infections depends on bacterial clearance by polymorphonuclear leukocytes (PMNs); however, excessive PMN accumulation can result in life-threatening lung injury. Local expression of CXC chemokines is critical for PMN recruitment. The impact of chemokine-dependent PMN recruitment during pulmonary Mycobacterium tuberculosis infection is not fully understood. Here, we analyzed expression of genes encoding CXC chemokines in M. tuberculosis-infected murine lung tissue and found that M. tuberculosis infection promotes upregulation of Cxcr2 and its ligand Cxcl5. To determine the contribution of CXCL5 in pulmonary PMN recruitment, we generated Cxcl5(-/-) mice and analyzed their immune response against M. tuberculosis. Both Cxcr2(-/-) mice and Cxcl5(-/-) mice, which are deficient for only one of numerous CXCR2 ligands, exhibited enhanced survival compared with that of WT mice following high-dose M. tuberculosis infection. The resistance of Cxcl5(-/-) mice to M. tuberculosis infection was not due to heightened M. tuberculosis clearance but was the result of impaired PMN recruitment, which reduced pulmonary inflammation. Lung epithelial cells were the main source of CXCL5 upon M. tuberculosis infection, and secretion of CXCL5 was reduced by blocking TLR2 signaling. Together, our data indicate that TLR2-induced epithelial-derived CXCL5 is critical for PMN-driven destructive inflammation in pulmonary tuberculosis.


Figures

Figure 1
Figure 1. Expression of CXC chemokine receptors and ligands in lungs of M. tuberculosis–infected mice.
(A) Effect of M. tuberculosis infection dose on chemokine and chemokine receptor gene expression. Comparison of low-dose infection (∼100 CFUs) naive and day 23 p.i. microarray gene expression data and high-dose infection (∼500 CFUs) naive and day 21 p.i. microarray gene expression data. Lungs from 5 WT mice were pooled for microarray analysis. Experiment was performed in duplicate with color swaps. Adjusted P values correspond to interaction between dose and infection. The range of red colors represents the degree of upregulation, with dark red indicating increased upregulation; blue (Cxcl15) represents downregulation. Numbers in circles are log2 fold change. (B) Expression of chemokine mRNA at different time points p.i. in WT lungs following low-dose (left, ∼150 CFUs) and high-dose (right, ∼550 CFUs) infection relative to naive lungs (mean ± SEM; npooled ≥ 8). Data are pooled from 2 independent experiments. (C) Chemokine protein levels in BAL fluid collected at different time points p.i. from WT mice following low-dose (left, ∼150 CFUs) and high-dose (right, ∼550 CFUs) infection (mean ± SEM; npooled = 10). Data are pooled from 2 independent experiments.
Figure 2
Figure 2. Reduced pulmonary PMN recruitment in Cxcl5–/– mice.
(A) Dot plots showing representative frequencies of lung PMNs following low-dose and high-dose M. tuberculosis infection. (B and C) Numbers and frequencies of PMNs among lung leukocytes in (B) naive and low-dose (∼150 CFUs) and (C) high-dose (∼500 CFUs) M. tuberculosis–infected WT and Cxcl5–/– mice determined by flow cytometry (mean ± SEM; npooled = 10 per time point). Each time point shows pooled data from at least 2 independent experiments. Curve data were pooled from a total of 7 independent experiments (2-way ANOVA/Bonferroni post-test). *P < 0.05; ****P < 0.0001.
Figure 3
Figure 3. Absence of CXCL5 or its receptor CXCR2 protects from TB-associated wasting disease and death.
(A) Kaplan-Meier curves showing survival of Cxcr2+/+ (n = 27) and Cxcr2–/– (n = 20) mice after M. tuberculosis infection (∼570 CFUs). Results are pooled from 2 independent experiments (log-rank test). (B) Kaplan-Meier curves showing survival of WT (n = 41) and Cxcl5–/– (n = 36) mice after M. tuberculosis infection (∼500 CFUs). Results are pooled from 4 independent experiments (log-rank test). (C) Relative weight curves of Cxcr2+/+ and Cxcr2–/– mice during M. tuberculosis infection (∼570 CFUs, n ≥ 20 [nWT day 28 p.i. = 9]). Data are pooled from 2 independent experiments. (D) Relative weight curves of WT and Cxcl5–/– mice during M. tuberculosis infection (∼500 CFUs; n ≥ 36 [nWT day 28 p.i. = 35]). Data are pooled from 4 independent experiments. (E) Pulmonary M. tuberculosis burden in WT and Cxcl5–/– mice (∼500 CFUs; npooled = 9–10 per time point). Data are pooled from 5 independent experiments. (CE) Mean ± SEM, 2-way ANOVA/Bonferroni post-test. (F) Proinflammatory cytokine levels in lung homogenates of WT and Cxcl5–/– mice at day 30 p.i. (mean ± SEM; npooled = 10). Data are pooled from 2 independent experiments (unpaired t test). (G) Lung histopathology at 21 days p.i. as shown by hematoxylin and eosin staining. Scale bar: 1,000 μm (top row); 100 μm (bottom row). Data are representative of 3 independent experiments (n = 3–5). *P < 0.05; **P < 0.01; ****P < 0.0001.
Figure 4
Figure 4. M. tuberculosis–specific type 1 T cell response and pathway analysis in Cxcl5–/– mice.
(A) Frequencies of IFN-γ+TNF-α+ cells among lung CD4 and CD8 T cells and numbers of IFN-γ+TNF-α+ lung CD4 and CD8 T cells after short-term in vitro restimulation with M. tuberculosis–derived peptides determined by flow cytometry (mean ± SEM; npooled ≥ 14 per time point except on day 0, when n = 10). Mice were infected with high-dose (∼500 CFU) M. tuberculosis. Each time point represents pooled data from at least 2 independent experiments. Curve data pooled from a total of 4 independent experiments (2-way ANOVA/Bonferroni post-test) did not reveal significant differences between groups at analyzed time points. (B) Significant selected pathways by SPIA analysis. P values correspond to pGFWER composite and multiple testing–corrected P values from SPIA analysis. Plots show log2 fold changes in gene expression of given pathways between naive and day 21 p.i. WT lungs (horizontal axis) and Cxcl5–/– lungs (vertical axis). Mice were infected with high-dose (∼500 CFUs) M. tuberculosis. Red denotes genes for which log fold change is significantly higher in the KO, and blue denotes genes for which log fold change is significantly higher in the WT. (C) Selected GO terms significant in GO enrichment analysis. P values correspond to significance of GO enrichment, corrected for multiple testing. Colors and axes are as in B.
Figure 5
Figure 5. Reduced chemokine expression and BAL PMN recruitment in Cxcl5–/– mice.
(A and B) Chemokine measurements by (A) multiplex analysis and (B) ELISA in BAL fluid of naive and high-dose (∼500 CFUs) M. tuberculosis–infected WT and Cxcl5–/– mice (mean ± SEM; npooled = 10). Data are pooled from 2 independent experiments (2-way ANOVA/Bonferroni post-test). (C) Dot plots showing representative frequencies of BAL PMNs following high-dose M. tuberculosis infection. (D) Numbers and frequencies of BAL PMNs in naive and high-dose (∼500 CFUs) M. tuberculosis–infected WT control (WT and Cxcr2+/+), Cxcl5–/–, and Cxcr2–/– mice determined by flow cytometry (mean ± SEM). Data are pooled from 6 independent experiments (2-way ANOVA/Bonferroni post-test). *P < 0.05; **P < 0.01; ***P < 0.001; ****P < 0.0001.
Figure 6
Figure 6. CXCL5 release by M. tuberculosis–infected epithelial cells.
CXCL5, CXCL1, and CXCL2 levels measured by ELISA in supernatants of M. tuberculosis–infected (A) BMDMs, (B) PMNs isolated from BM (BM-PMNs), and (C) T7 cells, an AECII cell line (mean ± SEM; n = 3). Data are representative of 3 independent experiments with 3 replicates each. nd, not detected.
Figure 7
Figure 7. In situ expression of CXCL5 by lung epithelial cells during TB.
Nuclear β-galactosidase (AF488, green) staining with specific antiserum reveals Cxcl5 induction in lung tissue at 21 days p.i. (∼500 CFUs). (AD) β-Galactosidase+ nuclei in bronchial epithelial cells (arrows), (EH) granulomatous infiltrates (arrows), and (IL) alveolar epithelial cells (arrows) from Cxcl5–/– mice. (MP) Absence of β-galactosidase+ nuclei in WT epithelia and (QT) granular staining pattern with cytosolic location in WT control mice. Tissue was counterstained with wheat germ agglutinin labeled with Texas Red (WGA-TR; red) and draq5 (blue). Scale bar: 50 μm (AH and MT); 20 μm (IL). Representative confocal images are from 1 experiment (n = 3).
Figure 8
Figure 8. Radioresistant cells are responsible for defective PMN recruitment in Cxcl5–/– mice.
Chimeric mice were generated as follows: (a) WT BM in WT recipients (WT→WT); (b) Cxcl5–/– BM in WT recipients (KO→WT); (c) Cxcl5–/– BM in Cxcl5–/– recipients (KO→KO); and (d) WT BM in Cxcl5–/– recipients (WT→KO). Mice were infected with high-dose (∼400 CFUs) M. tuberculosis. (A) Relative Cxcl5 mRNA levels in lungs of M. tuberculosis–infected chimeric mice measured by quantitative RT-PCR of Cxcl5 and Gapdh mRNA expression with the formula 1.8(ct Gapdh - ct Cxcl5) × 100. nd, Cxcl5 mRNA not detected, Ct >40. (B) CXCL5 in sera of M. tuberculosis–infected chimeric mice as measured by ELISA. (C) Frequencies and numbers of lung PMNs in M. tuberculosis–infected chimeric mice as measured by flow cytometry. Data are representative of 2 independent experiments (mean ± SEM; n = 5; 2-way ANOVA/Bonferroni post-test). *P < 0.05; **P < 0.01; ***P < 0.001; ****P < 0.0001.
Figure 9
Figure 9. CXCL5 expression in epithelial cells is induced by M. tuberculosis TLR2 agonists.
(A) CXCL5 abundance measured by ELISA in supernatants of the AECII cell line (T7) stimulated with M. tuberculosis components and TLR agonists: γ-irradiated M. tuberculosis (Irr Mtb; MOI 10 and 100), 10 μg/ml cell wall (CW), 10 μg/ml membrane (MEM), 10 μg/ml cytosolic fraction (CytF), 10 μg/ml total lipids (TLIPs), 5 μg/ml muramyl dipeptide (MDP), 5 μg/ml mycolylarabinogalactan-peptidoglycan (mAGP), 5 μg/ml trehalose-6,6′-dimycolate (TDM), 5 μg/ml peptidoglycan (PG), 5 μg/ml mannose-capped lipoarabinomannan (ManLAM), 5 μg/ml phosphatidyl-myo-inositol mannosides 1 and 2 (PIMs), 5 μg/ml lipoarabinomannan (LAM), 1 μg/ml lipomannan (LM), 1 μg/ml 19-kDa lipopeptide (19kDa LP), 1 μg/ml 27-kDa lipopeptide (27kDa LP), 1 μg/ml MPT83 lipopeptide (MPT83 LP), 10 μg/ml zymosan (Zyn), 1 μM CpG, 1 μg/ml PAM3CSK4, 1 μg/ml LPS (1-way ANOVA/Bonferroni post-test). (B and C) CXCL5 concentration measured by ELISA in supernatants of AECII (T7) treated with and without anti-TLR2 mAb and (B) stimulated for 24 hours with γ-irradiated M. tuberculosis, 19-kDa and 27-kDa lipopeptides, MPT83, PAM3SCK4, or LPS and (C) infected with M. tuberculosis (Mtb) (2-way ANOVA/Bonferroni post-test). (AC) Data are representative of 2 independent experiments (mean ± SEM; n = 3). (D) Chemokine measurements by ELISA and (E) PMN numbers and frequencies determined by flow cytometry in BAL fluid of high-dose (∼400 CFUs) M. tuberculosis–infected WT and Tlr2–/– mice (mean ± SEM; npooled = 10). Data are pooled from 2 independent experiments (2-way ANOVA/Bonferroni post-test). **P < 0.01; ***P < 0.001; ****P < 0.0001.

Similar articles

Cited by

References

    1. World Health Organization. Global Tuberculosis Report 2012. Geneva, Switzerland: World Health Organization; 2012.
    1. Gengenbacher M, Kaufmann SH. Mycobacterium tuberculosis: success through dormancy. FEMS Microbiol Rev. 2012;36(3):514–532. doi: 10.1111/j.1574-6976.2012.00331.x. - DOI - PMC - PubMed
    1. Cooper AM. T cells in mycobacterial infection and disease. Curr Opin Immunol. 2009;21(4):378–384. doi: 10.1016/j.coi.2009.06.004. - DOI - PMC - PubMed
    1. Kleinnijenhuis J, Oosting M, Joosten LA, Netea MG, Van Crevel R. Innate immune recognition of Mycobacterium tuberculosis. Clin Dev Immunol. 2011;2011:405310. - PMC - PubMed
    1. Thoma-Uszynski S, et al. Induction of direct antimicrobial activity through mammalian toll-like receptors. Science. 2001;291(5508):1544–1547. doi: 10.1126/science.291.5508.1544. - DOI - PubMed

Publication types

MeSH terms

Associated data