Comparative Study
. 2014 Jul;260(1):72-80.
doi: 10.1097/SLA.0000000000000424.

Comparison of cancer-associated genetic abnormalities in columnar-lined esophagus tissues with and without goblet cells

Affiliations
Comparative Study

Comparison of cancer-associated genetic abnormalities in columnar-lined esophagus tissues with and without goblet cells

Santhoshi Bandla et al. Ann Surg. 2014 Jul.

Abstract

Objective: To determine and compare the frequency of cancer-associated genetic abnormalities in esophageal metaplasia biopsies with and without goblet cells.

Background: Barrett's esophagus is associated with increased risk of esophageal adenocarcinoma (EAC), but the appropriate histologic definition of Barrett's esophagus is debated. Intestinal metaplasia (IM) is defined by the presence of goblet cells whereas nongoblet cell metaplasia (NGM) lacks goblet cells. Both have been implicated in EAC risk but this is controversial. Although IM is known to harbor genetic changes associated with EAC, little is known about NGM. We hypothesized that if NGM and IM infer similar EAC risk, then they would harbor similar genetic aberrations in genes associated with EAC.

Methods: Ninety frozen NGM, IM, and normal tissues from 45 subjects were studied. DNA copy number abnormalities were identified using microarrays and fluorescence in situ hybridization. Targeted sequencing of all exons from 20 EAC-associated genes was performed on metaplasia biopsies using Ion AmpliSeq DNA sequencing.

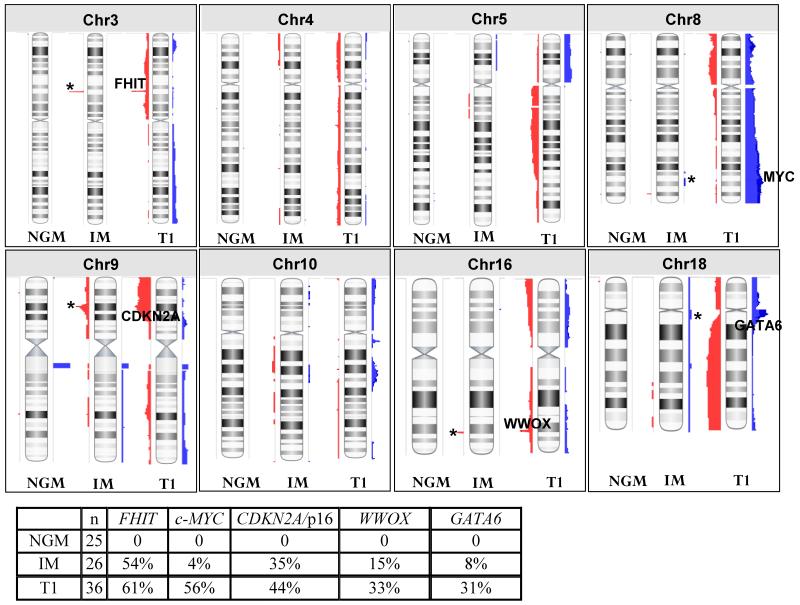
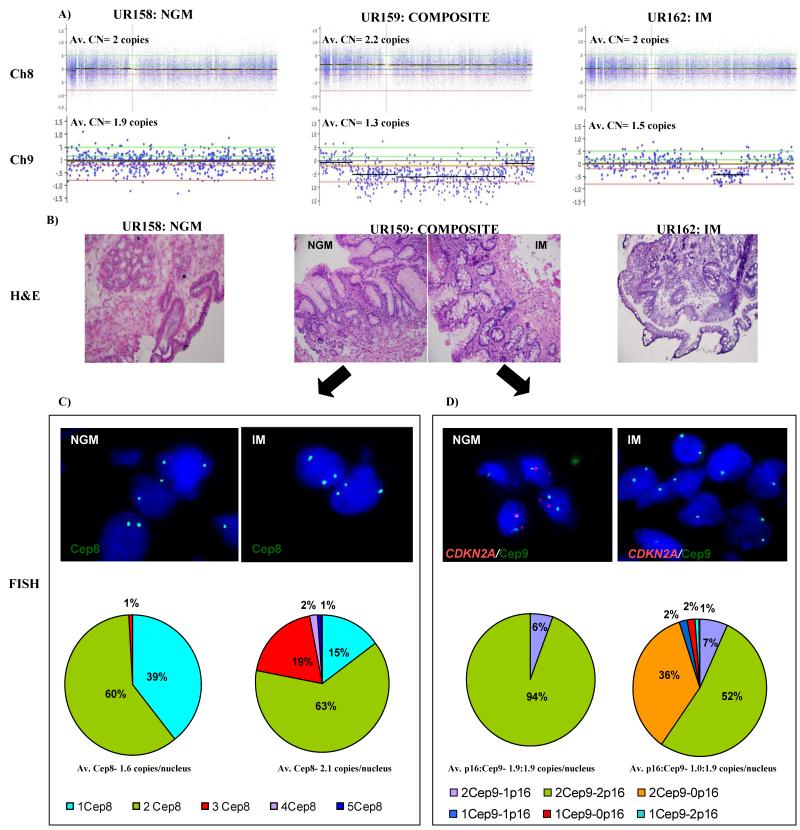
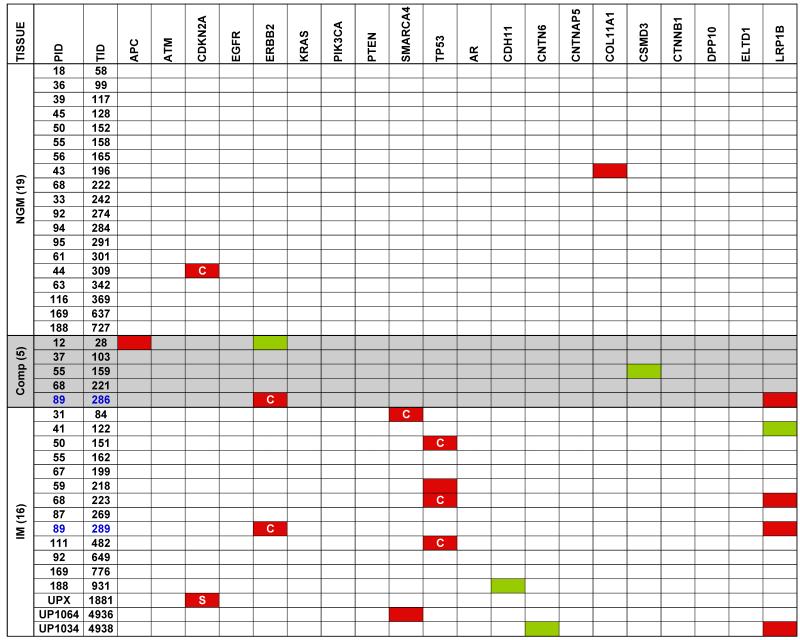
Results: Frequent copy number abnormalities targeting cancer-associated genes were found in IM whereas no such changes were observed in NGM. In 1 subject, fluorescence in situ hybridization confirmed loss of CDKN2A and amplification of chromosome 8 in IM but not in a nearby NGM biopsy. Targeted sequencing revealed 11 nonsynonymous mutations in 16 IM samples and 2 mutations in 19 NGM samples.

Conclusions: This study reports the largest and most comprehensive comparison of DNA aberrations in IM and NGM genomes. Our results show that IM has a much higher frequency of cancer-associated mutations than NGM.


Figures

Figure 1
Figure 1. Comparison of copy number alterations between 25 non-goblet metaplasia (NGM), 26 intestinal metaplasia (IM), and 36 T1 adenocarcinoma genomes
Copy number gains are represented in blue while losses are in red. Known cancer associated genes are indicated on the chromosomes for the T1 genomes and their alteration frequencies are indicated in the accompanying table. Presence of these changes in NGM and/or IM genomes is indicated by ‘*’. Complete genomes are provided in Supplemental Figure 2.
Figure 2
Figure 2. Validation of genomic changes using fluorescence in situ hybridization (FISH) in composite sample (UR159) from subject 55
(A) Probe level copy number data showing the gain of entire chromosome 8 in the composite specimen (UR159) and loss of CDK2NA loci in composite (UR159) and intestinal metaplasia (IM; UR162) specimens compared to the NGM specimen (UR158). Y-axis represents the log2 signal ratio where log20 = 2 copies (baseline). Average copy number per locus is indicated above each plot. The two green and red lines above and below the baseline respectively indicate the gain/high copy gain and loss/homozygous loss thresholds. (B) Representative H & E images for NGM (UR158), composite (UR159), and IM (UR162) taken at 20X magnification. (C) & (D) Representative fluorescence in situ hybridization (FISH) images of the NGM and IM portions of the composite tissue (UR159). Pie-charts summarize the result into different categories of normal (green) and abnormal signals (other colors as indicated) observed in each biopsy for gain of chromosome 8 (C) and loss of CDKN2A (D). Av.= average; CN= copy number; Cep8= centromere8; Cep9= centromere 9; p16= CDKN2A
Figure 3
Figure 3. Targeted re-sequencing of 20 frequently mutated EAC genes from pre-neoplastic biopsies
Nineteen NGM, 5 composites, and 16 IM specimens from 36 subjects were analyzed along with matched normal squamous mucosa. Mutations in the coding regions within the specific genes are indicated in red (non-synonymous mutation) and green (silent substitutions) while ‘C’ indicates the mutation is reported in the COSMIC database and ‘S’ indicates the point mutation was identified by Sanger sequencing.
Figure 4
Figure 4. Power of mutation load to discriminate between metaplasia and EAC
Pairwise Receiver-Operator Characteristics (ROC) curves analysis was performed for Tumor v IM and Tumor v any metaplasia (NGM/IM) using the 20-gene AmpliSeq mutation data from NGM and IM samples along with mutation data from 66 EAC tumor samples obtained from whole exome sequencing.

References

    1. Pohl H, Welch HG. The role of overdiagnosis and reclassification in the marked increase of esophageal adenocarcinoma incidence. J Natl Cancer Inst. 2005;97:142–6. - PubMed
    1. Brown LM, Devesa SS, Chow WH. Incidence of adenocarcinoma of the esophagus among white Americans by sex, stage, and age. J Natl Cancer Inst. 2008;100:1184–7. - PMC - PubMed
    1. Reid BJ, Li X, Galipeau PC, et al. Barrett’s oesophagus and oesophageal adenocarcinoma: time for a new synthesis. Nat Rev Cancer. 2010;10:87–101. - PMC - PubMed
    1. Ronkainen J, Aro P, Storskrubb T, et al. Prevalence of Barrett’s esophagus in the general population: an endoscopic study. Gastroenterology. 2005;129:1825–31. - PubMed
    1. Jankowski J, Barr H, Wang K, et al. Diagnosis and management of Barrett’s oesophagus. BMJ. 2010;341:c4551. - PMC - PubMed

Publication types

MeSH terms

Supplementary concepts