. 2014 Feb:34:33-45.
doi: 10.1016/j.matbio.2014.01.017. Epub 2014 Feb 6.

Opposing effects of collagen I and vitronectin on fibronectin fibril structure and function

Affiliations

Opposing effects of collagen I and vitronectin on fibronectin fibril structure and function

Candace D Gildner et al. Matrix Biol. 2014 Feb.

Abstract

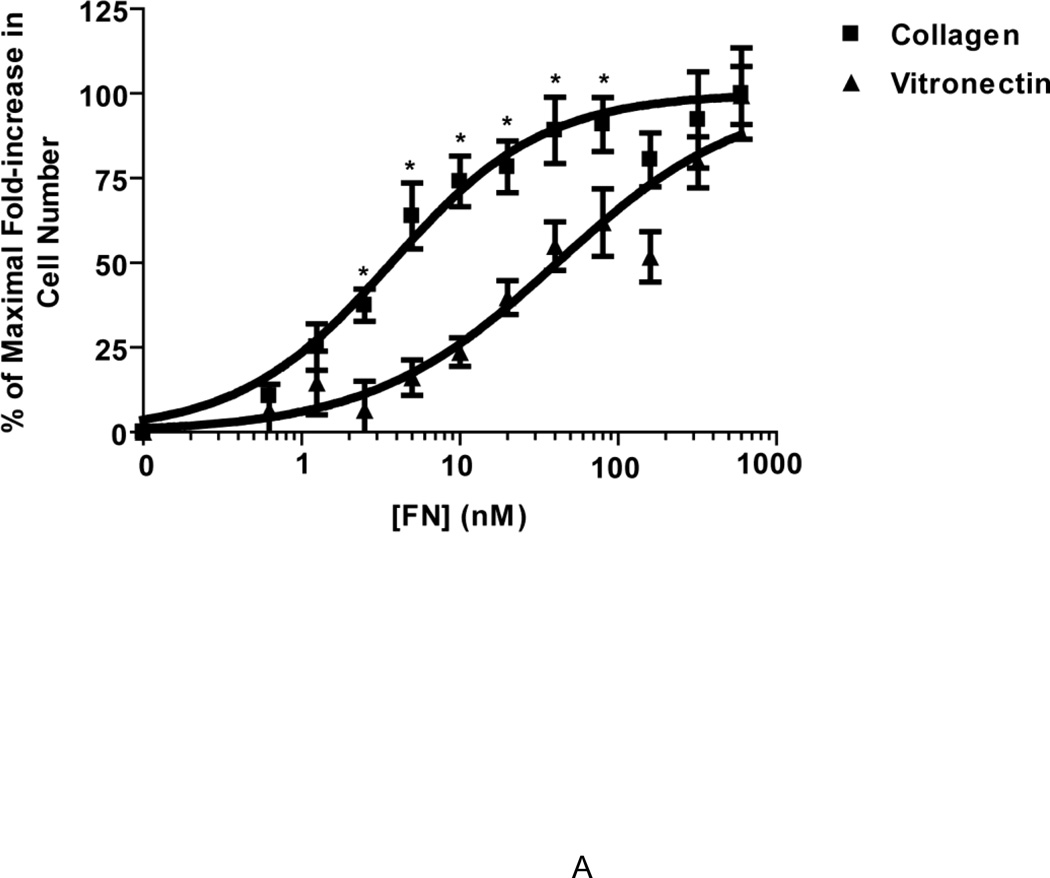
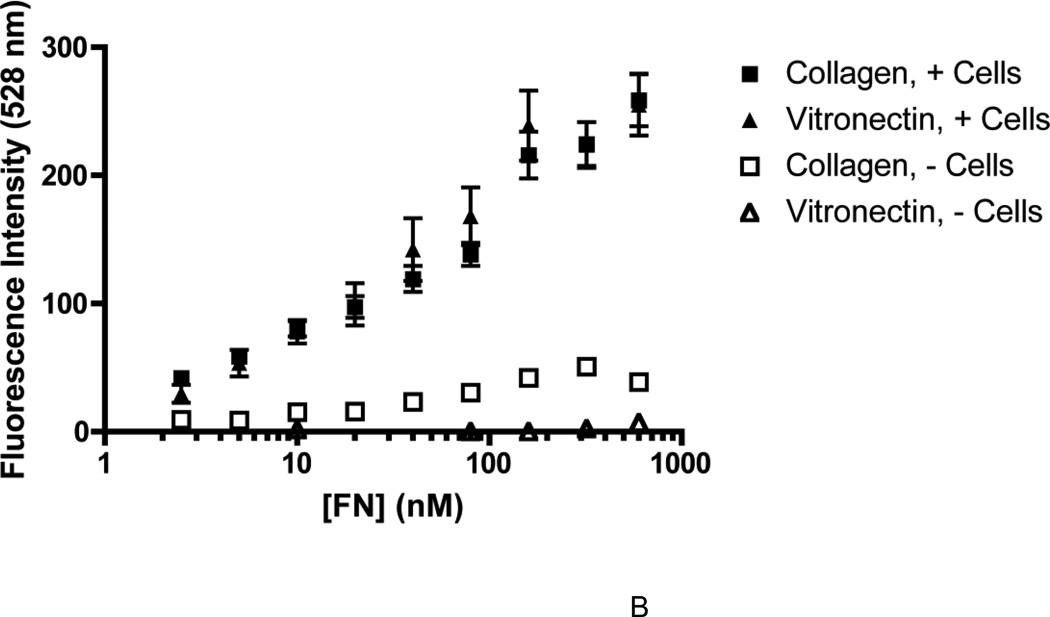
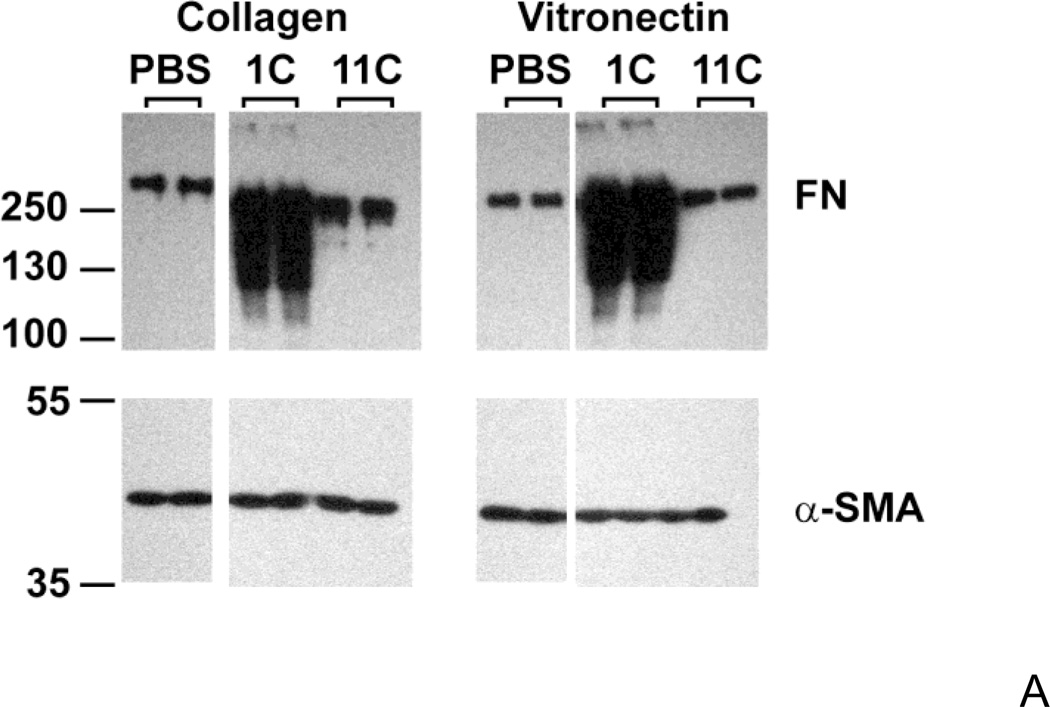
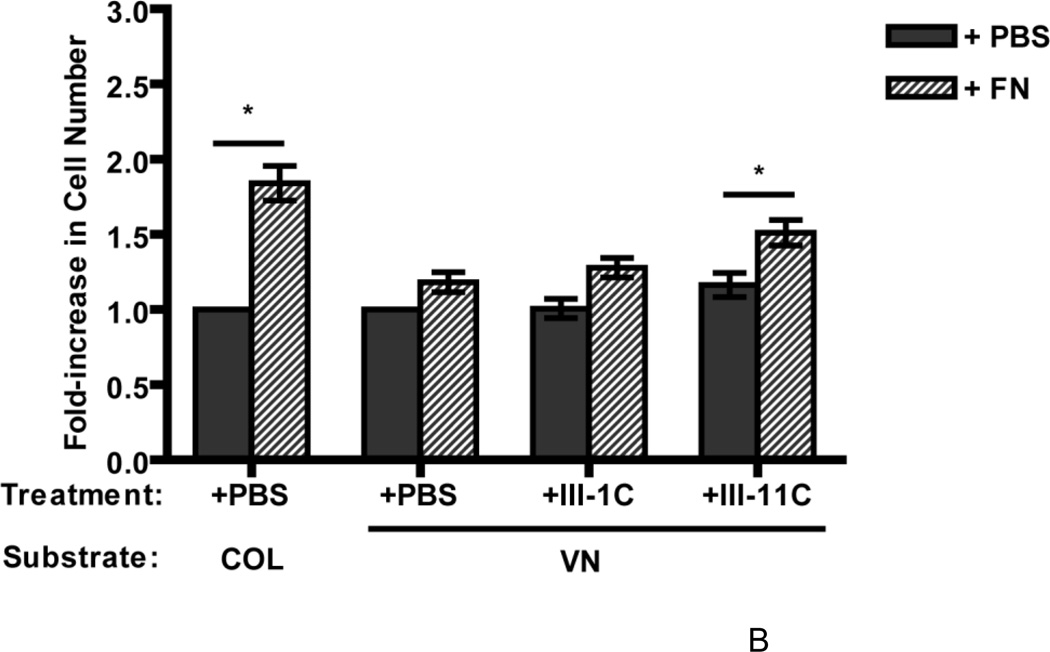
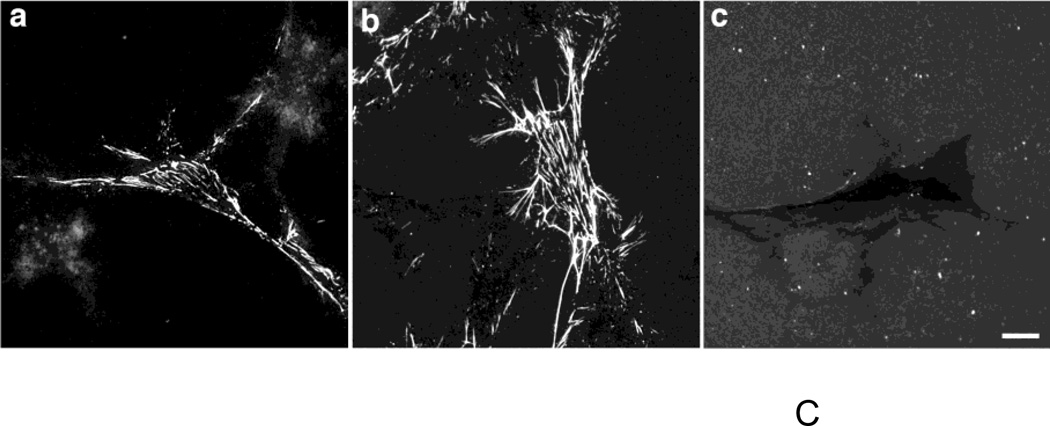
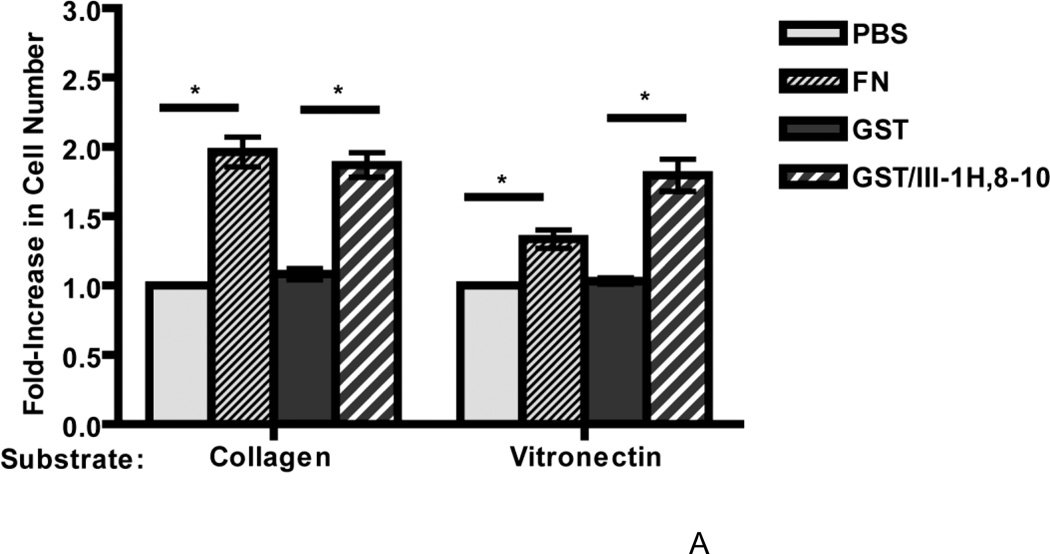
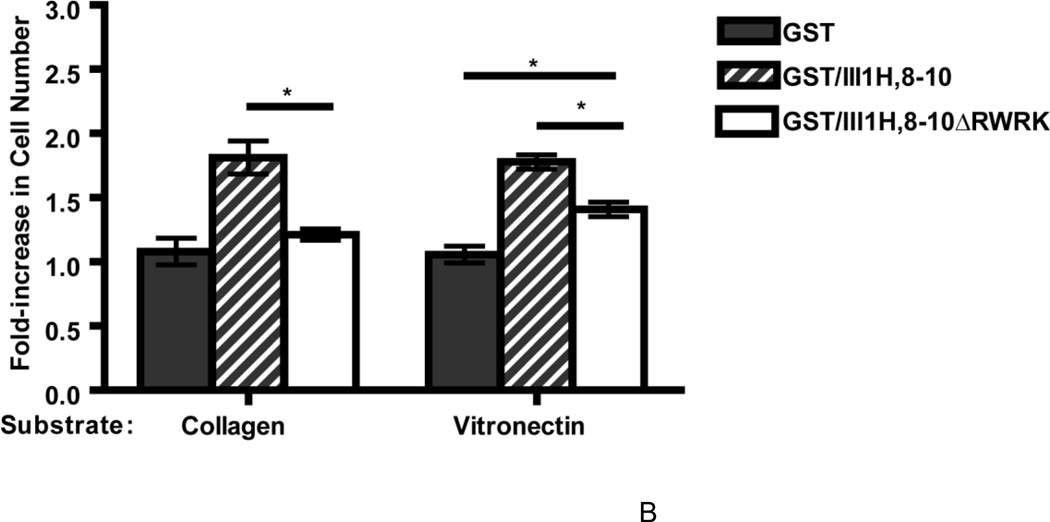
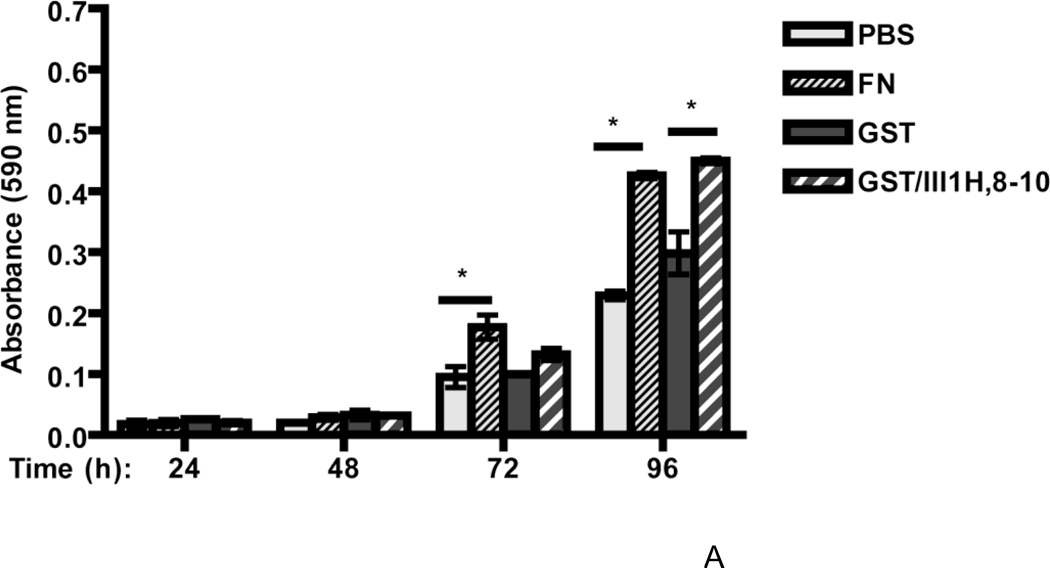
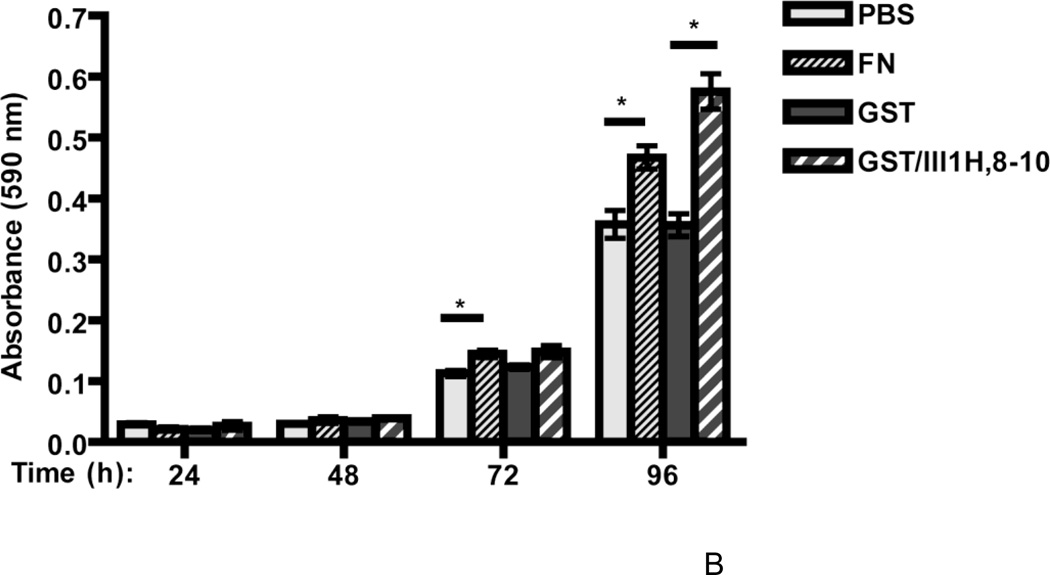
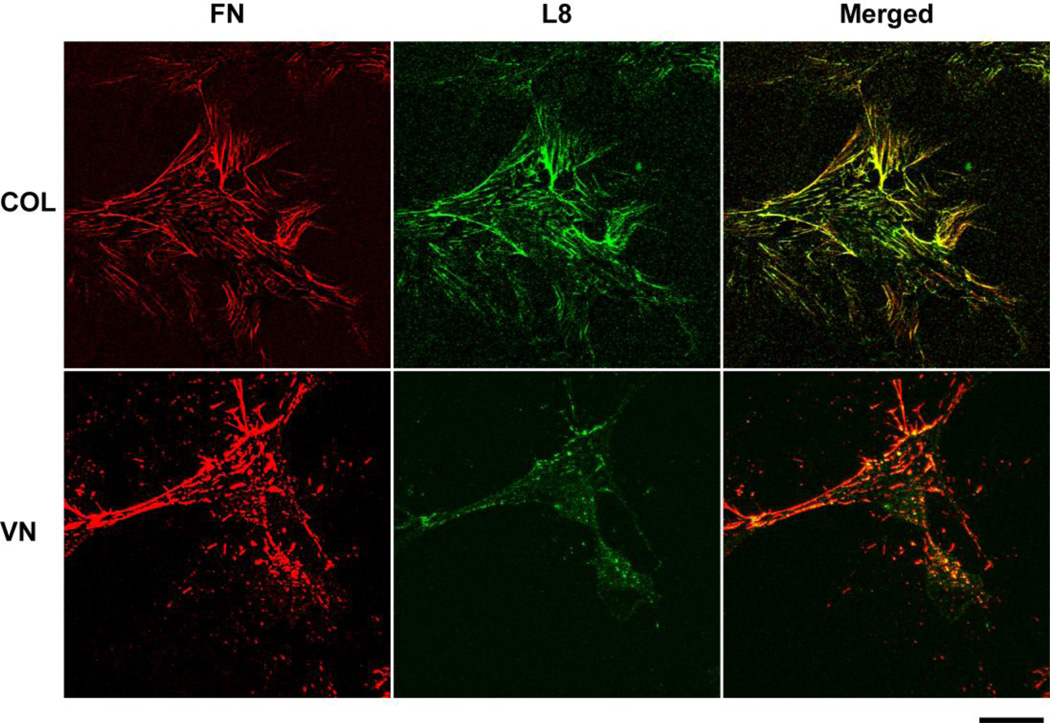
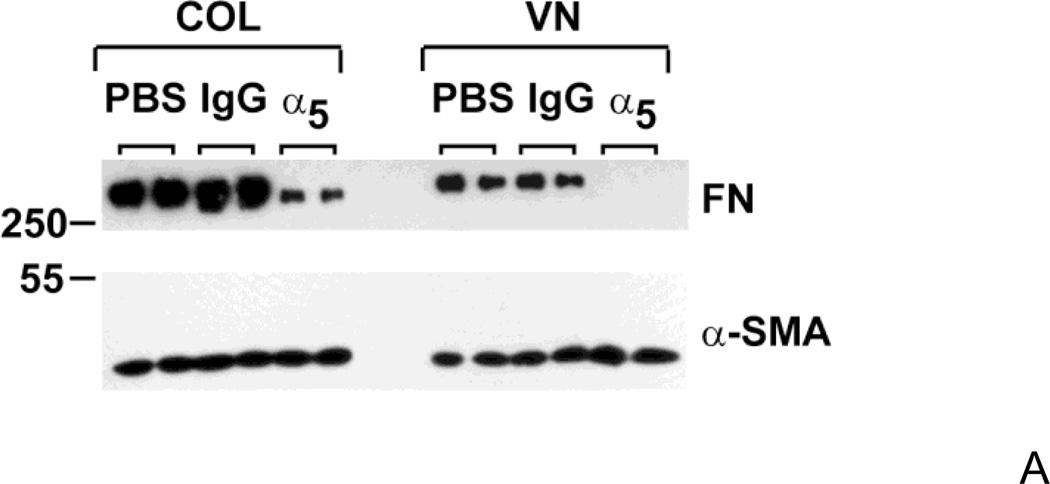
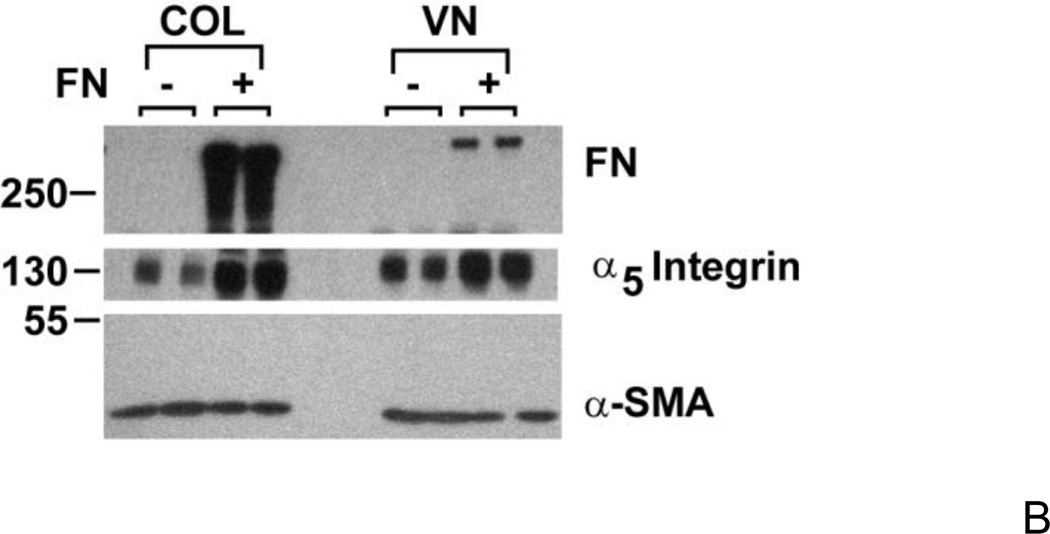
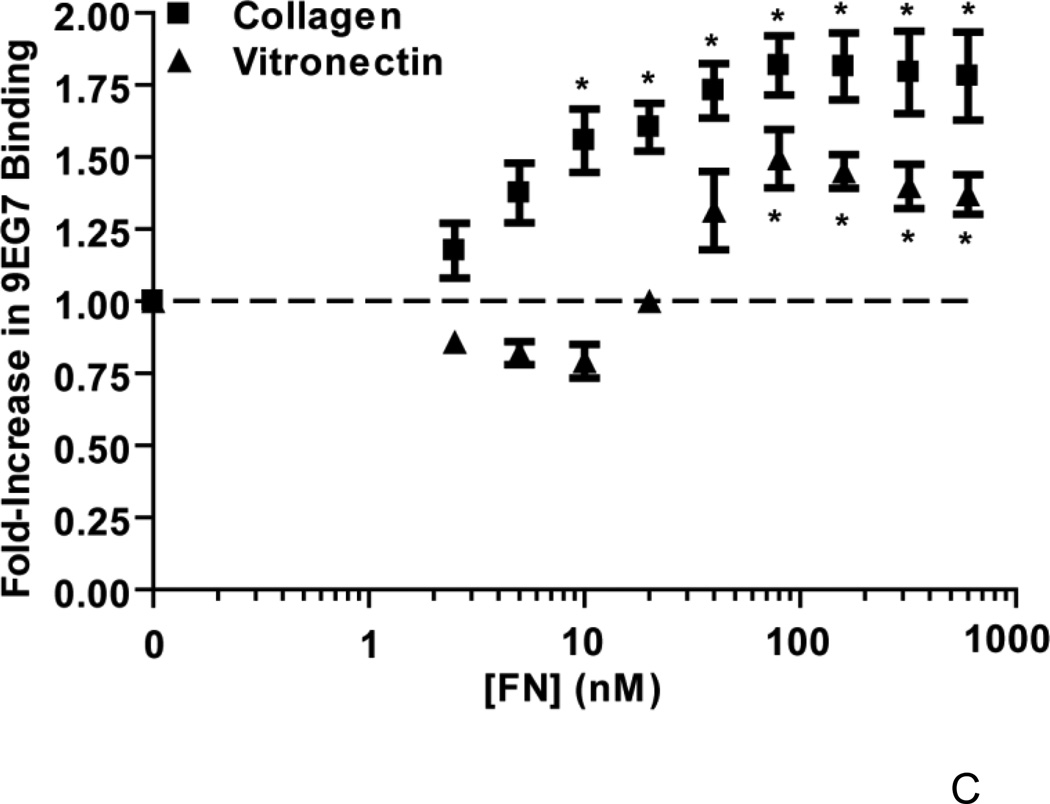
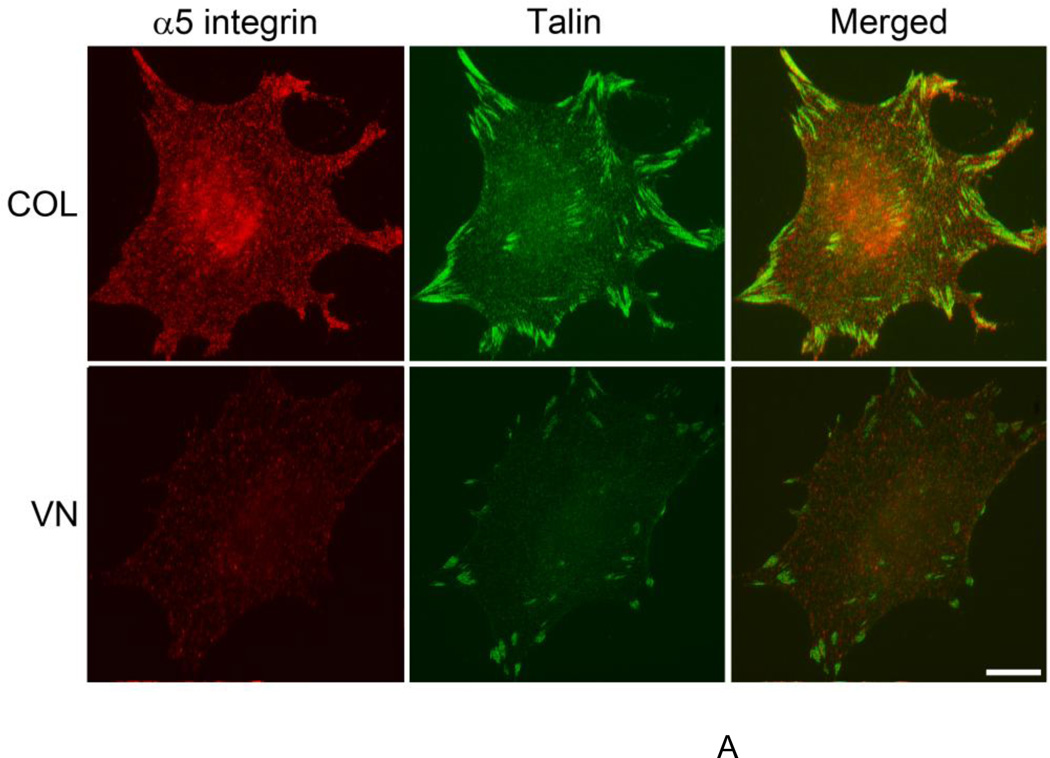
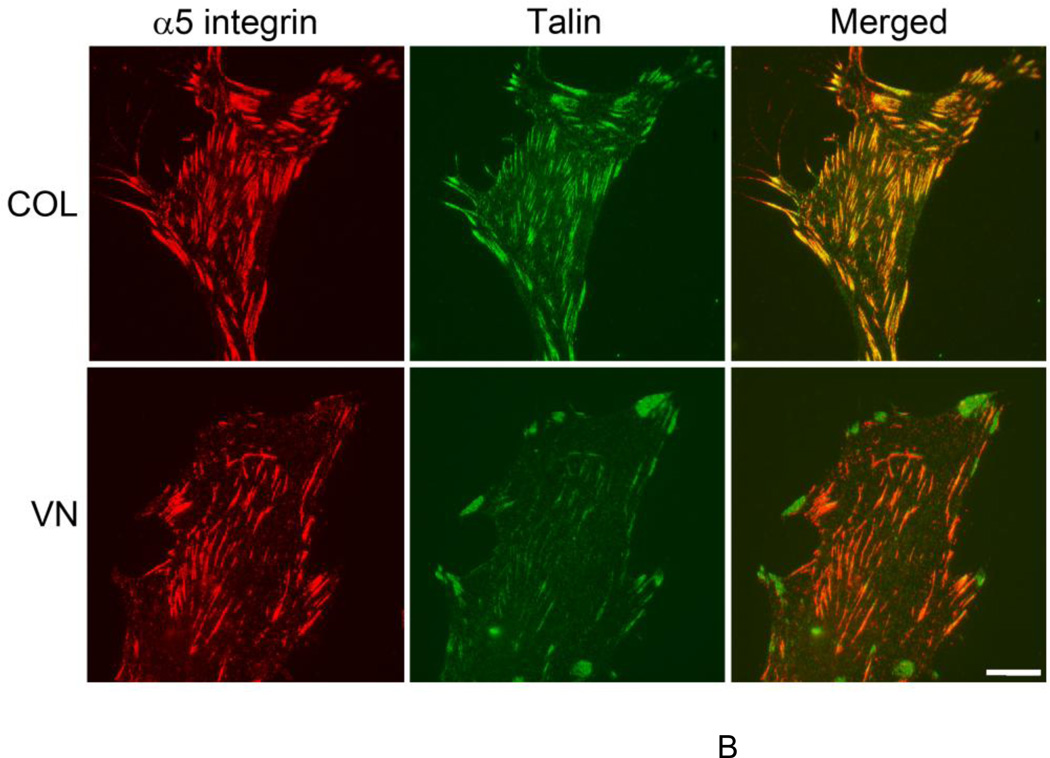
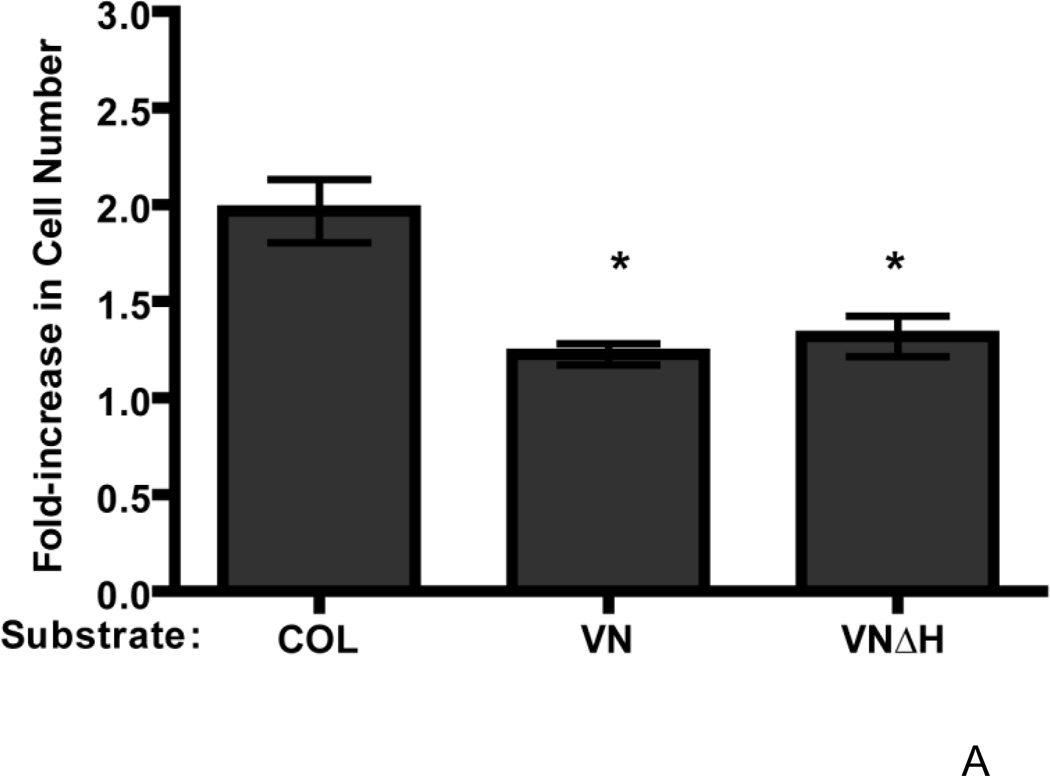
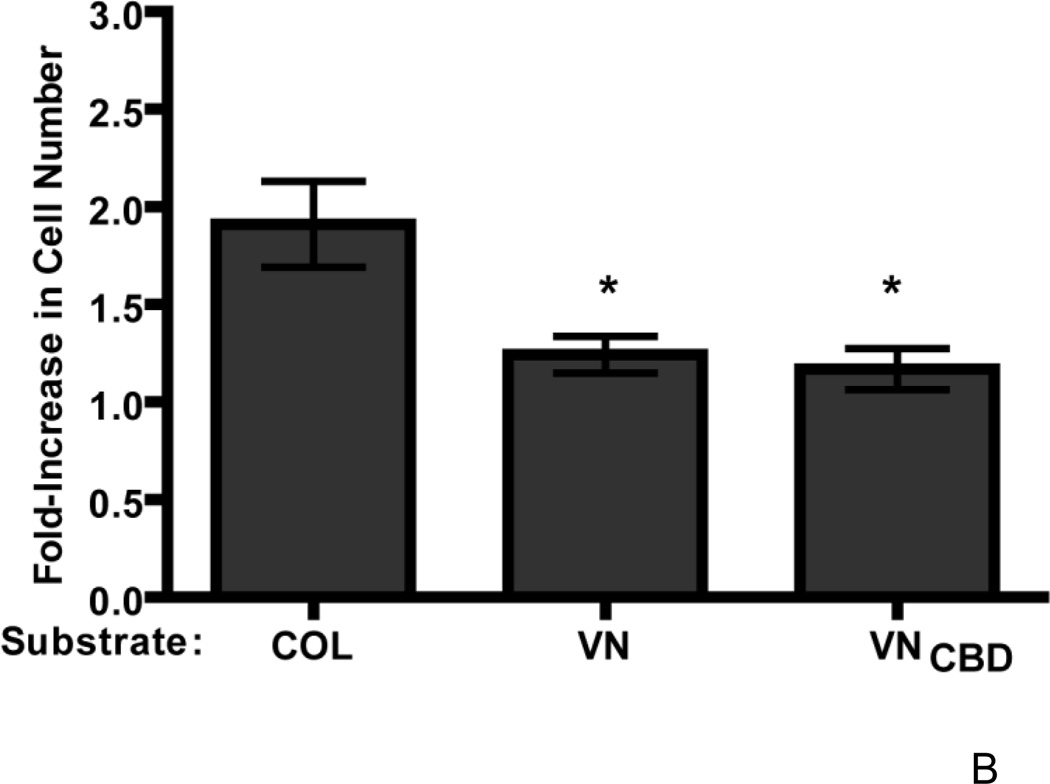
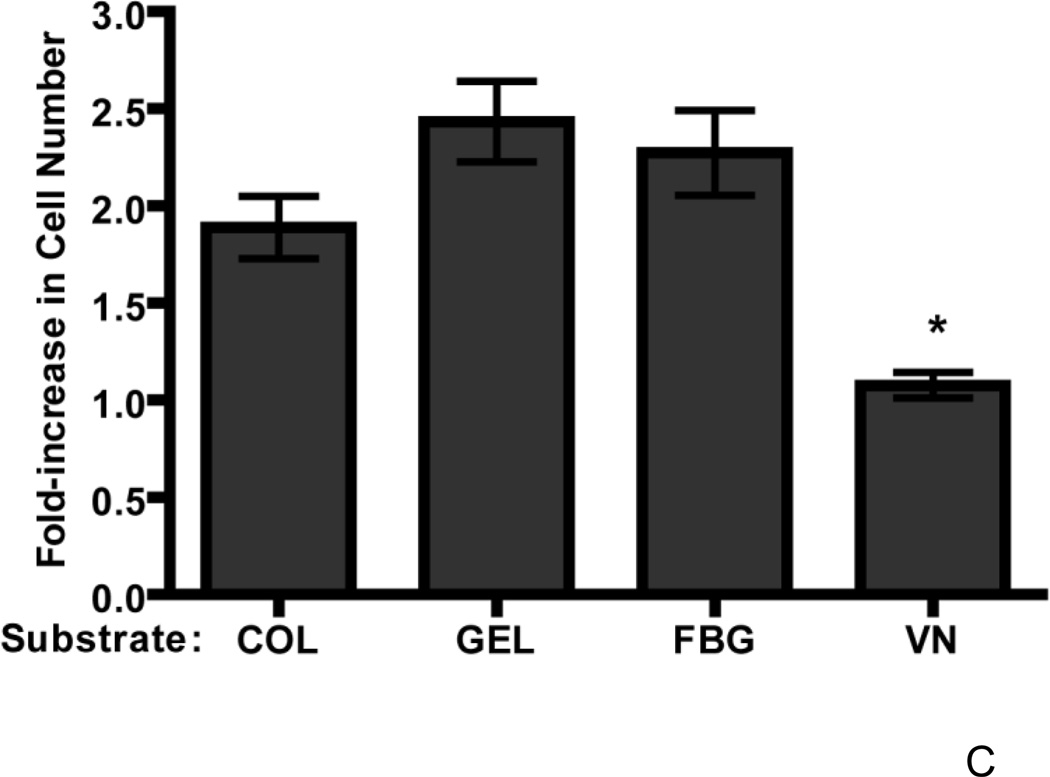
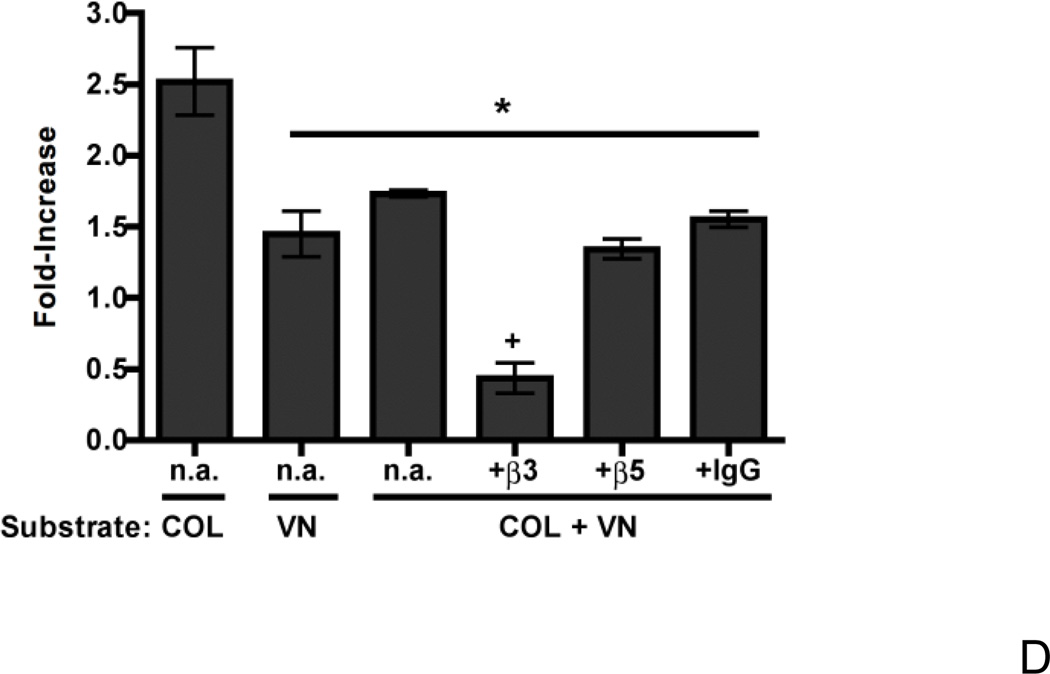
Extracellular matrix fibronectin fibrils serve as passive structural supports for the organization of cells into tissues, yet can also actively stimulate a variety of cell and tissue functions, including cell proliferation. Factors that control and coordinate the functional activities of fibronectin fibrils are not known. Here, we compared effects of cell adhesion to vitronectin versus type I collagen on the assembly of and response to, extracellular matrix fibronectin fibrils. The amount of insoluble fibronectin matrix fibrils assembled by fibronectin-null mouse embryonic fibroblasts adherent to collagen- or vitronectin-coated substrates was not significantly different 20 h after fibronectin addition. However, the fibronectin matrix produced by vitronectin-adherent cells was ~10-fold less effective at enhancing cell proliferation than that of collagen-adherent cells. Increasing insoluble fibronectin levels with the fibronectin fragment, anastellin did not increase cell proliferation. Rather, native fibronectin fibrils polymerized by collagen- and vitronectin-adherent cells exhibited conformational differences in the growth-promoting, III-1 region of fibronectin, with collagen-adherent cells producing fibronectin fibrils in a more extended conformation. Fibronectin matrix assembly on either substrate was mediated by α5β1 integrins. However, on vitronectin-adherent cells, α5β1 integrins functioned in a lower activation state, characterized by reduced 9EG7 binding and decreased talin association. The inhibitory effect of vitronectin on fibronectin-mediated cell proliferation was localized to the cell-binding domain, but was not a general property of αvβ3 integrin-binding substrates. These data suggest that adhesion to vitronectin allows for the uncoupling of fibronectin fibril formation from downstream signaling events by reducing α5β1 integrin activation and fibronectin fibril extension.

Keywords: Cell proliferation; Collagen; Extracellular matrix; Fibronectin; Integrin; Vitronectin.


Figures

Figure 1
Figure 1. Cell adhesion to vitronectin reduces the proliferative response to fibronectin
FN-null MEFs were seeded (A, 2.6 × 10³ cells/cm2; B, 3 × 10⁴ cells/cm2) onto collagen- or vitronectin-coated wells and allowed to adhere for 4 h. (A) Fibronectin (0.625 – 600 nM) or an equal volume of the vehicle control, PBS (‘0’ FN), was added to wells. Cell number was determined 4 days after seeding. Data are presented as a percentage of the maximal-fold increase in cell number relative to PBS-treated controls. Graph Pad Prism was used to fit a sigmoidal curve to the data. *Significantly different from vitronectin-adherent cells at the given fibronectin concentration by Student’s t-test, n > 3 for all time points. The average absorbance values for control (PBS)-treated groups were 0.28 ± 0.02 (collagen) and 0.34 ± 0.02 (vitronectin). (B) Alexa488-labeled fibronectin (FN488, 2.50 – 600 nM) was added to wells and cells were incubated for an additional 20 h. FN488 accumulation was determined as described in “Experimental Methods”. Data are presented as mean fluorescence ± SEM and are compiled from 3 separate experiments performed in triplicate.
Figure 2
Figure 2. Time course of fibronectin matrix assembly
FN-null MEFs (3 × 10³ cells/cm2) were seeded onto substrates precoated with either collagen or vitronectin, allowed to adhere for 4 h, and then treated with fibronectin (20 nM). (A) At 1, 4, 24, and (C) 96 h after fibronectin addition, cells were processed for immunofluorescence microscopy. Fibronectin was detected using a polyclonal anti-fibronectin antibody. Bar = 10 µm. Image shown represents of 1 of 3 independent experiments performed. (B) At indicated times, DOC-extractions were performed. Aliquots of the DOC-insoluble fractions were analyzed by immunoblotting and quantified by densitometry. The ratio of the average net intensity of fibronectin bands for vitronectin-adherent cells to the average net intensity of fibronectin bands for collagen-adherent cells was determined for each time point. Data are presented as the average ratio of 3 experiments performed in duplicate. *Significantly different from collagen-adherent cells at given time point by paired Student’s t-test.
Figure 3
Figure 3. Increasing fibronectin matrix deposition alone does not increase cell growth
FN-null MEFs (A and C, 3 × 10⁴ cells/cm2; B, 2.6 × 10³ cells/cm2) were allowed to adhere to either collagen- or vitronectin-coated substrates for 4 h. (A, B) Cells were then incubated with fibronectin (20 nM) in the absence or presence of 6 µM III1C or III11C, or an equal volume of PBS. (A) DOC-extractions were performed 20 h after fibronectin addition and equal volumes of DOC-insoluble material were analyzed by immunoblotting using anti-fibronectin (FN) polyclonal and anti-αSMA monoclonal antibodies. Molecular mass markers are shown at left. (B) Cell number was determined 96 h after seeding. Data are presented as a fold-increase in cell number relative to the PBS control group for each substrate. *Significantly different from corresponding ‘PBS’ group by one-way ANOVA, n = 3. (C) Vitronectin-adherent cells were incubated with 20 nM FN (a), 300 nM FN (b), or 20 nM FN + 6 µM III1C (c) for 4 h. Cells were processed for immunofluorescence microscopy and fibronectin was detected using a polyclonal anti-fibronectin antibody. Bar = 10 µm. Image shown represents of 1 of 2 independent experiments performed in duplicate.
Figure 4
Figure 4. Collagen- and vitronectin-adherent cells respond similarly to a fibronectin matrix analog
FN-null MEFs (2.6 × 10³ cells/cm2) were seeded onto collagen- or vitronectin-coated substrates and allowed to adhere for 4 h. Cells were then incubated with fibronectin (20 nM; FN) or an equal volume of PBS, or with GST, GST/III1H,8-10, or GST/III1H,8-10ΔRWRK (250 nM). Cell number was determined 96 h after seeding. Data are presented as average fold-increase in cell number versus PBS-treated cells for each substrate ± SEM. The average absorbance values for PBS-treated groups were 0.23 ± 0.02 (collagen) and 0.33 ± 0.02 (vitronectin). *Significantly different, by one-way ANOVA, n = 14 (A) and n = 3 (B).
Figure 5
Figure 5. Time course of cell growth for collagen- and vitronectin-adherent cells
FN-null MEFs (2.6 × 10³ cells/cm2) were seeded onto wells precoated with either collagen (A) or vitronectin (B). After 4 h, cells were treated with fibronectin (FN; 20 nM), GST (250 nM), GST/III1H,8-10 (250 nM) or an equal volume of PBS. Cell number was determined at various times after seeding. Data are presented as average absorbance ± SEM and represent 1 of 3 experiments performed in quadruplicate. *Significantly different from corresponding control at given time point, by one-way ANOVA.
Figure 6
Figure 6. Substrate-dependent differences in fibronectin fibril conformation
FN-null MEFs (3 × 10³ cells/cm2) were seeded onto substrates precoated with collagen (COL) or vitronectin (VN) and allowed to adhere for 4 h. Cells were incubated with fibronectin (20 nM) for an additional 4 h and then fixed, stained with conformation-dependent anti-fibronectin monoclonal antibodies L8, and co-stained with polyclonal anti-fibronectin antibodies (FN). Images are the compiled z-stacks from two-photon microscopy and represent 1 of 3 experiments performed in duplicate. Bar = 20 µm.
Figure 7
Figure 7. Role of α5β1 integrins in fibronectin matrix assembly
FN-null MEFs were seeded onto substrates precoated with collagen or vitronectin and allowed to adhere for 4 h. (A) Cells (3 × 10⁴ cells/cm2) were treated with fibronectin in the presence of anti-α5 integrin monoclonal antibodies (α5) or non-immune mouse IgG (IgG; 10 µg/mL), or an equal volume of PBS. After a 20 h incubation, DOC extractions were performed. In (B), collagen- or vitronectin-adherent cells (3 × 10⁴ cells/cm2) were treated with 20 nM fibronectin (FN; +) or an equal volume of PBS (−). After 2 h, DOC-extractions were performed. Equal volumes of DOC-insoluble material were analyzed by immunoblotting using anti-fibronectin polyclonal (A,B), anti-α5 integrin polyclonal (B) and anti-αSMA monoclonal (A,B) antibodies. Immunoblots shown represent 1 of 3 experiments performed in duplicate. (C) Cells (1.4 × 10⁵ cells/cm2) were incubated for 20 h with increasing concentrations of fibronectin (FN; 0 – 600 nM) or an equal volume of PBS (‘0 nM FN’). Cell ELISAs were performed as described in “Experimental Procedures”. Data are presented as average fold-increase in absorbance relative to the absorbance of PBS-treated cells (‘0 nM FN’) for each substrate ± SEM *Significantly different from PBS-treated cells by one-way ANOVA, n = 4.
Figure 8
Figure 8. Reduced talin translocation into fibrillar adhesions of vitronectin-adherent cells
FN-null MEFs were seeded (3 × 10⁴ cells/cm2) on tissue culture plates precoated with collagen (COL) or vitronectin (VN). Four hours after seeding, cells were either (A) fixed for immunofluorescence microscopy or (B) treated with soluble fibronectin (20 nM) and incubated an additional 4 h. Cells were processed for immunofluorescence microscopy and stained using antibodies directed against α5 integrin subunits and talin. Images represent 1 of 3 experiments. Bar = 10 µm.
Figure 9
Figure 9. The reduced cell growth response to fibronectin is mediated by vitronectin’s cell-binding domain
FN-null MEFs (2.6 × 10³ cells/cm2) were seeded onto wells precoated with collagen (COL), vitronectin (VN), a full-length vitronectin construct lacking the heparin-binding domain (VNΔH), a cell-binding fragment of vitronectin (VNCBD), gelatin (GEL), fibrinogen (FBG), or both vitronectin and collagen (COL+VN). After 4 h, cells were treated with fibronectin (20 nM) or an equal volume of PBS. Cell number was determined 96 h after seeding. Data are presented as average fold-increase in cell number over control (PBS-treated) wells for each substrate ± SEM. Average absorbance values ± SEM for control (PBS) wells on day 4: (A–C) COL (0.33 ± 0.04), VN (0.47 ± 0.05), VNΔH (0.40 +0.07), VNCBD (0.27 + 0.02), gelatin (0.35 ± 0.02), and fibrinogen (0.25 ± 0.03); (D) COL (0.25 ± 0.04), VN (0.27 ± 0.07), and COL+VN (0.39 ± 0.0.07). *Significantly different versus collagen-adherent cells; #Significantly different from all other treatment groups by one-way ANOVA, n = 7 (A), n = 5 (B), n = 3 (C and D).

Similar articles

Cited by

References

    1. Adair BD, Xiong JP, Maddock C, Goodman SL, Arnaout MA, Yeager M. Three-dimensional EM structure of the ectodomain of integrin {alpha}V{beta}3 in a complex with fibronectin. J Cell Biol. 2005;168:1109–1118. - PMC - PubMed
    1. Askari JA, Buckley PA, Mould AP, Humphries MJ. Linking integrin conformation to function. J Cell Sci. 2009;122:165–170. - PMC - PubMed
    1. Askari JA, Tynan CJ, Webb SE, Martin-Fernandez ML, Ballestrem C, Humphries MJ. Focal adhesions are sites of integrin extension. J Cell Biol. 2010;188:891–903. - PMC - PubMed
    1. Bae E, Sakai T, Mosher DF. Assembly of exogenous fibronectin by fibronectin-null cells is dependent on the adhesive substrate. J Biol Chem. 2004;279:35749–35759. - PubMed
    1. Baneyx G, Baugh L, Vogel V. Coexisting conformations of fibronectin in cell culture imaged using fluorescence resonance energy transfer. Proc Natl Acad Sci U S A. 2001;98:14464–14468. - PMC - PubMed

Publication types

LinkOut - more resources