. 2014 Mar;46(3):305-309.
doi: 10.1038/ng.2895. Epub 2014 Feb 9.

Dense genomic sampling identifies highways of pneumococcal recombination

Affiliations

Dense genomic sampling identifies highways of pneumococcal recombination

Claire Chewapreecha et al. Nat Genet. 2014 Mar.

Abstract

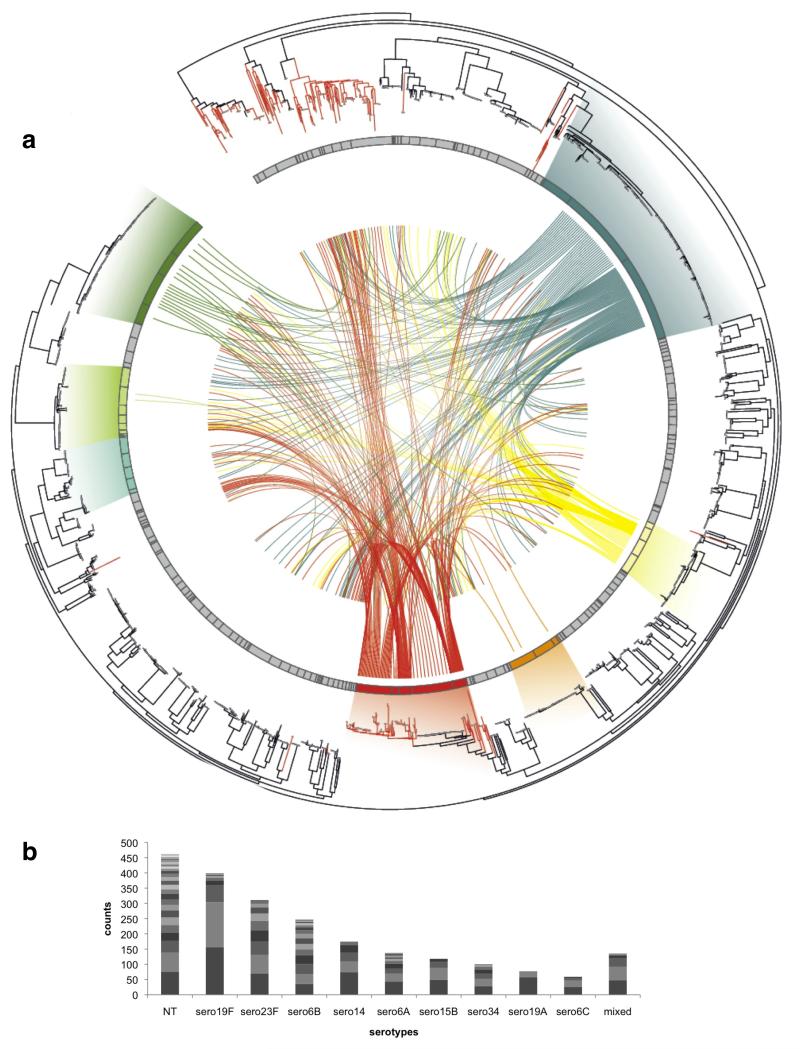
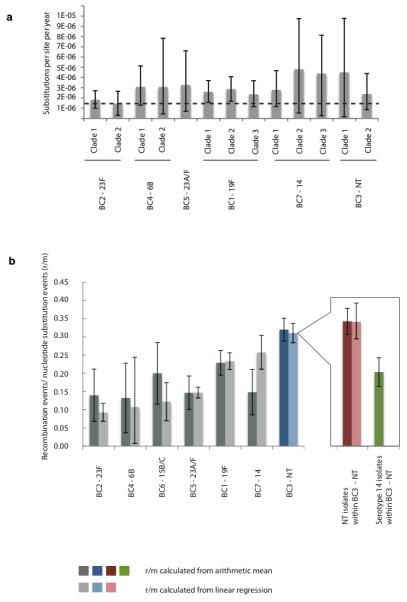
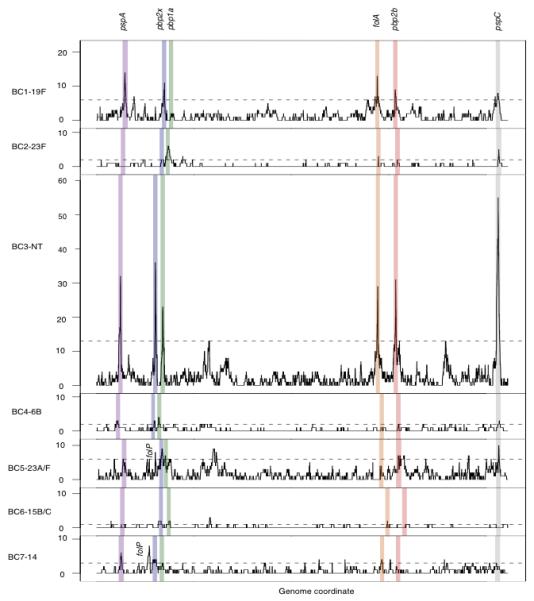
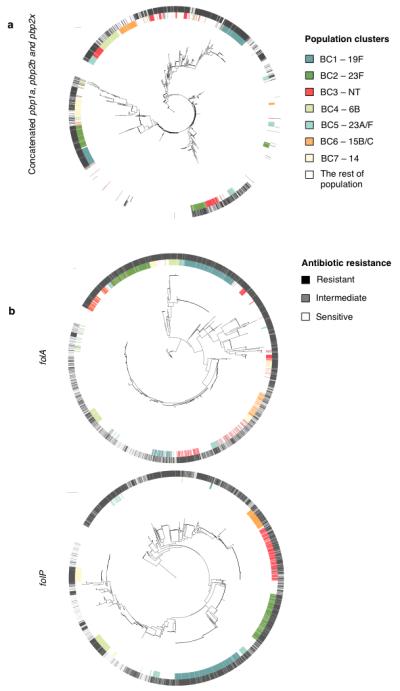
Evasion of clinical interventions by Streptococcus pneumoniae occurs through selection of non-susceptible genomic variants. We report whole-genome sequencing of 3,085 pneumococcal carriage isolates from a 2.4-km(2) refugee camp. This sequencing provides unprecedented resolution of the process of recombination and its impact on population evolution. Genomic recombination hotspots show remarkable consistency between lineages, indicating common selective pressures acting at certain loci, particularly those associated with antibiotic resistance. Temporal changes in antibiotic consumption are reflected in changes in recombination trends, demonstrating rapid spread of resistance when selective pressure is high. The highest frequencies of receipt and donation of recombined DNA fragments were observed in non-encapsulated lineages, implying that this largely overlooked pneumococcal group, which is beyond the reach of current vaccines, may have a major role in genetic exchange and the adaptation of the species as a whole. These findings advance understanding of pneumococcal population dynamics and provide information for the design of future intervention strategies.


Figures

Figure 1
Figure 1. Population structure and genetic interactions
(a) A single nucleotide polymorphism (SNP) based phylogeny of pneumococcal population with connections between recipients and potential donors of recombination fragments. From the outer ring: a neighbor-joining tree built using SNPs from the whole population. Branches colored in red are isolates classified as non-typeable. The next ring represents the population clusters based on secondary BAPS clustering. The seven most prevalent clusters are highlighted in different colors (in clock-wise order) - BC1-19F (deep blue), BC7-14 (yellow), BC6-15B/C (orange), BC3-NT (red), BC5-23A/F (blue-green), BC4-6B (pale green), and BC2-23F (green) with gradients linking these clusters to matched isolates on the phylogenetic tree. The centre shows connections between recombination recipients (from BC1-7 only; lines ending nearer the outside of the figure) and their potential donor clusters (lines ending nearer the centre). (b) Highly prevalent serotypes and their constituent population clusters by BAPS. The plot represents the ten most prevalent serotypes detected in the Maela population, each divided into separate population clusters based on secondary BAPS clustering – serotype (no. of clusters): non-typeable (NT) (30), 19F (9), 23F (11), 6B (18), 14 (6), 6A (14), 15B (4), 34 (7), 19A (3), 6C (4). Each cluster was shaded with different grey scales to represent each genetic background with the NT showing highest diversity.
Figure 2
Figure 2. Evolutionary parameters estimated in dominant clusters
(a) Mutation rates estimated using BEAST . The error bar corresponds to 95% credibility intervals. The dashed line represents the mutation rate estimated in previous pneumococcal study of 1.57×10⁻⁶ substitution per site per year (95% confidence interval 1.34 to 1.79×10⁻⁶). (b) Recombination events per mutation (r/m) across investigated clusters quantified by 2 separate methods: linear regression on each branch of the appropriate phylogeny and the arithmetic mean of r/m on each branch. The error bars represent 95% confidence intervals. BC3-NT (highlighted in blue) has the highest r/m, with its sub-clusters NT and serotype 14 highlighted in red and green respectively.
Figure 3
Figure 3. Recombination hotspots in seven prevalent clusters
The panels (from top to bottom) are ordered based on the cluster population size. For each cluster, recombination hotspots were identified as sites with recombination frequency above the 95th percentile of homologous recombination detected in that cluster. The 95th percentile levels are indicated as horizontal dashed lines. Shaded in different colors are recombination hotspots detected in at least 4 out of 7 studied clusters. These common hotspots, based on their order on the genome, are pneumococcal surface protein A (pspA, purple), penicillin binding protein 2× (pbp2x, blue), penicillin binding protein 1a (pbp1a, green), dihydrofolate reductase (folA, orange), penicillin binding protein 2b (pbp2b, red), and pneumococcal surface protein C (pspC, grey). The figure includes 2,077 recombination events; the 132 events associated with mobile genetic elements are not displayed.
Figure 4
Figure 4. Associations between recombining genes and resistant phenotypes
(a) β-lactam resistance. The centre shows a SNP based phylogeny of concatenated pbp1a, pbp2b and pbp2x from 3,085 strains rooted on S. mitis. The inner ring is colored according to membership of the 7 dominant population clusters (BC1-7). The outer ring is coloured based on β-lactam resistance phenotypes (susceptible – white, non-susceptible – black). (b) Co-trimoxazole resistance. The centre shows SNP based phylogenies of folA and folP. The color scheme for the inner ring is the same as for the concatenated pbp genes, while the outer ring is colored according to co-trimoxazole resistance phenotype (sensitive – white, intermediate – grey, resistant – black)

References

    1. O’Brien KL, Nohynek H. Report from a WHO Working Group: standard method for detecting upper respiratory carriage of Streptococcus pneumoniae. The Pediatric infectious disease journal. 2003;22:e1–11. - PubMed
    1. Adetifa IM, et al. Pre-vaccination nasopharyngeal pneumococcal carriage in a Nigerian population: epidemiology and population biology. PloS one. 2012;7:e30548. - PMC - PubMed
    1. Hanage WP, et al. Evidence that pneumococcal serotype replacement in Massachusetts following conjugate vaccination is now complete. Epidemics. 2010;2:80–4. - PMC - PubMed
    1. Croucher NJ, et al. Rapid pneumococcal evolution in response to clinical interventions. Science. 2011;331:430–4. - PMC - PubMed
    1. Croucher NJ, et al. Population genomics of post-vaccine changes in pneumococcal epidemiology. Nature genetics. 2013;45:656–63. - PMC - PubMed

Publication types

MeSH terms