. 2014 Mar;46(3):220-4.
doi: 10.1038/ng.2896. Epub 2014 Feb 9.

The deleterious mutation load is insensitive to recent population history

Affiliations

The deleterious mutation load is insensitive to recent population history

Yuval B Simons et al. Nat Genet. 2014 Mar.

Abstract

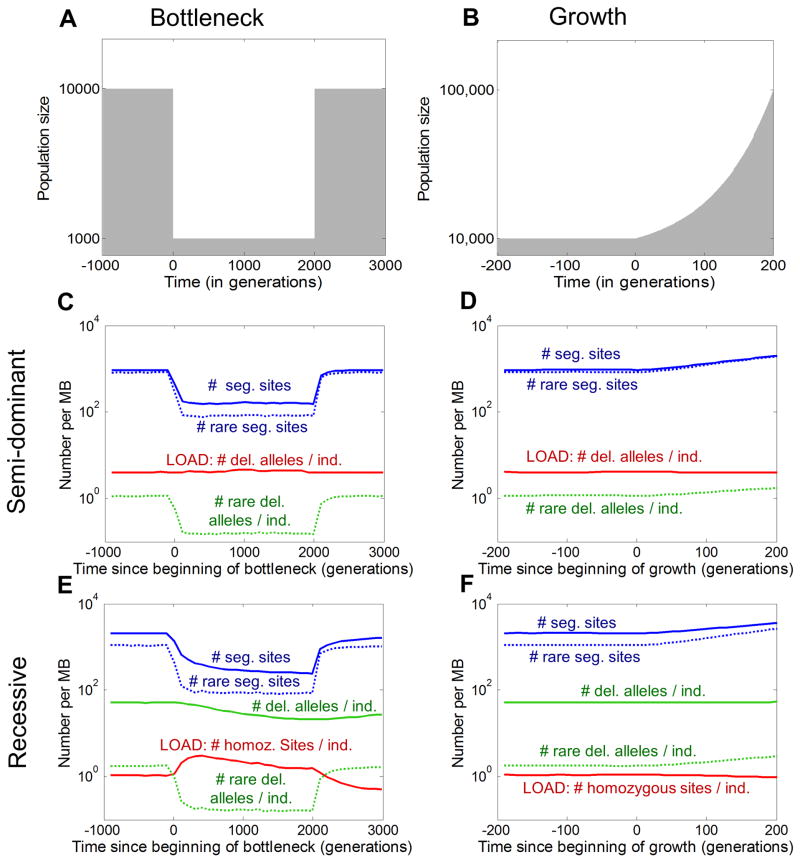
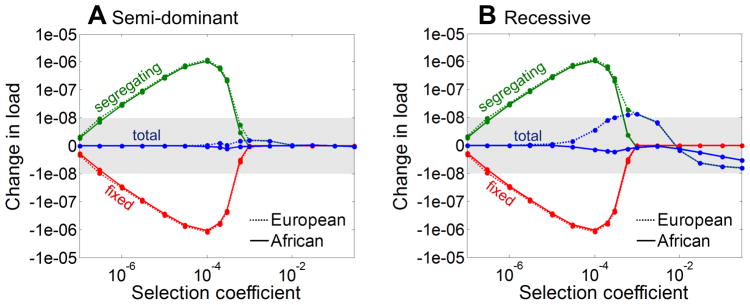
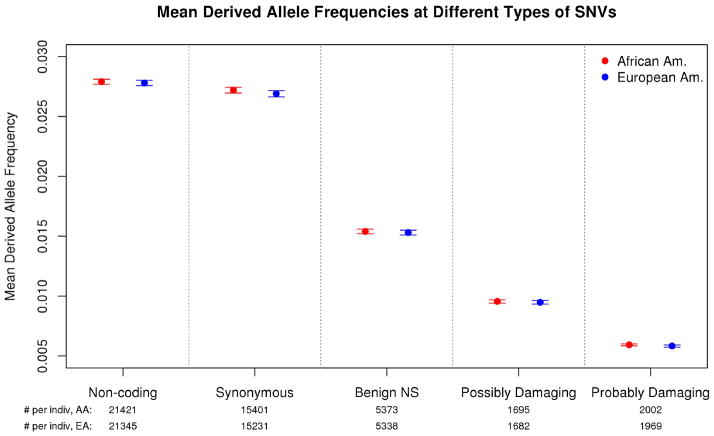
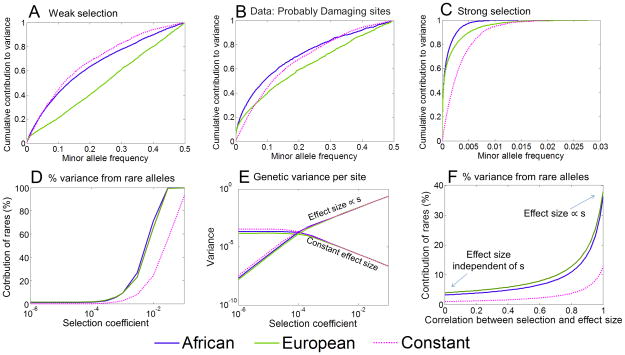
Human populations have undergone major changes in population size in the past 100,000 years, including recent rapid growth. How these demographic events have affected the burden of deleterious mutations in individuals and the frequencies of disease mutations in populations remains unclear. We use population genetic models to show that recent human demography has probably had little impact on the average burden of deleterious mutations. This prediction is supported by two exome sequence data sets showing that individuals of west African and European ancestry carry very similar burdens of damaging mutations. We further show that for many diseases, rare alleles are unlikely to contribute a large fraction of the heritable variation, and therefore the impact of recent growth is likely to be modest. However, for those diseases that have a direct impact on fitness, strongly deleterious rare mutations probably do have an important role, and recent growth will have increased their impact.


Conflict of interest statement

Competing Interests. The authors declare that they have no competing financial interests.

Figures

Figure 1
Figure 1. Time course of load and other key aspects of variation through a bottleneck (A) and exponential growth (B)
Each data line shows the expected number of variants, or alleles per MB, assuming semi-dominant mutations (C and D) or recessive mutations (E and F) with s = 1% and mutation rate per site per generation=10−8. Versions of these plots with linear scales can be found in Supplementary Figures 13, 14, and 16.
Figure 2
Figure 2. Changes in load due to changes in population size during the histories of European and African Americans for (A) semi-dominant and (B) recessive sites
The blue lines denote the difference in load per base pair of DNA sequence in the present day population compared to the ancestral (constant) population size, as a function of selection coefficient. The green and red lines show the difference in load due to segregating and fixed variants, respectively. As can be seen, the increase in load due to segregating variation in modern populations approximately cancels out with the decrease in load due to fixed sites. The scale on the y-axis is linear within the grey region and logarithmic outside.
Figure 3
Figure 3. Observed mean allele frequencies in African and European Americans at various classes of SNVs
The plot shows mean frequencies in each population, plus and minus two standard errors, using exome sequence data from Fu et al.. Here a site is considered an SNV if it is segregating in the combined AA-EA sample of 6515 individuals. The functional classifications of sites are from PolyPhen2 with bias-correcting modifications. The AA and EA mean frequencies are essentially identical within all five functional categories (p>0.05).
Figure 4
Figure 4. Predicted effect of demography on the genetic architecture of disease risk
All the plots assume an additive trait and, with the exception of (B), are based on simulations with semi-dominant selection under the Tennessen et al. demographic model. Results for the constant population size model are also provided for comparison. The upper plots show the cumulative fractions of genetic variance due to alleles at frequency < x, based on: (A) simulated data with weak selection (s =.0002); (B) assuming the observed frequency spectrum at “probably damaging” sites, , where a constant population size of 14,474 and selection coefficient of 0.02% are used for comparison; and (C) simulated data with strong selection (s = .01). Panel (D) depicts the fraction of variance due to rare alleles (i.e., < 0.1%) as a function of the selection coefficient; (E) shows the per-site contribution to variance as a function of the selection coefficient under two extreme models, with effect sizes that are either independent of s (constant) or proportional to s; (F) shows the expected fraction of the variance due to rare variants (i.e., < 0.1%) as a function of the correlation between the selection on, and effect size of variants. Further details on the model are provided in the Methods.

References

    1. Coventry A, et al. Deep resequencing reveals excess rare recent variants consistent with explosive population growth. Nature Communications. 2010;1:131. - PMC - PubMed
    1. Marth GT, et al. The functional spectrum of low-frequency coding variation. Genome Biology. 2011;12:R84. - PMC - PubMed
    1. Keinan A, Clark AG. Recent explosive human population growth has resulted in an excess of rare genetic variants. Science. 2012;336:740–743. - PMC - PubMed
    1. Nelson MR, et al. An abundance of rare functional variants in 202 drug target genes sequenced in 14,002 people. Science. 2012;337:100–104. - PMC - PubMed
    1. Tennessen JA, et al. Evolution and functional impact of rare coding variation from deep sequencing of human exomes. Science. 2012;337:64–69. - PMC - PubMed

Publication types

LinkOut - more resources