. 2014 Mar;15(3):283-93.
doi: 10.1038/ni.2828. Epub 2014 Feb 9.

Stage-specific control of early B cell development by the transcription factor Ikaros

Affiliations

Stage-specific control of early B cell development by the transcription factor Ikaros

Tanja A Schwickert et al. Nat Immunol. 2014 Mar.

Abstract

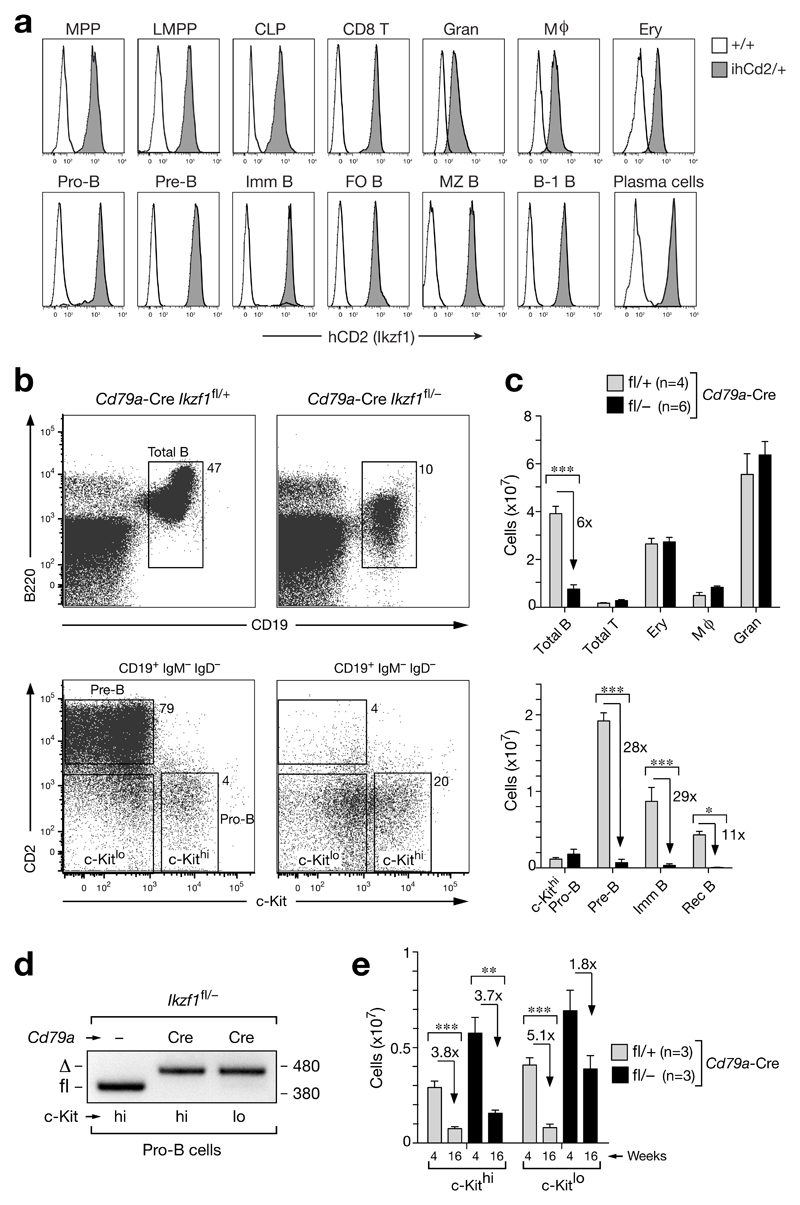
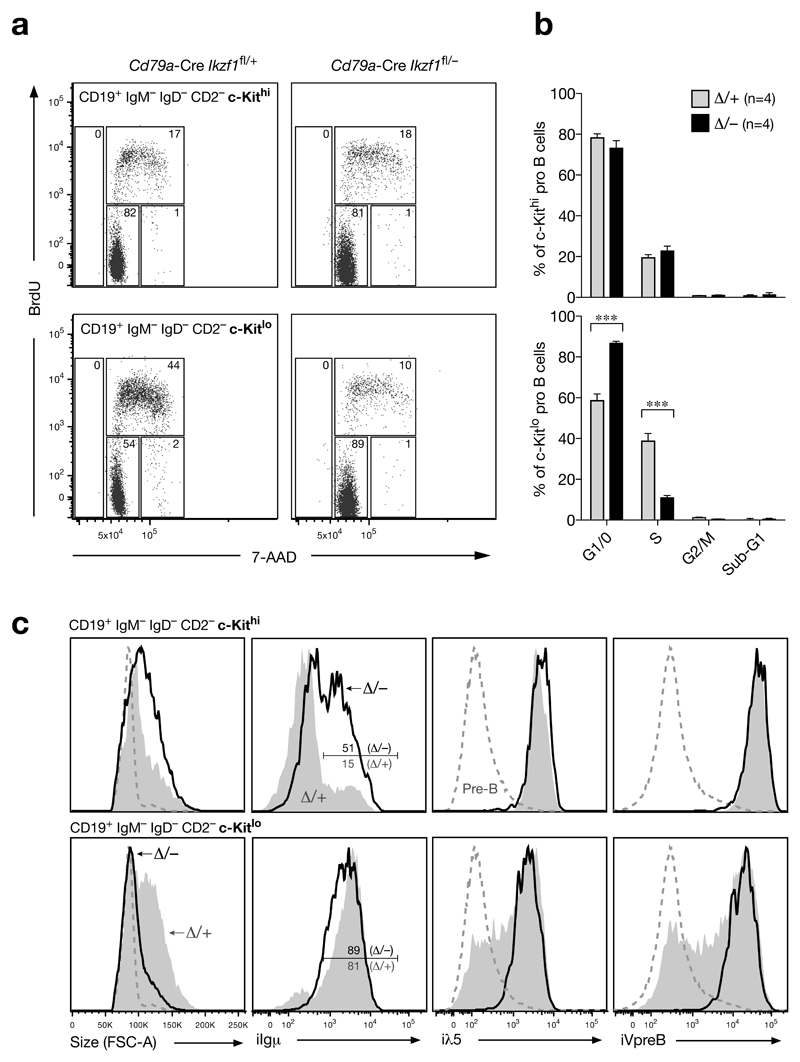
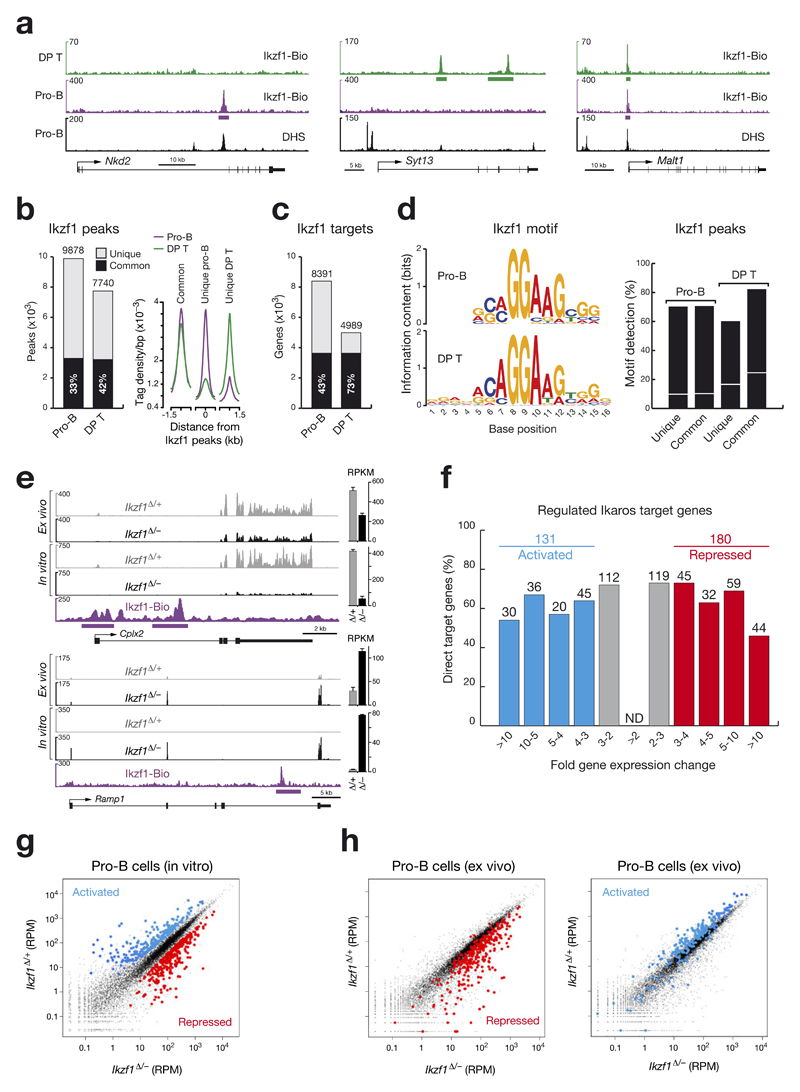
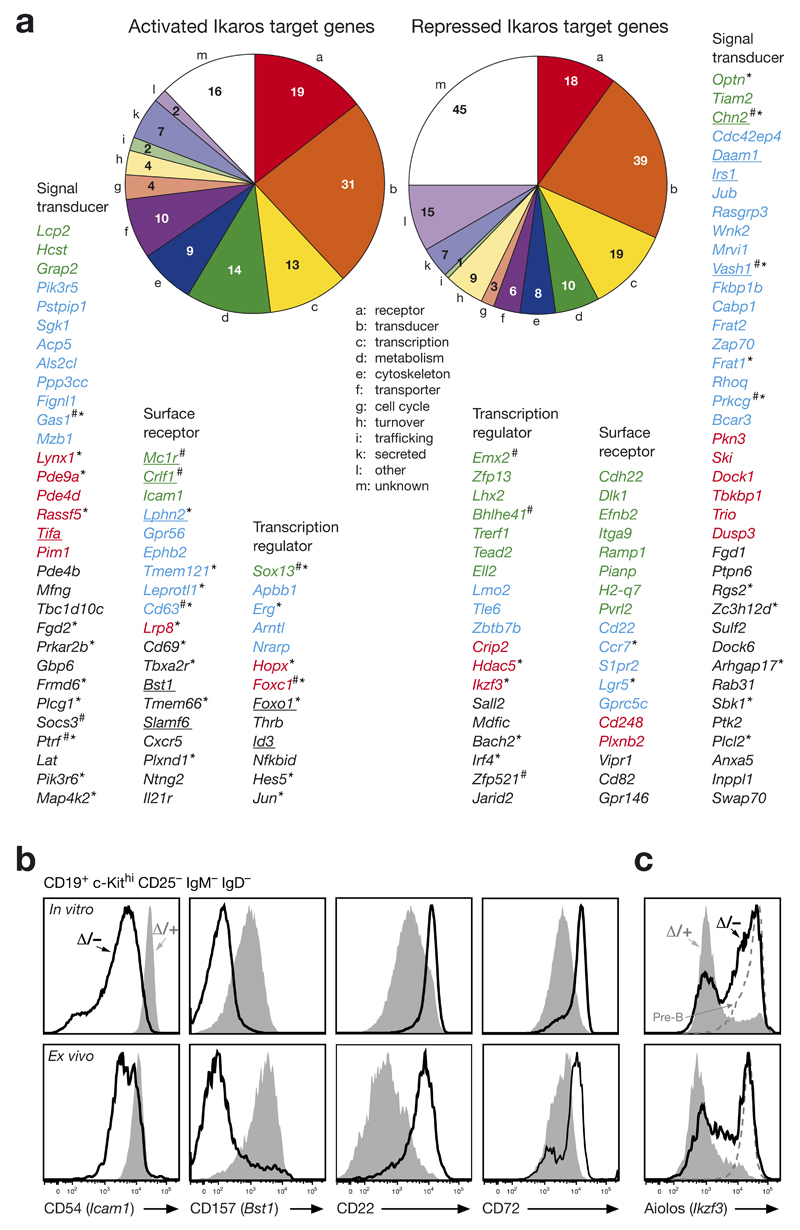
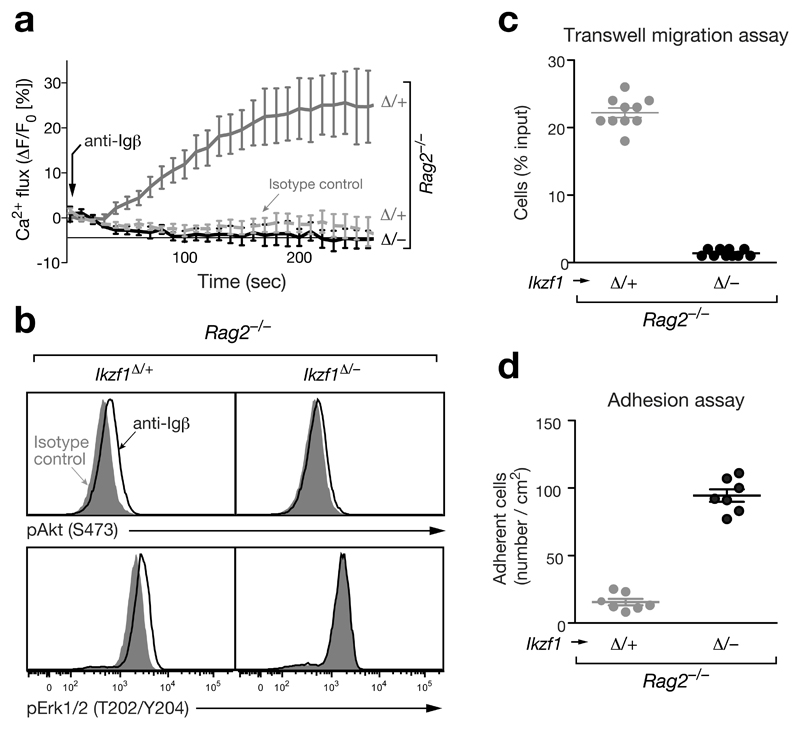
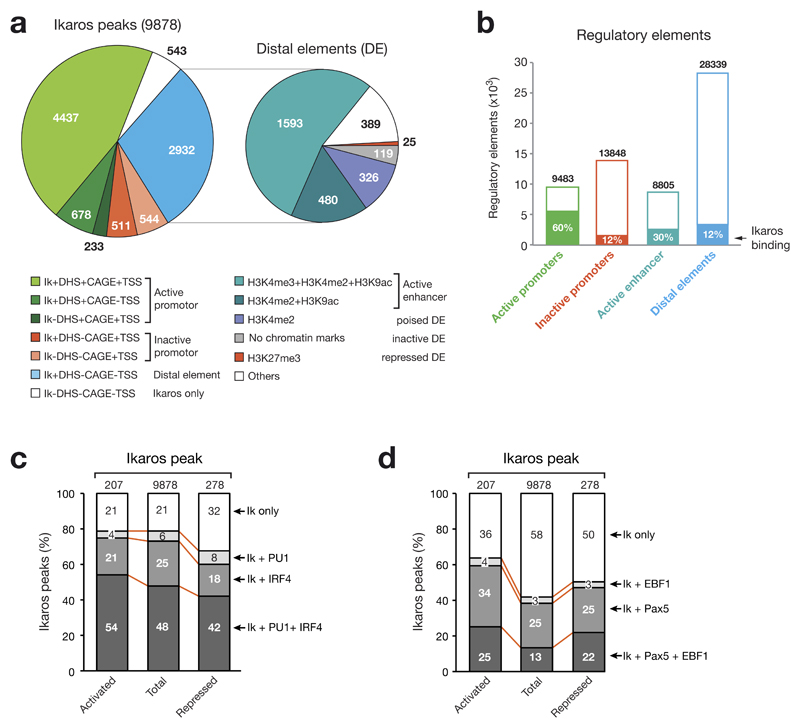
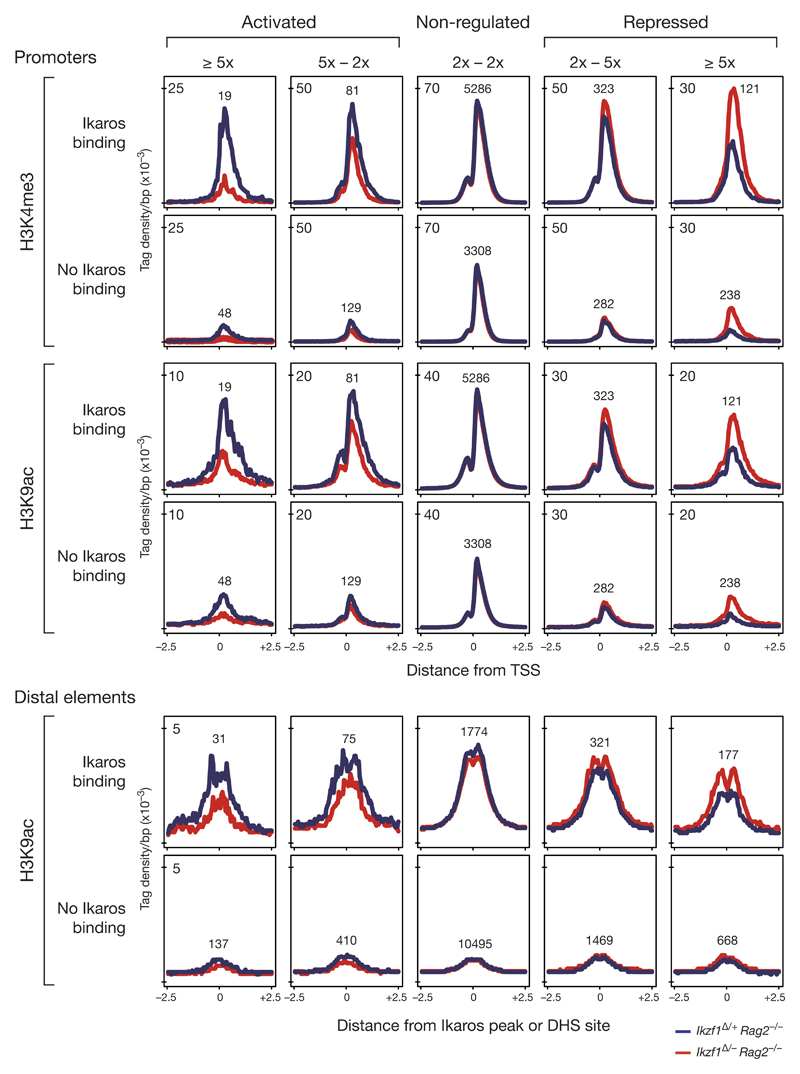
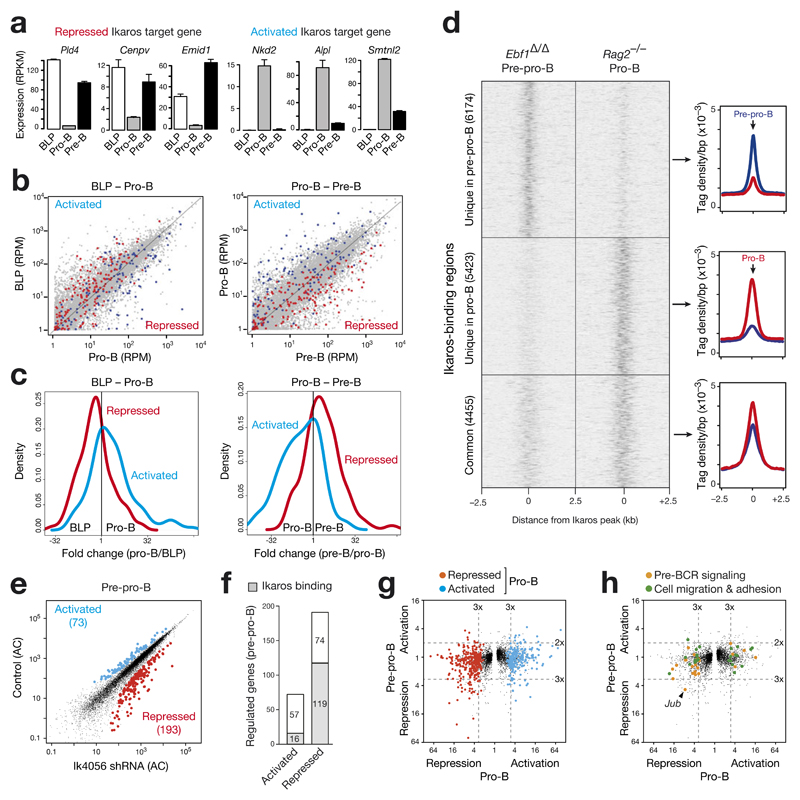
The transcription factor Ikaros is an essential regulator of lymphopoiesis. Here we studied its B cell-specific function by conditional inactivation of the gene encoding Ikaros (Ikzf1) in pro-B cells. B cell development was arrested at an aberrant 'pro-B cell' stage characterized by increased cell adhesion and loss of signaling via the pre-B cell signaling complex (pre-BCR). Ikaros activated genes encoding signal transducers of the pre-BCR and repressed genes involved in the downregulation of pre-BCR signaling and upregulation of the integrin signaling pathway. Unexpectedly, derepression of expression of the transcription factor Aiolos did not compensate for the loss of Ikaros in pro-B cells. Ikaros induced or suppressed active chromatin at regulatory elements of activated or repressed target genes. Notably, binding of Ikaros and expression of its target genes were dynamically regulated at distinct stages of early B lymphopoiesis.


Figures

Figure 1
Figure 1. Ikaros loss in pro-B cells arrests development at the pro-B to pre-B cell transition.
(a) Flow cytometry analysis of human (h) CD2 expression in different hematopoietic cell types (defined in Online Methods) of Ikzf1ihCd2/+ (grey) and wild-type (black line) mice. Follicular (FO) B, marginal zone (MZ) B, B-1 B and CD8 T cells were isolated from the spleen, whereas bone marrow was used to analyze all other cell types. MPP, multipotent progenitor; LMPP, lymphoid-primed multipotent progenitors; CLP, common lymphoid progenitor; Imm, immature; Gran, granulocyte; Mϕ, macrophage; Ery, erythroblast. (b,c) Flow cytometry (b) and absolute numbers (c) of the indicated cell types in bone marrow isolated from the femur and tibia of the two hind legs of 6-8-week-old Cd79a-Cre Ikzf1fl/+ mice (grey bars) and Cd79a-Cre Ikzf1fl/– littermates (black bars). Numbers refer to percent cells in the indicated gate (b), and n indicates the number of mice analyzed (c). Statistical data (c) are shown with SEM and were analyzed by two-way analysis of variance (ANOVA) with Bonferoni’s post-test; * (p < 0.05), ** (p < 0.01), *** (p < 0.001). (d) Deletion of the floxed Ikzf1 allele in ex vivo sorted c-Kithi and c-Kitlo pro-B cells from Cd79a-Cre Ikzf1fl/– and control Ikzf1fl/– mice. PCR fragments corresponding to the deleted (Δ) or intact (fl) floxed allele are indicated to the left and their size (in base pairs) to the right of the PCR gel. (e) Age-dependent pro-B cell numbers. Absolute numbers are shown for c-Kithi and c-Kitlo pro-B cells (CD19+CD25IgMIgD) in the bone marrow of Cd79a-Cre Ikzf1fl/+ (grey bar) and Cd79a-Cre Ikzf1fl/– (black bar) mice at the age of 4 and 16 weeks. Statistical data (e) are shown with SEM and were analyzed by the Student t-test (two-tailed, unpaired); * (p < 0.05), ** (p < 0.01), *** (p < 0.001).
Figure 2
Figure 2. Cell cycle arrest of Ikaros-deficient c-Kitlo ‘pro-B’ cells despite Igμ expression.
(a, b) Cell cycle analysis. Following intraperitoneal injection of BrdU for 40 minutes, the bone marrow of 5-8-week-old mice was stained for cell surface proteins and subsequently fixed, permeabilized and DNase I-treated prior to detection of total DNA with 7-AAD and incorporated BrdU with BrdU antibodies. c-Kithi (upper panel) and c-Kitlo (lower panel) CD19+CD2IgMIgD cells from experimental Cd79a-Cre Ikzf1fl/– mice (Δ/–; black bars) and control Cd79a-Cre Ikzf1fl/+ mice (Δ/+; grey bars) were analyzed by flow cytometry for DNA content and BrdU incorporation. Representative FACS plots (a) are shown together with the average percentage of cells in the different cell cycle phases (b). n indicates the number of mice analyzed. Statistical data (b) are shown with SEM and were analyzed by two-way analysis of variance (ANOVA) with Bonferoni’s post-test; *** (p < 0.001). (c) Flow cytometric analysis. c-Kithi and c-Kitlo CD19+CD2IgMIgD cells from the bone marrow of experimental Cd79a-Cre Ikzf1fl/– mice (black line) and control Cd79a-Cre Ikzf1fl/+ littermates (grey) were analyzed for cell size (FSC-A) and expression of Igμ, λ5 and VpreB by intracellular staining. Small pre-B cells (c-Kitlo/–CD19+CD2+IgMIgD; dashed line) of control Cd79a-Cre Ikzf1fl/+ mice are shown for comparison.
Figure 3
Figure 3. Identification of regulated Ikaros target genes in pro-B cells.
(a) Ikaros binding at unique and common sites in pro-B cells and CD4+CD8+ double-positive (DP) thymocytes. Ikaros-binding sites were identified by Bio-ChIP-sequencing of Ikzf1ihCd2/ihCd2 Rosa26BirA/BirA Rag2–/– pro-B cells (purple) and Ikzf1ihCd2/ihCd2 Rosa26BirA/BirA DP T cells (green). Genes with unique and common Ikaros-binding sites are shown together with their DNase I hypersensitive (DHS) sites, exon-intron structure and a scale bar shown in kilobases (kb). Bars below the ChIP-seq track indicate Ikaros-binding regions identified by MACS peak calling. (b) Number and overlap of Ikaros peaks in pro-B and DP T cells. Total numbers of 9,878 and 7,740 Ikaros peaks with an overlap of 3,293 common peaks (black bar) were identified in pro-B and DP T cells, respectively, by using a p-value of < 10-10 for peak calling. Average sequence tag density profiles aligned at the center of the Ikaros peaks are shown for common and unique Ikaros-binding sites in the two cell types (right). (c) Identification of common and unique Ikaros target genes in pro-B and DP T cells by peak-to-gene assignment as described. (d) Consensus Ikaros recognition sequence identified by de novo motif discovery in pro-B and DP T cells. The respective motifs had E-values of 1.8x10-59 (pro-B) and 7.8x10-142 (DP T) and were detected at the indicated frequency (%) in common and unique Ikaros peaks of pro-B and DP T cells, respectively (right). The same motifs were found in random DNA sequences at the frequency indicated by a white line. (e) Expression of the two regulated Ikaros target genes Cplx2 and Ramp1 in short-term in vitro cultured and ex vivo sorted pro-B cells of Cd79a-Cre Ikzf1fl/– (Ikzf1Δ/–; black) and Cd79a-Cre Ikzf1fl/+ (Ikzf1Δ/+; grey) mice, as determined by RNA-seq. Normalized expression values are indicated as RPKMs (plus SEM) to the right. Ikaros peaks were identified by Bio-ChIP-seq. (f) Identification of activated and repressed Ikaros target genes in short-term cultured pro-B cells. The number and percentage of Ikaros target genes are shown for the indicated fold gene expression differences between experimental Ikzf1Δ/– and control Ikzf1Δ/+ pro-B cells. For evaluation of the RNA-seq data, see Online Methods. Activated and repressed genes were further selected for an RPKM value of > 5 in control Ikzf1Δ/+ pro-B cells (activated) or Ikzf1Δ/– pro-B cells (repressed), respectively (Supplementary Table 1). ND, not determined. (g) Scatter plot of gene expression differences observed between in vitro cultured Ikzf1Δ/– and Ikzf1Δ/+ pro-B cells. The normalized expression data of individual genes in the two pro-B cell types were plotted as RPM (reads per gene per million mapped sequence tags) values. Each dot represents one gene. Activated and repressed Ikaros target genes, which were identified as described in (f), are colored in blue or red, respectively. (h) Scatter plot of gene expression changes determined in ex vivo sorted Ikzf1Δ/– and Ikzf1Δ/+ pro-B cells. Genes in the ex vivo RNA-seq data, which correspond to the activated and repressed Ikaros target genes identified in in vitro cultured pro-B cells (f), are colored in blue and red, respectively.
Figure 4
Figure 4. Function of activated and repressed Ikaros target genes in pro-B cells.
(a) Pie diagram indicating the different functional classes of activated and repressed Ikaros target genes in pro-B cells. Regulated Ikaros target genes coding for cell surface protein, signal transducer and transcription factors are shown below and ranked according to their fold expression changes observed between in vitro cultured Ikzf1Δ/– and Ikzf1Δ/+ pro-B cells (Fig. 3f; Supplementary Table 1). The color code refers to >10-fold (green), 5-10-fold (blue), 4-5-fold (red) and 3-4-fold (black). Underlined target genes were jointly activated or repressed by Ikaros and Pax5 (ref. 20). The number sign (#) indicates genes with low expression levels in ex vivo sorted pro-B cells, i.e. < 5 RPKM in Ikzf1Δ/+ pro-B cells for activated target genes and < 5 RPKM in Ikzf1Δ/– pro-B cells for repressed target gene. Asterisks indicate genes, which were not regulated (< 1.4-fold) in short-term cultured Ikzf1Δ/– Rag2–/– and Ikzf1Δ/+ Rag2–/– pro-B cells. (b) Validation of regulated Ikaros target genes at the protein level. In vitro cultured and ex vivo c-Kithi pro-B cells (CD19+CD2IgMIgD) of the Cd79a-Cre Ikzf1fl/– (Δ/–; black line) and Cd79a-Cre Ikzf1fl/+ (Δ/+; grey) genotypes were analyzed by flow cytometry for the expression of cell surface proteins encoded by activated (Icam1, Bst1) and repressed (Cd22) target genes as well as by the indirectly repressed gene Cd72. (c) Aiolos expression in Ikzf1 mutant pro-B cells. Aiolos expression was analyzed by intracellular staining of in vitro cultured and ex vivo c-Kithi pro-B cells (CD19+CD2IgMIgD) from the Cd79a-Cre Ikzf1fl/– (Δ/–; black line) and Cd79a-Cre Ikzf1fl/+ (Δ/+; grey) mice. Small pre-B cells (c-KitCD19+B220+CD2+IgMIgD; dashed line) of control mice are shown for comparison.
Figure 5
Figure 5. Ikaros controls pre-BCR signaling, cell migration and adhesion.
(a) Calcium signaling. Intracellular Ca2+ fluxes in Cd79a-Cre Ikzf1fl/– Rag2–/– or Cd79a-Cre Ikzf1fl/+ Rag2–/– pro-B cells were recorded as an increase of the fluorescent emission of the Ca2+ sensor dye eFluor 524 (eBioscience) at 530/30 nm (excitation at 488 nm) after addition of the anti-Igβ antibody HM79 (arrow). An anti-TCRγδ antibody of the same isotype (hamster IgG2) was used as a control. (b) Signaling via the PI3K and MAPK pathways. Pro-B cell of the indicated genotypes were stimulated for 5 min with anti-Igβ or control anti-TCRγδ antibodies prior to flow cytometric assessment of the phosphorylation of Akt at Ser473 (pAkt) and Erk1/2 at Thr202/Tyr204 (pErk1/2). (c) Transwell migration assay. Pro-B cells of the indicated genotypes in IL-7-containing IMDM medium were placed in the upper compartment, whereas IL-7 medium containing 400 ng/ml CXCL12 (SDF-1α; Sigma) was present in the lower compartment of a transwell chamber separated by a filter of 5 μm-pore size. Pro-B cells migrating into the lower chamber were measured after 2 hours in a Casy cell counter and are indicated as percentage of the total cells per well (shown as circle). The average percentage and SEM of three independent experiments are shown. (d) Adhesion assay. Pro-B cells of the indicated genotypes were allowed to adhere to VCAM1-Fc-coated glass slides in the presence of CXCL12 for 6 hours in IL-7-containing IMDM medium, washed 2 times and fixed in 4% paraformaldehyde (see Online Methods). Individual wells (shown as circles) of one experiment were evaluated by manual cell counting, and the average cell density with SEM is shown for pro-B cells of the indicated genotypes.
Figure 6
Figure 6. Overlap of Ikaros binding with the regulatory landscape and other transcription factor-binding sites in pro-B cells.
(a) Distribution of Ikaros (Ik) peaks at active and inactive promoters as well as distal elements. The regulatory landscape of Rag2–/– pro-B cells was previously determined by genome-wide mapping of DHS sites as well as active transcription start sites by the cap analysis of gene expression (CAGE) method. TSS refers to mm9-annotated transcription start sites and CAGE to transcriptionally active TSSs. Non-annotated active promoters were defined by the category +DHS+CAGE-TSS. Distal elements (DE) were further subdivided into active enhancers as well as poised, inactive and repressed distal elements by genome-wide mapping of active (H3K4me2, H3K4me3, H3K9ac) and repressive (H3K27me3) histone marks. (b) Relative enrichment of Ikaros-binding sites at distinct regulatory elements in Rag2–/– pro-B cells. The total number of the different elements is shown together with the relative percentage of Ikaros binding. (c,d) Co-localization of Ikaros peaks with binding sites of PU.1 and IRF4 (c) or Pax5 and EBF1 (d). The co-occurrence of binding sites was determined by multiple overlap analysis of ChIP-seq data identifying binding of Pax5 (ref. 20), EBF1 (ref. 26), PU.1 (see Online Methods) and IRF4 (see Online Methods) in Rag2–/– pro-B cells. The overlap of binding sites is shown as percentage relative to total Ikaros-binding sites (Fig. 3b) and Ikaros-binding sites present at activated and repressed Ikaros target genes (Fig. 3f,g). Supplementary Fig. 6a shows examples of genes with overlapping transcription factor-binding sites.
Figure 7
Figure 7. Chromatin changes at promoters and distal elements of Ikaros-regulated genes.
Ikaros-dependent chromatin changes were identified by ChIP-seq mapping of the active histone modifications H3K4me3 and H3K9ac in short-term cultured Cd79a-Cre Ikzf1fl/– Rag2–/– (red) and Cd79a-Cre Ikzf1fl/+ Rag2–/– (blue) pro-B cells. Genes were classified according to their degree of Ikaros-dependent regulation (in the two Rag2–/– pro-B cell types) and the presence or absence of Ikaros-binding sites at their regulatory elements. The average density of the histone marks is shown for a region extending from -2.5 kb to +2.5 kb relative to the TSS at promoters or center of the Ikaros peak or DHS site (no Ikaros binding) at distal elements. Only promoters and distal elements of genes with an expression level of > 2 RPKM in control pro-B cells (activated, not regulated) or in Ikaros-deficient pro-B cells (repressed) were analyzed. The number of peaks analyzed is shown for each category. Wilcoxon pair-matched comparison of the peak density at the regulatory elements in Ikzf1Δ/– Rag2–/– and Ikzf1Δ/+ Rag2–/– pro-B cells revealed p-values of < 10-3 for all chromatin changes observed at promoters and distal elements of activated (> 2x) and repressed (> 2x) genes.
Figure 8
Figure 8. Ikaros regulates distinct target genes during early B-lymphopoiesis.
(a) Expression of selected repressed and activated Ikaros target genes during early B cell development. The expression of each gene in ex vivo sorted wild-type BLPs, Rag2–/– pro-B cells and wild-type pre-B cells (this study) is shown as normalized expression value (RPKM) with SEM based on two independent RNA-seq experiments of each cell type. (b) Scatter plot of gene expression differences observed for the developmental transition from BLPs to pro-B cells and from pro-B to pre-B cells. Normalized expression data of individual genes in the two cell types were plotted as RPM values (grey dots), and the genes in these RNA-seq data, which correspond to the 131 activated and 180 repressed Ikaros target genes identified in cultured pro-B cells (Fig. 3f,g), were colored as blue and red dots, respectively. (c) The fold expression change in the two developmental transitions is displayed as a density plot for the activated and repressed Ikaros target genes identified in pro-B cells. (d) Differential binding of Ikaros in pre-pro-B and pro-B cells. Ikaros binding in cultured Vav-Cre Ebf1fl/fl (Ebf1Δ/Δ) Ikzf1ihCd2/ihCd2 Rosa26BirA/+ pre-pro-B cells was determined by Bio-ChIP-seq and compared to the Ikaros binding pattern of Rag2–/– pro-B cells (Fig. 3a,b). Unique and common Ikaros peaks of the two cell types are shown as heat maps (left) and density plots (right). (e) Scatter plot of gene expression differences between Ik4056 shRNA-expressing Ebf1–/– pre-pro-B cells and control Ebf1–/– pre-pro-B cells, which expressed either the Renilla luciferase Ren713 shRNA or empty retroviral vector. The expression of each gene in the experimental and control pre-pro-B cells was plotted as the corresponding adjusted count (AC; see Online Methods). Ikaros-activated genes (> 2-fold) and Ikaros-repressed genes (> 3-fold) with an adjusted p-value of < 0.1 are highlighted in blue and red, respectively. See Online Methods for detailed description of the shRNA experiments and bioinformatical analysis of the RNA-seq data. (f) Identification of activated and repressed Ikaros target genes in pre-pro-B cells. (g,h) Minimal overlap between regulated Ikaros target genes in pre-pro-B and pro-B cells. The fold expression change between Ikzf1Δ/– and Ikzf1Δ/+ pro-B cells (x-axis) as well as between Ik4056 shRNA-expressing and control Ebf1–/– pre-pro-B cells (y-axis) is plotted for each gene. (g) The 131 activated and 180 repressed Ikaros target genes identified in pro-B cells (Fig. 3f,g) are colored as blue and red dots. (h) Regulated Ikaros target genes, which are implicated in pre-BCR signaling (19) or cell adhesion and migration (22) in pro-B cells (Supplementary Fig. 4a,b), are highlighted as orange and green dots, respectively.

References

    1. Georgopoulos K. Haematopoietic cell-fate decisions, chromatin regulation and Ikaros. Nature Rev Immunol. 2002;2:162–174. - PubMed
    1. Wang J-H, et al. Selective defects in the development of the fetal and adult lymphoid system in mice with an Ikaros null mutation. Immunity. 1996;5:537–549. - PubMed
    1. Mullighan CG, et al. BCR-ABL1 lymphoblastic leukaemia is characterized by the deletion of Ikaros. Nature. 2008;453:110–114. - PubMed
    1. Mullighan CG, et al. Deletion of IKZF1 and prognosis in acute lymphoblastic leukemia. N Engl J Med. 2009;360:470–480. - PMC - PubMed
    1. Ng SY-M, Yoshida T, Zhang J, Georgopoulos K. Genome-wide lineage-specific transcriptional networks underscore Ikaros-dependent lymphoid priming in hematopoietic stem cells. Immunity. 2009;30:493–507. - PMC - PubMed

Online Methods References

    1. Wang J-H, et al. Selective defects in the development of the fetal and adult lymphoid system in mice with an Ikaros null mutation. Immunity. 1996;5:537–549. - PubMed
    1. Lin H, Grosschedl R. Failure of B-cell differentiation in mice lacking the transcription factor EBF. Nature. 1995;376:263–267. - PubMed
    1. Vilagos B, et al. Essential role of EBF1 in the generation and function of distinct mature B cell types. J Exp Med. 2012;209:775–792. - PMC - PubMed
    1. Driegen S, et al. A generic tool for biotinylation of tagged proteins in transgenic mice. Transgenic Res. 2005;14:477–482. - PubMed
    1. Shinkai Y, et al. RAG-2-deficient mice lack mature lymphocytes owing to inability to initiate V(D)J rearrangement. Cell. 1992;68:855–867. - PubMed

Publication types

MeSH terms

Substances

Associated data