. 2014 Mar;15(3):294-304.
doi: 10.1038/ni.2821. Epub 2014 Feb 9.

Loss of Ikaros DNA-binding function confers integrin-dependent survival on pre-B cells and progression to acute lymphoblastic leukemia

Affiliations

Loss of Ikaros DNA-binding function confers integrin-dependent survival on pre-B cells and progression to acute lymphoblastic leukemia

Ila Joshi et al. Nat Immunol. 2014 Mar.

Abstract

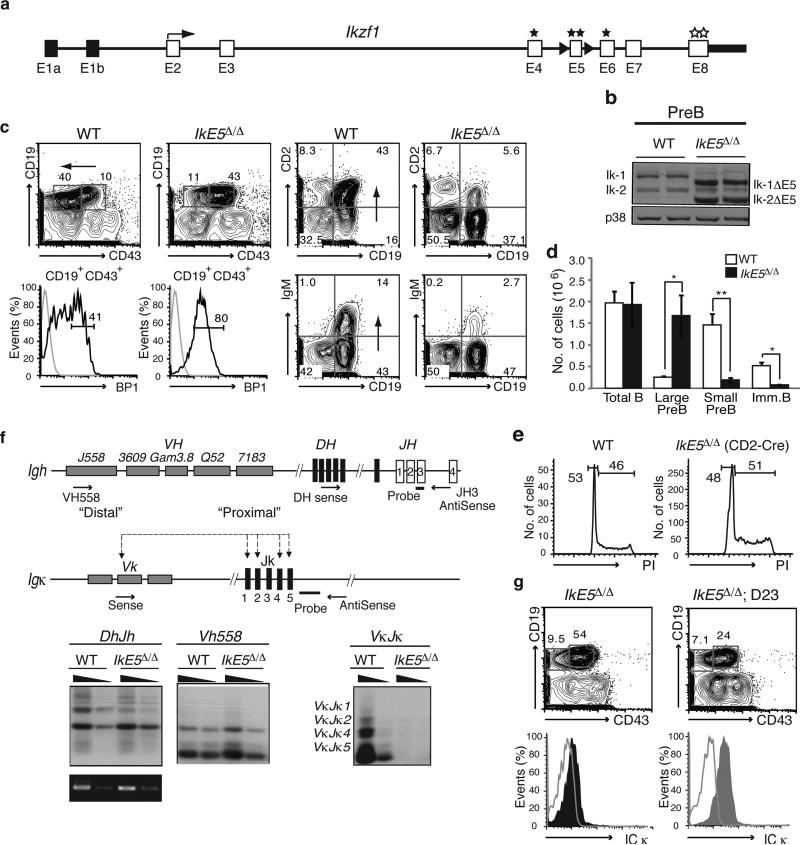
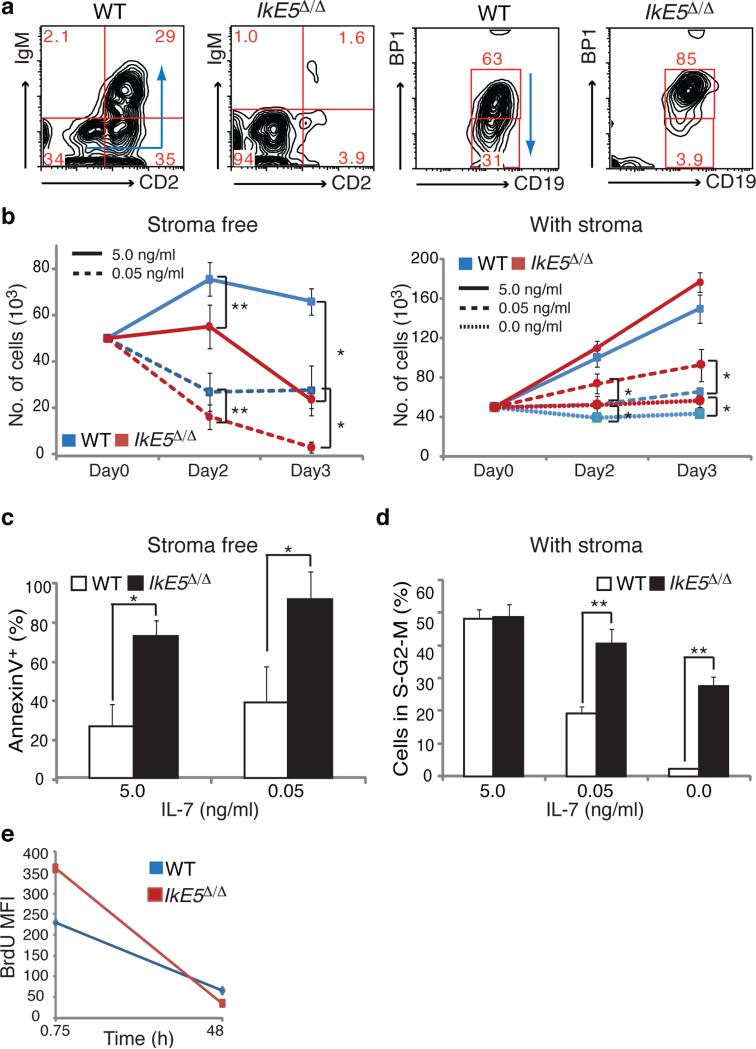
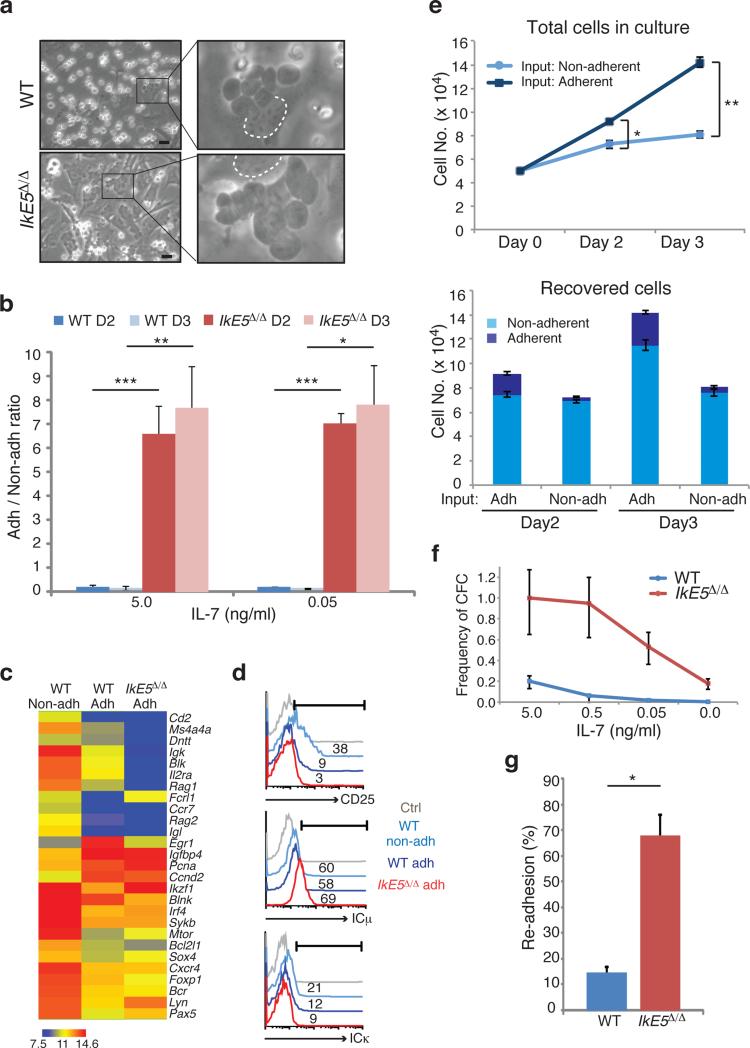
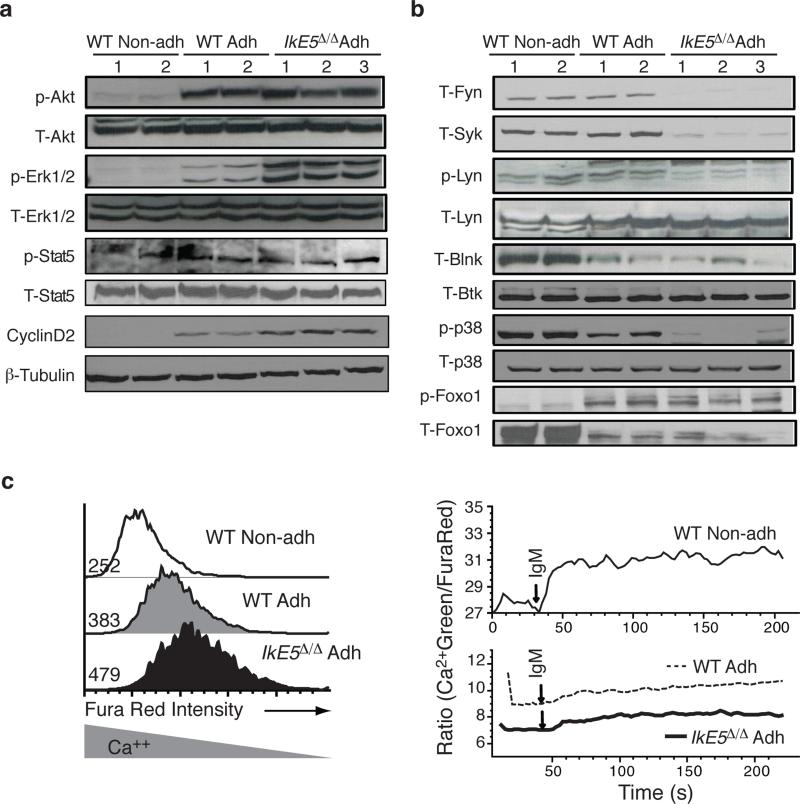
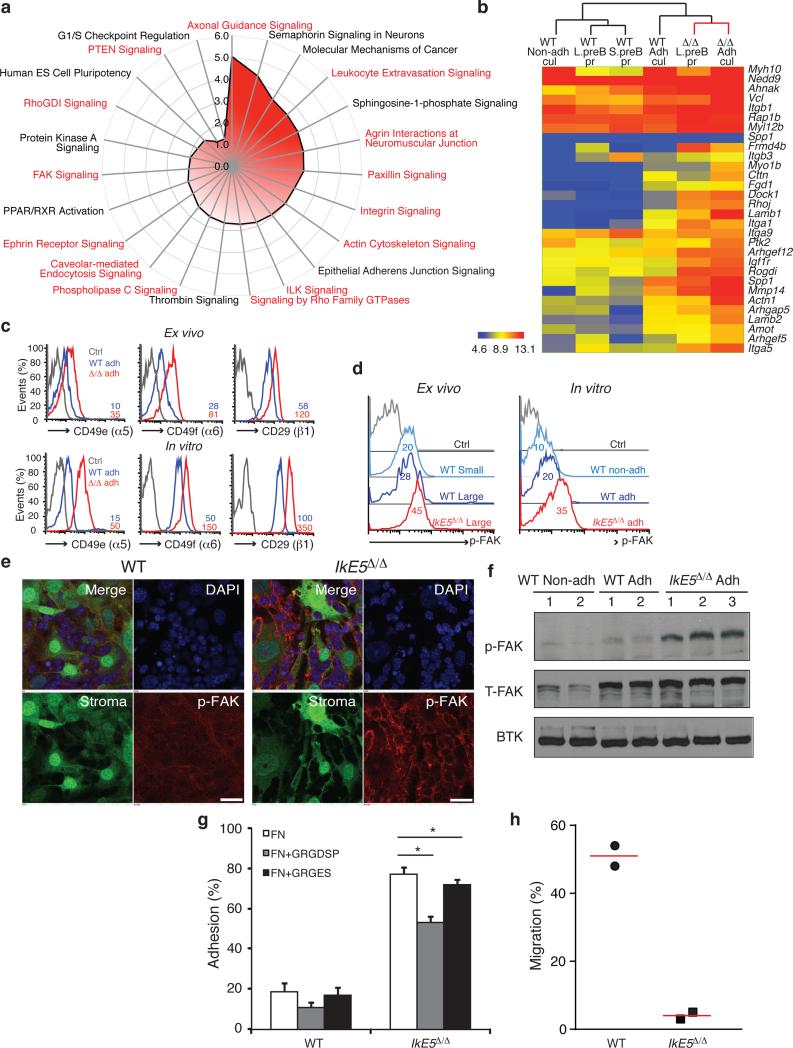
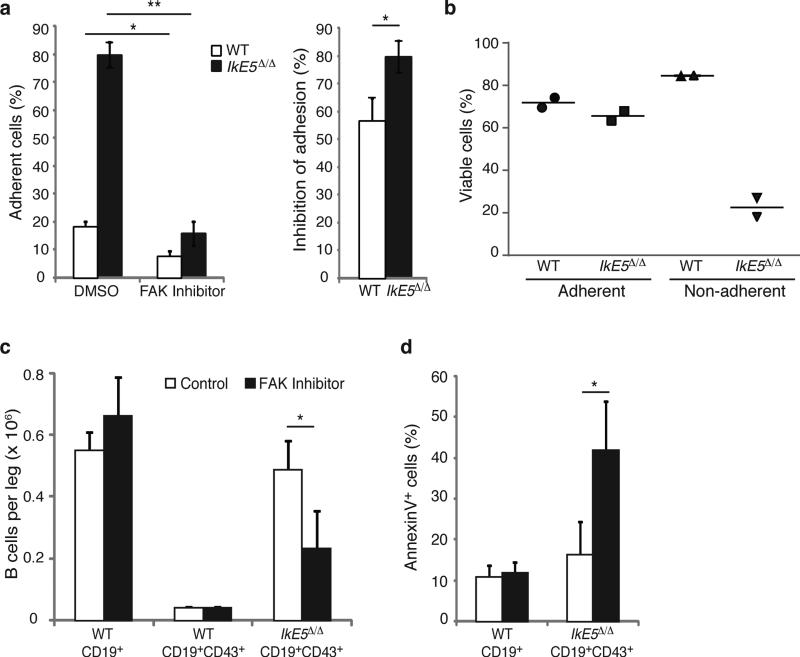
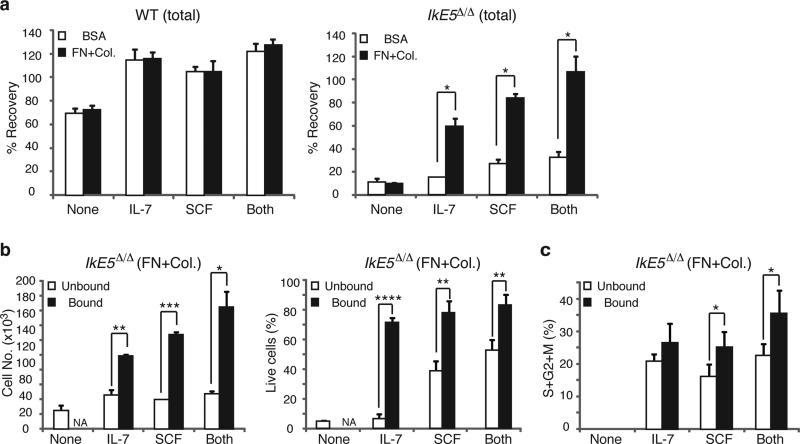
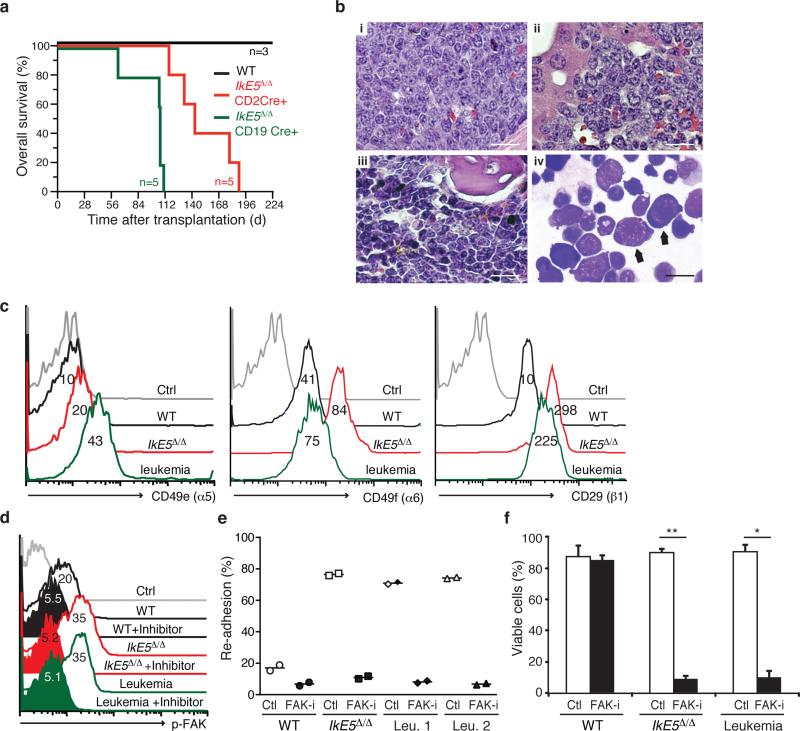
Deletion of the DNA-binding domain of the transcription factor Ikaros generates dominant-negative isoforms that interfere with its activity and correlate with poor prognosis in human precursor B cell acute lymphoblastic leukemia (B-ALL). Here we found that conditional inactivation of the Ikaros DNA-binding domain in early pre-B cells arrested their differentiation at a stage at which integrin-dependent adhesion to niches augmented signaling via mitogen-activated protein kinases, proliferation and self-renewal and attenuated signaling via the pre-B cell signaling complex (pre-BCR) and the differentiation of pre-B cells. Transplantation of polyclonal Ikaros-mutant pre-B cells resulted in long-latency oligoclonal pre-B-ALL, which demonstrates that loss of Ikaros contributes to multistep B cell leukemogenesis. Our results explain how normal pre-B cells transit from a highly proliferative and stroma-dependent phase to a stroma-independent phase during which differentiation is enabled, and suggest potential therapeutic strategies for Ikaros-mutant B-ALL.


Figures

Figure 1
Figure 1. Pre-B cell differentiation is dependent on the Ikaros gene family
a, Strategy to generate a conditional Ikzf1 dominant-negative allele. Non-coding (black) and coding (white) exons, with exon 5 flanked by loxP sites (black arrowheads) for deletion are shown at the Ikzf1 locus. Stars mark zinc fingers involved in DNA binding (E4-E6) or protein dimerization (E8). b, Immunoblot analysis of Ikaros isoforms (Ik-1 and Ik-2) in WT and IkE5Δ/Δ pre-B cells. Shift in size indicates exon 5 deletion. c, Flow cytometric analysis of wild-type (WT) and IkE5fl/fl CD2-Cre bone marrow (BM) cells. Expression of stage-specific markers (as in Supplementary Fig. 1a) identify large pre-B cells (CD19+CD43+BP1+), small pre-B cells (CD19+CD2+IgM), and immature B cells (CD19+IgM+) in the BM. d, Absolute number of cells/(femur + tibia)×2 in various B cell subsets in WT and IkE5Δ/Δ BM are shown as a graph of means ± standard deviation (s.d.). Asterisks indicate a statistically significant change between WT and mutant B cell subsets (n=10 for WT and mutant; *P < 0.01, **P < 0.0001, two-tailed Student's t-test). e, Representative cell cycle analysis of ex-vivo isolated large pre-B cells from WT and IkE5fl/fl CD2-Cre mice. Gates show relative number of cells in G0/G1 and S/G2/M phase. f, Igh and Igk rearrangements in Ikaros-deficient pre-B cells. Diagram of Igh and Igk loci depicting proximal and distal V, D and J clusters tested for recombination with primers and probes used for detection. Recombination products were amplified by PCR with decreasing amounts of pre-B cell DNA (depicted as black triangles) and with amplification of Ikzf1 non-deleted genomic fragment as loading control. g, Igk recombination fails to rescue the IkE5Δ/Δ large pre-B cell block. Analysis as described in Fig. 1c with intracellular staining for Igκ chain performed on IkE5Δ/Δ and IkE5Δ/Δ: D23 large pre-B cells (CD19+CD43+BP1+).
Figure 2
Figure 2. Ikaros-deficient pre-B cells grow only on stroma
a, Flow cytometric analysis of sorted large pre-B cells (CD19+CD43+BP1+) cultured for 7 days stromal-free with limiting serum and IL-7. Differentiation of WT and IkE5Δ/Δ large pre-B cells is monitored by stage-specific markers. Arrows indicate the direction of pre-B cell differentiation as depicted in Supplementary Fig. 1a. b, Growth of WT and IkE5Δ/Δ large pre-B cells in high, low, and no (5, 0.05, and 0 ng/ml, respectively) IL-7 concentrations under stromal-free conditions (left) or with OP9 BM stroma (right). The mean absolute number of cells obtained in stromal-free (n=5) and stromal-containing (n=4) cultures with replicates for each experiment is shown in a line graph ± s.d. Asterisks denote significant differences between WT and mutant cells (*P < 0.05, **P < 0.01, two-tailed Student's t-test). c, Mean percentage ± s.d. of apoptotic (AnnexinV+) WT and IkE5Δ/Δ large pre-B cells in stromal-free cultures as in Fig. 2b, left panel. d, Cell cycle stage distribution (mean percentage ± s.d. of cells in S+G2+M) of WT and IkE5Δ/Δ large pre-B stromal cultures as in Fig. 2b, right panel. Asterisks in c and d denote significant differences between WT and mutant cells (*P < 0.05, **P < 0.01, two-tailed Student's t-test). e, Cell cycle kinetics of WT and IkE5Δ/Δ large pre-B cells grown on stroma as measured by BrdU pulse-chase. The mean fluorescence intensity (MFI) of BrdU staining is shown at 45 min of pulse and after 48 h of chase.
Figure 3
Figure 3. A stromal-dependent self-renewing phase in pre-B cell differentiation is greatly augmented by loss of Ikaros
a, An adherent phase in pre-B cell differentiation as revealed in stromal cultures of WT and IkE5Δ/Δ large pre-B cells grown in the presence of IL-7 (5 ng/ml). Areas with adherent cells were marked with rectangles (left) and digitally magnified (right). Dotted circle marks the nucleus of OP9 stromal cells used as a stromal reference (scale bar, 30 μm). b, Ratio of adherent to non-adherent cells in WT and IkE5Δ/Δ pre-B cultures at day 2 (D2) and day 3 (D3) with 5 and 0.05 ng/ml of IL-7. The mean ratio is presented ± s.d. Asterisks denote significant differences between WT and mutant pre-B cells at each culture time point (***P < 0.0001, **P < 0.01, *P < 0.05, two-tailed Student's t-test). c, Comparative expression analysis of pre-B cell differentiation genes in adherent and non-adherent pre-B cells. Hierarchical clustering of normalized gene expression values across different conditions is shown. d, Flow cytometric analysis of adherent and non-adherent cells from WT and IkE5Δ/Δ large pre-B cell stromal cultures for CD25 and intracellular Igκ and Igκ. The percentages of positive cells relative to isotype control (grey curve) are indicated. e, Rates of propagation of WT adherent and non-adherent pre-B cell fractions grown with 5 ng/ml of IL-7. The mean number of cells generated by 5 × 10⁴ adherent (dark blue) or non-adherent (light blue) WT pre-B cells after replating on OP9 stroma for 3 days of culture is shown in the top panel. The mean number of adherent and non-adherent subsets recovered from plating either WT adherent or non-adherent pre-B cell stromal cultures is shown in the bottom panel. Error bars indicate s.d. Asterisks indicate a statistically significant difference in the growth (top panel) of WT adherent and non-adherent B cells (*P< 0.05, **P < 0.01, two-tailed Student's t-test). f, Limiting dilution colony forming assay was performed as described previously. The mean frequency of colony forming cells was calculated based on Poisson distribution and is presented in a line graph ± s.e. g, Re-association of WT and IkE5Δ/Δ pre-B cells after replating on stroma. The mean percentage ± s.d. of stromal-adherent cells, measured 3 hrs after replating is shown. Study was performed with two independent WT and mutant pre-B cell cultures (closed and open symbols), each assayed in ten grids/well. Binding to stroma was calculated per twenty grids and averaged for each cell type (*P < 0.0001, two-tailed Student's t-test).
Figure 4
Figure 4. Signaling pathways in WT and Ikaros-deficient pre-B cells
a-b, Immunoblot analysis of proliferation and survival (a) and differentiation (b) signaling pathways activated by IL-7R and pre-BCR is shown. Representative expression and activity of pre-BCR-affiliated PTKs and downstream differentiation-inducing signaling effectors, as described in Supplementary Fig. 4a, are shown from two WT and three IkE5Δ/Δ independent stromal cultures of primary cells after limited in vitro propagation. β-tubulin, T-Btk or T-p38 serve as loading controls for WT and IkE5Δ/Δ pre-B cells and non-adherent WT pre-B cells. c, Intracellular Ca2+ levels (Fura Red, left panel) at steady state and Ca2+ flux (Green/Fura Red, right panel) measured after anti-IgM-stimulation of WT and IkE5Δ/Δ adherent and non-adherent pre-B cells. Fura Red staining and MFI shown on the left site inversely correlates with Ca2+ levels. Data are representative of two independent WT and mutant pre-B cell cultures.
Figure 5
Figure 5. Increase in integrin signaling mediates adhesion of IkE5Δ/Δ pre-B cells to a stromal niche
a, Pathway analysis of genes upregulated in IkE5Δ/Δ relative to WT large pre-B cells. Analysis was performed with a signature of upregulated genes shared by ex vivo mutant pre-B cells prior to and after limited stromal expansion. Pathways enriched for integrins and integrin signaling effectors are highlighted in red. b, Upregulated expression of components of the integrin-actin cytoskeleton pathway in primary and cultured WT and IkE5Δ/Δ pre-B cells as defined in Figs. 1 and 3. Hierarchical clustering of normalized gene expression values across different conditions is shown. c, Cell surface expression of integrins α5, β6, and activated β1 in ex vivo sorted and in vitro cultures of large pre-B cells. MFI for integrin staining is provided. d-f, Increase in FAK activation measured by flow cytometry, immunoblot and confocal microscopy. d, Flow cytometric analysis of p-FAK expression in ex-vivo and in vitro cultured large pre-B cells. MFI for p-FAK is indicated. e, Confocal immunofluorescence microscopy detection of activated p-FAK (red channel), GFP-expressing OP9 stroma (green channel), and nuclei (DAPI, blue channel). Scale bar, 25 μm. f, Immunoblot analysis of total FAK and activated p-FAK, with Btk as a loading control as in Fig. 4a. g, Adhesion of WT and IkE5Δ/Δ adherent pre-B cells to fibronectin-coated plates (left panel) in the presence of the fibronectin-derived RGD peptide or the RGE mutant variant (right panel). Asterisks denote significant differences in adhesion between mutant pre-B cells in the presence or absence of RGD or RGE peptides (n=3; *P < 0.05, two-tailed Student's t-test). h, Chemotaxis of WT (circle) and IkE5Δ/Δ (square) pre-B cells measured in a transwell migration assay in the presence of SDF1. The mean percentage of cells recovered at the bottom of the well in two independent studies is shown.
Figure 6
Figure 6. FAK inhibition interferes with survival of IkE5Δ/Δ pre-B cells
a-b. In vitro effects of FAK inhibition on pre-B cell stromal adhesion and survival. The mean percentage ± s.d. of adherent cells (left) and % inhibition of adhesion ± s.d. (right), are shown in (a). The percentage of viable adherent and non-adherent cells recovered in the presence of FAK inhibitor is shown in (b). The data in (a) are from two independent cultures with replicate testing (n=4). For Annexin staining described in (b) replicates were pooled. c-d, In vivo effect of FAK inhibition on IkE5Δ/Δlarge pre-B cells. c, The mean number ± s.d. of pro-B-large pre-B cells (CD19+CD43+) per leg (femur + tibia) of WT (n=2) and IkE5Δ/Δ CD19-Cre (n=3) mice is shown after 3-5 doses of FAK inhibitor (WT, n=3; IkE5Δ/Δ CD19-Cre, n=6) or vehicle control (WT, n=2; IkE5Δ/Δ CD19-Cre, n=3). The effect of FAK inhibitor treatment on total BM B cells (CD19+) in WT mice is also shown. d, Percent of apoptotic cells (mean ± s.d.) of BM cells from panel c. Asterisks in a, c, and d denote significant changes in adhesion, cellularity or survival of WT and mutant large pre-B cells in the presence of the FAK inhibitor vs. control (*P < 0.05, **P < 0.01, ***P <0.001, two-tailed Student's t-test).
Figure 7
Figure 7. Cooperation between integrin and growth factor signaling supports survival and proliferation of IkE5Δ/Δ pre-B cells
a, Effect of integrin and cytokine signaling on WT and IkE5Δ/Δ pre-B cell survival. Mean percent recovery ± s.d. of WT (left) and IkE5Δ/Δ (right) adherent pre-B cells after overnight incubation on plates coated with integrin ligands (fibronectin and collagen, FN+Col) or BSA, in the absence (None) or presence of cytokines (IL-7, SCF, or Both). Asterisks denote significant differences in the number of mutant pre-B cells recovered in the presence of cytokines with or without integrin ligand binding. The data shown is from two independent cultures with replicate testing in each (n=4; *P < 0.01, two-tailed Student's t-test). b, Effect of integrin and cytokine signaling on survival of IkE5Δ/Δ pre-B cells. The mean number ± s.d. of plate-bound and -unbound WT and IkE5Δ/Δ pre-B cells recovered after overnight incubation in plates coated with integrin ligands (FN+Col) in the presence of cytokines (IL-7, SCF, or Both) or without cytokines (None). The mean percent ± s.d. of viable cells in the bound and unbound fractions is shown on the right. Asterisks denote significant changes in number or survival of mutant pre-B cells under the different conditions (n=3; *P < 0.05, **P < 0.01, ***P <0.001, ****P <0.0001 two-tailed Student's t-test). c, Effect of integrin and cytokine signaling on proliferation of IkE5Δ/Δ pre-B cells. The mean percent ± s.d. of cycling cells (S+G2+M) in the bound and unbound fractions of IkE5Δ/Δ pre-B cells as described in Fig. 6b is shown. Asterisks denote significant differences in proliferation of mutant pre-B cells measured when bound or not bound to integrin ligands in the presence of different cytokines (n=3; *P < 0.05, two-tailed Student's t-test).
Figure 8
Figure 8. Leukemogenic potential of IkE5Δ/Δ pre-B cells
a, Kaplan-Meier survival curve of NSG mice transplanted with WT or IkE5Δ/Δ pre-B cells. The survival of both cohorts of recipients of IkE5Δ/Δ pre-B cells was significantly shorter than recipients of WT pre-B cells (P = 0.013, Mantel-Cox tests). b, Histopathology of precursor B-cell acute lymphoblastic leukemia/lymphoma derived from IkE5Δ/Δ pre-B cells. (i–iii): Hematoxylin & eosin-stained sections of spleen (i), liver (ii), and BM (iii) from a premorbid NSG recipient (sacrificed day 63 post-transplant) of IkE5Δ/Δ pre-B cells from a CD19-Cre donor. Note the extensive infiltration of all organs with large cells with moderate cytoplasm and prominent nucleoli, and frequent mitotic figures (arrows). Scale bars, 50 μm. (iv) Wright-Giemsa stain of cytospin of BM from this recipient (scale bar, 20 μm). Note predominant population of large lymphoblasts with immature nuclei and basophilic cytoplasm (arrows). c, Integrin expression is elevated in both IkE5Δ/Δ pre-leukemic and leukemic pre-B cells. Percentage of WT, IkE5Δ/Δ pre-leukemic and leukemic pre-B cells expressing integrins α5 (CD49e), α6 (CD49f) and β1 (CD29). d, FAK activation (pFAK) measured by flow cytometry in the presence and absence of FAK inhibitor in WT and mutant pre-B cells. e, FAK inhibition interferes with stromal adhesion of IkE5Δ/Δ preleukemic and leukemic pre-B cells. Inhibitor-treated, closed symbols; vehicle-treated, open symbols. (n=2 each). f, FAK inhibition induces cell death in IkE5Δ/Δ pre-leukemic and leukemic pre-B cells (n=4; *P <10-6, **P <10−7 two-tailed Student's t-test).

References

    1. Monroe JG. ITAM-mediated tonic signalling through pre-BCR and BCR complexes. Nat Rev Immunol. 2006;6:283–294. - PubMed
    1. Herzog S, Reth M, Jumaa H. Regulation of B-cell proliferation and differentiation by pre-B-cell receptor signalling. Nat Rev Immunol. 2009;9:195–205. - PubMed
    1. Gauld SB, Cambier JC. Src-family kinases in B-cell development and signaling. Oncogene. 2004;23:8001–8006. - PubMed
    1. Kitamura D, et al. A critical role of lambda 5 protein in B cell development. Cell. 1992;69:823–831. - PubMed
    1. Gong S, Nussenzweig MC. Regulation of an early developmental checkpoint in the B cell pathway by Ig beta. Science. 1996;272:411–414. - PubMed

Publication types

MeSH terms

Substances

Associated data