. 2014 Apr 17;508(7496):397-401.
doi: 10.1038/nature13047. Epub 2014 Feb 9.

A committed precursor to innate lymphoid cells

Affiliations

A committed precursor to innate lymphoid cells

Michael G Constantinides et al. Nature. .

Abstract

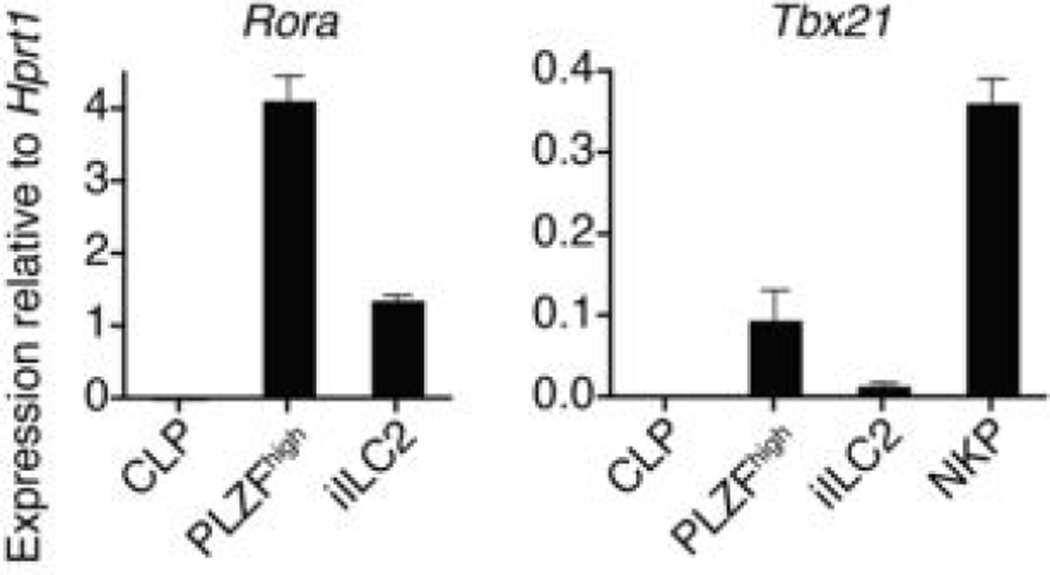
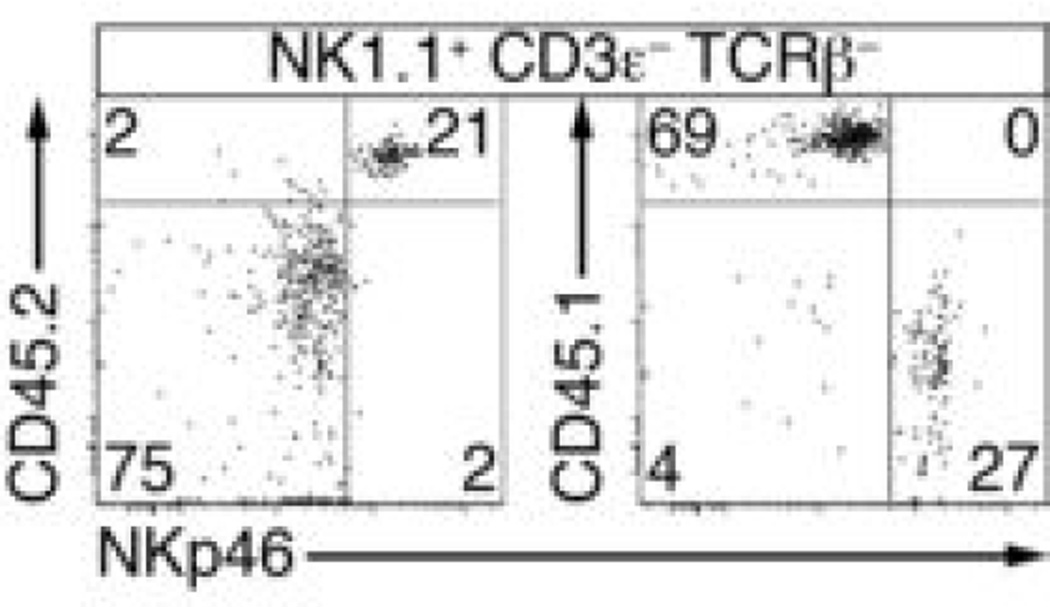
Innate lymphoid cells (ILCs) specialize in the rapid secretion of polarized sets of cytokines and chemokines to combat infection and promote tissue repair at mucosal barriers. Their diversity and similarities with previously characterized natural killer (NK) cells and lymphoid tissue inducers (LTi) have prompted a provisional classification of all innate lymphocytes into groups 1, 2 and 3 solely on the basis of cytokine properties, but their developmental pathways and lineage relationships remain elusive. Here we identify and characterize a novel subset of lymphoid precursors in mouse fetal liver and adult bone marrow that transiently express high amounts of PLZF, a transcription factor previously associated with NK T cell development, by using lineage tracing and transfer studies. PLZF(high) cells were committed ILC progenitors with multiple ILC1, ILC2 and ILC3 potential at the clonal level. They excluded classical LTi and NK cells, but included a peculiar subset of NK1.1(+)DX5(-) 'NK-like' cells residing in the liver. Deletion of PLZF markedly altered the development of several ILC subsets, but not LTi or NK cells. PLZF(high) precursors also expressed high amounts of ID2 and GATA3, as well as TOX, a known regulator of PLZF-independent NK and LTi lineages. These findings establish novel lineage relationships between ILC, NK and LTi cells, and identify the common precursor to ILCs, termed ILCP. They also reveal the broad, defining role of PLZF in the differentiation of innate lymphocytes.


Figures

Figure 1
Figure 1. ILC lineage tracing in PLZFGFPcre reporter mice
a-c, Top rows, expression of eGFP by indicated cell-types of PLZFGFPcre+/+ mice (filled grey) and WT (open); Bottom rows, YFP expression in radiation chimeras reconstituted with YFPLinSca-1+cKit+ (LSK) bone marrow cells from PLZFGFPcre+/− ROSA26-YFP mice. CLP and iILC2 from bone marrow (BM); B & T and NK from spleen; NKT from thymus (eGFP), divided in early stage 1-2 and late stage 3, and from spleen (YFP); ILC2 from lung; DX5+ and DX5 NK cells from liver; ILC1 from intestinal IEL; LTi and ILC3 from LPL. BM iILC2 and lung ILC2 were identified as LinCD25+IL-7Rα+Thy1.2+; LPL ILC2 as CD3εCD19CD25+KLRG1+; LPL NCR+ ILC3 as CD3εCD19NKp46+NK1.1; LPL CD4 LTi cells as CD3εCD19IL-7Rα+KLRG1CCR6+CD4; LPL CD4+ LTi cells as CD3εCD19CCR6+CD4+; and IEL ILC1 as CD3εCD19NKp46+NK1.1+CD160+. FACS identification of the remaining subsets is defined in the methods section. d, summary of results (mean ± s.e.m). Data representative of 3-9 individual mice analyzed in at least 2 independent experiments.
Figure 2
Figure 2. PLZFhigh cells in fetal liver and bone marrow
a, FACS analysis of total BM cells from adult WT littermate and PLZFGFPcre+/+ mice. Data representative of at least 3 independent experiments. b-c, eGFP expression is confined to the α4β7high population of indicated fractions in fetus and adult. Representative of at least 3 independent experiments. d, FACS analysis of PLZFhigh BM cells (solid line) and iILC2 (dashed line) compared with isotype controls (filled). iILC2 were gated as LinICOS+T1/ST2+Sca-1+Thy1.2+ for CD25 profile, as CD25+CD62LSca-1+Thy1.2+ for CD44 profile, as CD25+CD44+Sca-1+Thy1.2+ for CD62L profile, as CD25+T1/ST2+Sca-1+Thy1.2+ for ICOS profile, as CD25+ICOS+Sca-1+Thy1.2+ for T1/ST2 profile, as CD25+Thy1.2+ for Sca-1 profile or as CD25+ICOS+Sca-1+ for Thy1.2 profile. Representative of at least 3 independent experiments. e, RT-qPCR analysis in bone marrow subsets as indicated. NKP are LinCD27+IL-7RαFlt3CD122+ BM cells and ILC3-enriched LPL are CD3εCD19IL-7Rα+Thy1.2+KLRG1CD4 cells. Mean ± s.e.m of data from 2-3 independent experiments. f, Intracellular FACS analysis for transcription factors in cells as indicated. Representative of at least 3 independent experiments.
Figure 3
Figure 3. PLZFhigh cells are ILC progenitors
a-c, CD45.2 Rag2−/−Il2rg−/− mice were injected with equivalent numbers of tdTomato+ PLZFhigh cells and CD45.1 CLP (800-1200 of each) and the progeny of these populations analyzed 5-7 weeks later by FACS, as indicated. Summary bar graph of mean percentages ± s.e.m. in c, with significant differences between PLZFhigh- (black bar) and CLP-derived (white bar) shown by *. LPL RORγt+ NCR+ cells were identified as CD3εCD19RORγt+NKp46+CD4; LPL RORγt+NCR cells as CD3εCD19RORγt+NKp46CD4; and LPL RORγt+CD4+ cells as CD3εCD19RORγt+CD4+. Remaining populations were gated as indicated in Fig. 1. Data representative of 6-9 chimeras analyzed in at least 2 independent experiments. d, FACS analysis of LinIL-7Rα+α4β7higheGFPCXCR6 cells sorted from PLZFGFPcre+/− BM and cultured on OP9 or OP9-DL1 for 48 h. Data representative of 3 independent experiments. e, FACS analysis of sorted PLZFhigh BM cells cultured on OP9 for indicated periods. Data representative of at least 4 replicate cultures for each time point from 2 or more independent experiments. f, FACS analysis of PLZFhigh or CLP cells from adult BM or fetal liver cultured on OP9 for 4 days. Data representative of at least 4 replicate cultures from 2 or more independent experiments. g, FACS analysis of representative colonies originating from single fetal liver PLZFhigh cells that were sorted and cultured into 96-well plates containing irradiated OP9 stromal cells for 5-6 days. ILC1 were characterized as ICOSlowα4β7 NK1.1+ populations, ILC2 as ICOShighα4β7NK1.1, and ILC3 as ICOSint/highα4β7+NK1.1. The table summarizes the analysis of thirteen 96-well plates analyzed in four independent experiments (three plates in experiments 1, 2, and 4; four plates in experiment 3), with the average colony size ± s.e.m. as indicated. In experiment 4, we mixed 1:1 CD45.1/5.2 and CD45.2 PLZFGFPcre+/− fetal liver cells prior to single-cell sorting. All 122 colonies were either CD45.1/5.2 (n=59) or CD45.2 (n=63) ruling out doublet contamination as an explanation for the presence of mixed ILC colonies (p<0.01 Chi-Square). The cloning efficiency was 40% on average, with all but 17 colonies (not shown in the table) unambiguously assigned to defined ILC lineages.
Figure 4
Figure 4. PLZF is required for ILC development
a, Lethally irradiated CD45.1/2 mice were reconstituted with a mixture of CD45.2 Zbtb16−/− and CD45.1 WT BM and analyzed as indicated 5-7 weeks later. a, representative FACS analysis of LPL gated as indicated, and summary bar graph of mean percentages ± s.e.m for indicated populations, with significant variation from 1.00 indicated by *. Populations were gated as indicated in Fig. 3. Data representative of 6-10 chimeras analyzed in at least 2 independent experiments. b-c, FACS analysis of iILC2 from Zbtb16−/− mice and Zbtb16+/+ littermates, representative of 5 (b) and 8 (c) mice of each genotype analyzed in 3 or more independent experiments.
Extended Data Figure 1
Extended Data Figure 1. PLZF expression and lineage tracing in PLZFGFPcre mice
a, A sequence encoding an IRES and an eGFP-cre fusion protein was inserted immediately after the Zbtb16 stop codon in C57BL/6J ES cells and knock-in mice were bred to ACTB-FLPe mice to excise the neomycin resistance cassette and generate the PLZFGFPcre allele. b, FACS analysis of the indicated populations from PLZFGFPcre+/− ROSA26-YFP mice. c, Summary of data (mean ± s.e.m.) from 2-5 mice analyzed in 2 or more independent experiments.
Extended Data Figure 2
Extended Data Figure 2. Gating strategy for analysis of ILC and LTi among LPL
ILC2 cells were identified as IL-7Rα+ KLRG1+ among CD3ε CD19 LPL (top left), and then gated Thy1.2+ (not shown). CD3ε CD19 LPL were gated as IL-7Rα+ KLRG1 (top left) and then subsetted into CCR6+ CD4+ (CD4+ LTi cells) and CCR6+ CD4 (CD4 LTi cells) (bottom left). NCR+ ILC3 were identified as CD3ε CD19 LPL that expressed NKp46 but not NK1.1 (top right).
Extended Data Figure 3
Extended Data Figure 3. Transcription factor expression by PLZFhigh bone marrow precursors
RT-qPCR analysis for Tbx21 and Rora as indicated. NKP are Lin CD27+IL-7Rα Flt3 CD122+ BM cells. Mean ± s.e.m of data from 2-3 independent experiments.
Extended Data Figure 4
Extended Data Figure 4. PLZFhigh-derived NK1.1+ cells are distinct from CLP-derived NK1.1+ cells
CD45.2 Rag2−/−Il2rg−/− mice were injected with equivalent numbers of CD45.2 PLZFhigh cells and CD45.1 CLP (800 of each) and the resulting NK1.1+ CD3ε TCRβ cells present in the spleen were analyzed 5-7 weeks later by FACS, as indicated. Note that PLZFhigh-derived cells expressed higher amount of surface NKp46, whether they were identified as CD45.2+ or as CD45.1 in reciprocal staining experiments. Similar results were obtained for lung NK1.1+ cells. Data representative of 5 chimeras from 2 independent experiments.
Extended Data Figure 5
Extended Data Figure 5. FTOC of PLZFhigh cells
FACS analysis of PLZFhigh and CLP cells (100 of each) co-cultured for 15 days in FTOC. The percentages of PLZFhigh- or CLP-derived cells that are CD3ε+ are summarized in the bar graph. Data representative of 7 independent cultures.
Extended Data Figure 6
Extended Data Figure 6. Additional characterization of PLZFhigh cells after culture on OP9 cells
a, FACS analysis of PLZFhigh or CLP cells from adult BM cultured on OP9 for 4 days showing expression of T1/ST2 on ICOShigh cells. Data representative of 4 replicate cultures from 2 independent experiments. b, FACS analysis of fetal liver PLZFhigh cells after culture on OP9 for 7 days, showing expression of GATA3 by ICOShigh cells and RORγt by ICOSint cells. Data representative of 2 independent experiments.
Extended Data Figure 7
Extended Data Figure 7. Proposed model of ILC development
A CLP-derived IL-7Rα+ α4β7+ population bifurcates into RORγthigh LTi precursors (LTiP) and PLZFhigh ILCP, the latter of which gives rise to all ILC lineages. Whether NKP develop directly from CLPs or progress through an IL-7Rα+ α4β7+ stage has yet to be determined.

Similar articles

Cited by

References

    1. Fuchs A, et al. Intraepithelial type 1 innate lymphoid cells are a unique subset of IL-12- and IL-15-responsive IFN-gamma-producing cells. Immunity. 2013;38:769–781. - PMC - PubMed
    1. Neill DR, et al. Nuocytes represent a new innate effector leukocyte that mediates type-2 immunity. Nature. 2010;464:1367–1370. - PMC - PubMed
    1. Moro K, et al. Innate production of T(H)2 cytokines by adipose tissue-associated c-Kit(+)Sca-1(+) lymphoid cells. Nature. 2010;463:540–544. - PubMed
    1. Price AE, et al. Systemically dispersed innate IL-13-expressing cells in type 2 immunity. Proc Natl Acad Sci U S A. 2010;107:11489–11494. - PMC - PubMed
    1. Monticelli LA, et al. Innate lymphoid cells promote lung-tissue homeostasis after infection with influenza virus. Nat Immunol. 2011;12:1045–1054. - PMC - PubMed

Publication types

MeSH terms

Substances