

Thioflavin T as a fluorescence light-up probe for G4 formation
- PMID: 24510097
- PMCID: PMC4005661
- DOI: 10.1093/nar/gku111
Thioflavin T as a fluorescence light-up probe for G4 formation
Abstract
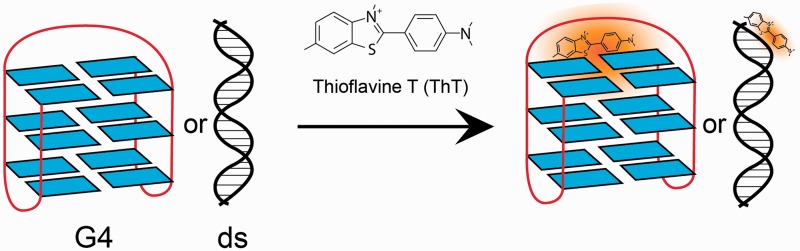
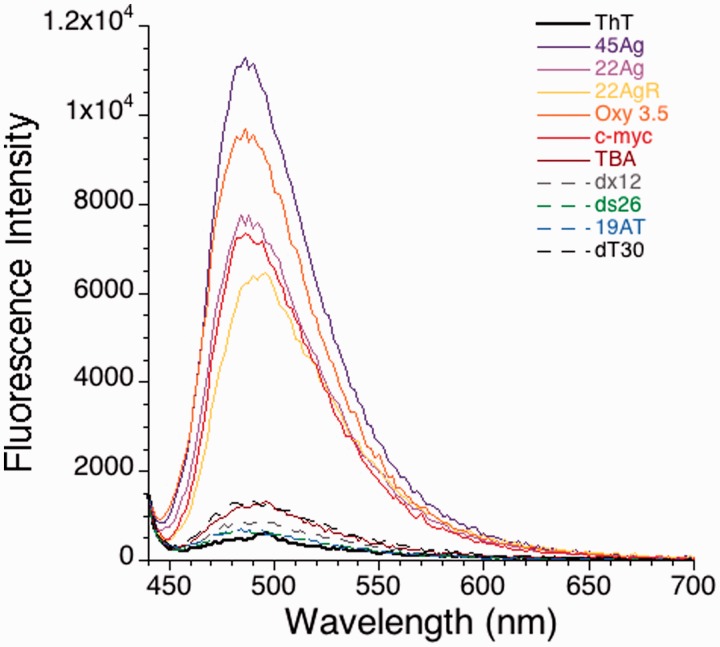
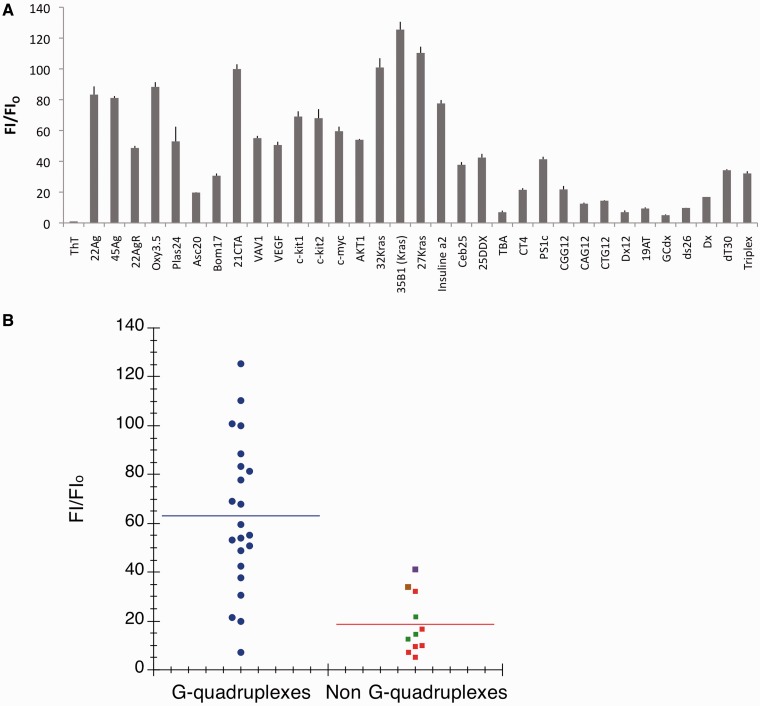
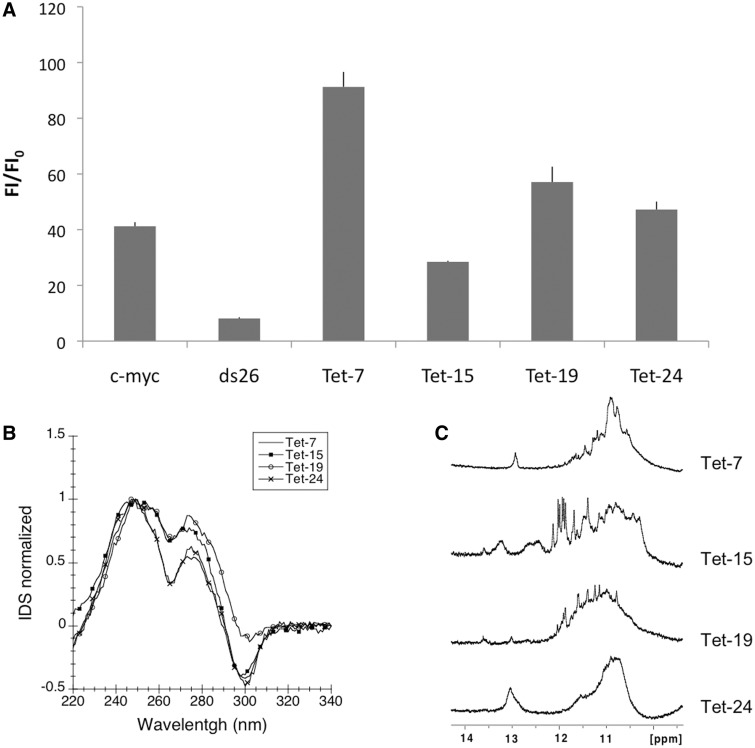
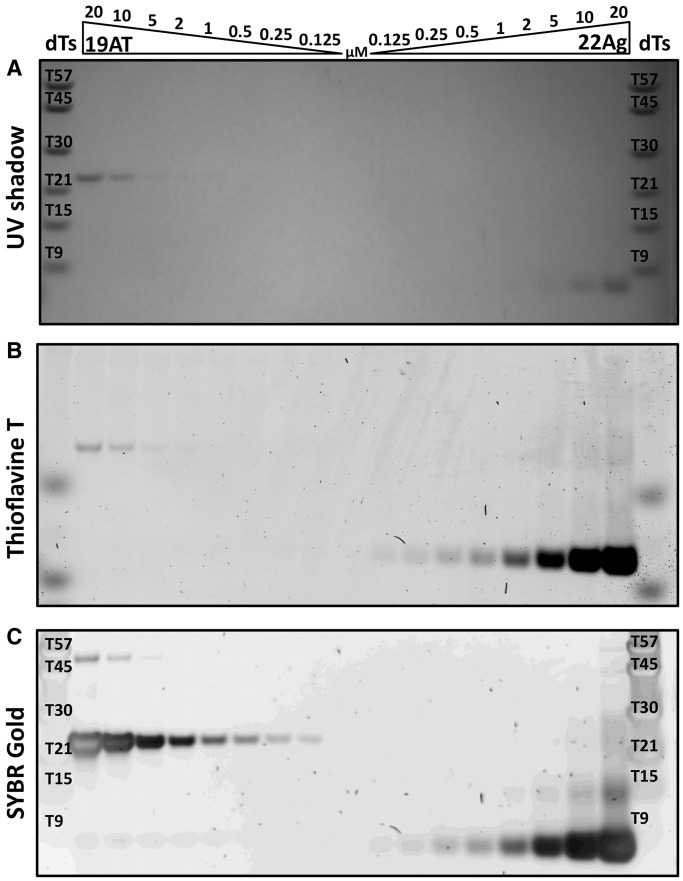
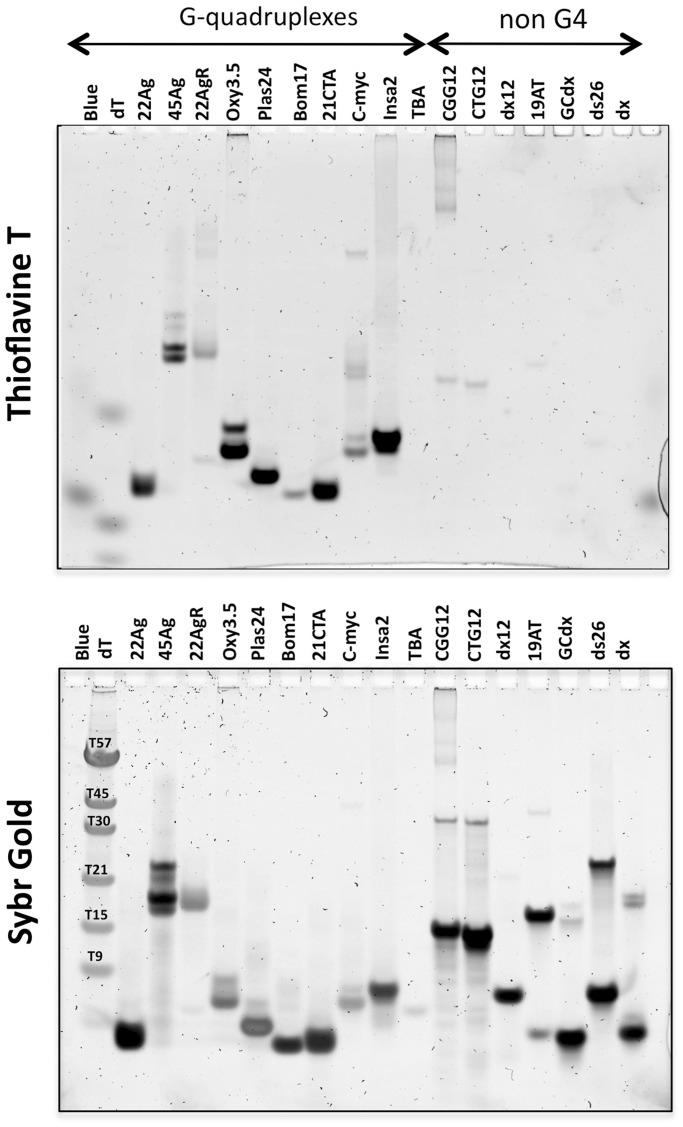
Thioflavin T (ThT) becomes fluorescent in the presence of the G-quadruplex structure such as that formed by the human telomeric motif. In this report, we extend and generalize these observations and show that this dye may be used as a convenient and specific quadruplex probe. In the presence of most, but not all, G4-forming sequences, we observed a large increase in ThT fluorescence emission, whereas the presence of control duplexes and single strands had a more limited effect on emission. This differential behavior allowed us to design a high-throughput assay to detect G4 formation. Hundreds of different oligonucleotides may be tested in parallel for G4 formation with a simple fluorescence plate reader. We applied this technique to a family of aptamers not previously recognized as G4-forming sequences and demonstrated that ThT fluorescence signal may be used to predict G4 formation.
Figures
Similar articles
-
Thioflavin T as a fluorescence light-up probe for both parallel and antiparallel G-quadruplexes of 29-mer thrombin binding aptamer.Anal Bioanal Chem. 2016 Nov;408(28):8025-8036. doi: 10.1007/s00216-016-9901-5. Epub 2016 Sep 2. Anal Bioanal Chem. 2016. PMID: 27590320
-
Selective recognition of parallel and anti-parallel thrombin-binding aptamer G-quadruplexes by different fluorescent dyes.Nucleic Acids Res. 2014 Oct;42(18):11612-21. doi: 10.1093/nar/gku833. Epub 2014 Sep 22. Nucleic Acids Res. 2014. PMID: 25245945 Free PMC article.
-
Thioflavin T as an efficient fluorescence sensor for selective recognition of RNA G-quadruplexes.Sci Rep. 2016 Apr 21;6:24793. doi: 10.1038/srep24793. Sci Rep. 2016. PMID: 27098781 Free PMC article.
-
Direct visualization of nucleolar G-quadruplexes in live cells by using a fluorescent light-up probe.Biochim Biophys Acta Gen Subj. 2018 May;1862(5):1101-1106. doi: 10.1016/j.bbagen.2018.01.022. Epub 2018 Feb 2. Biochim Biophys Acta Gen Subj. 2018. PMID: 29410183
-
Beyond amyloid proteins: Thioflavin T in nucleic acid recognition.Biochimie. 2021 Nov;190:111-123. doi: 10.1016/j.biochi.2021.06.003. Epub 2021 Jun 9. Biochimie. 2021. PMID: 34118329 Review.
Cited by
-
Human DDX21 binds and unwinds RNA guanine quadruplexes.Nucleic Acids Res. 2017 Jun 20;45(11):6656-6668. doi: 10.1093/nar/gkx380. Nucleic Acids Res. 2017. PMID: 28472472 Free PMC article.
-
Data on secondary structures and ligand interactions of G-rich oligonucleotides that defy the classical formula for G4 motifs.Data Brief. 2017 Feb 12;11:258-265. doi: 10.1016/j.dib.2017.02.023. eCollection 2017 Apr. Data Brief. 2017. PMID: 28243622 Free PMC article.
-
G-quadruplexes are promoter elements controlling nucleosome exclusion and RNA polymerase II pausing.Nat Genet. 2025 Aug;57(8):1981-1993. doi: 10.1038/s41588-025-02263-6. Epub 2025 Jul 22. Nat Genet. 2025. PMID: 40696173
-
The presence of a G-quadruplex prone sequence upstream of a minimal promoter increases transcriptional activity in the yeast Saccharomyces cerevisiae.Biosci Rep. 2023 Dec 20;43(12):BSR20231348. doi: 10.1042/BSR20231348. Biosci Rep. 2023. PMID: 38112096 Free PMC article.
-
A guanosine-based 2-formylphenylborate ester hydrogel with high selectivity to K+ ions.RSC Adv. 2020 Aug 3;10(48):28536-28540. doi: 10.1039/d0ra05254j. eCollection 2020 Aug 3. RSC Adv. 2020. PMID: 35520041 Free PMC article.
References
Publication types
MeSH terms
Substances
LinkOut - more resources
Full Text Sources
Other Literature Sources
