. 2015 Mar;67(2):311-30.
doi: 10.1007/s10616-013-9688-6. Epub 2014 Feb 8.

Alterations in dysadherin expression and F-actin reorganization: a possible mechanism of hypericin-mediated photodynamic therapy in colon adenocarcinoma cells

Affiliations

Alterations in dysadherin expression and F-actin reorganization: a possible mechanism of hypericin-mediated photodynamic therapy in colon adenocarcinoma cells

Aysun Kılıç Süloğlu et al. Cytotechnology. 2015 Mar.

Abstract

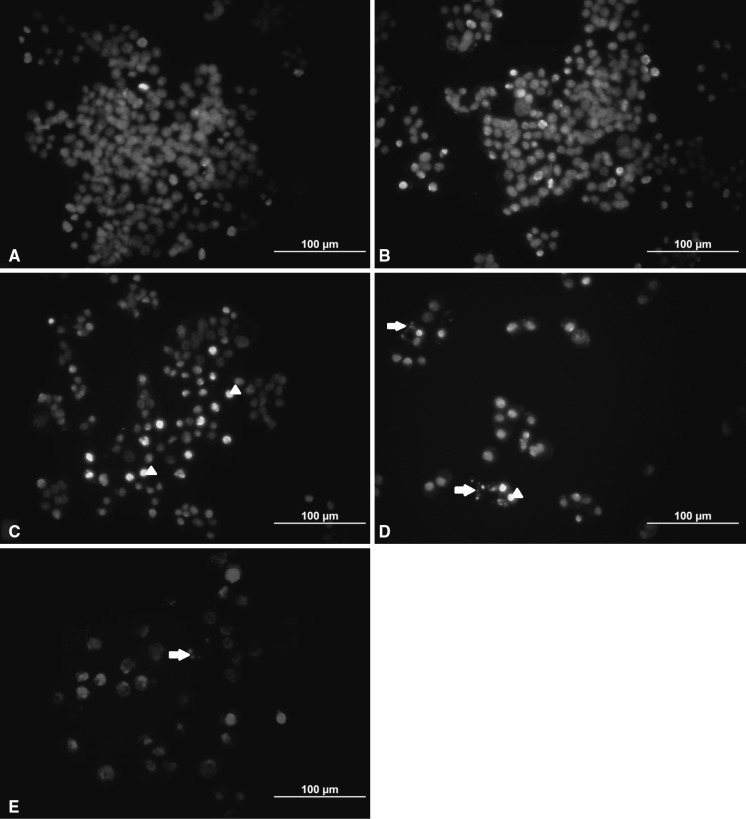
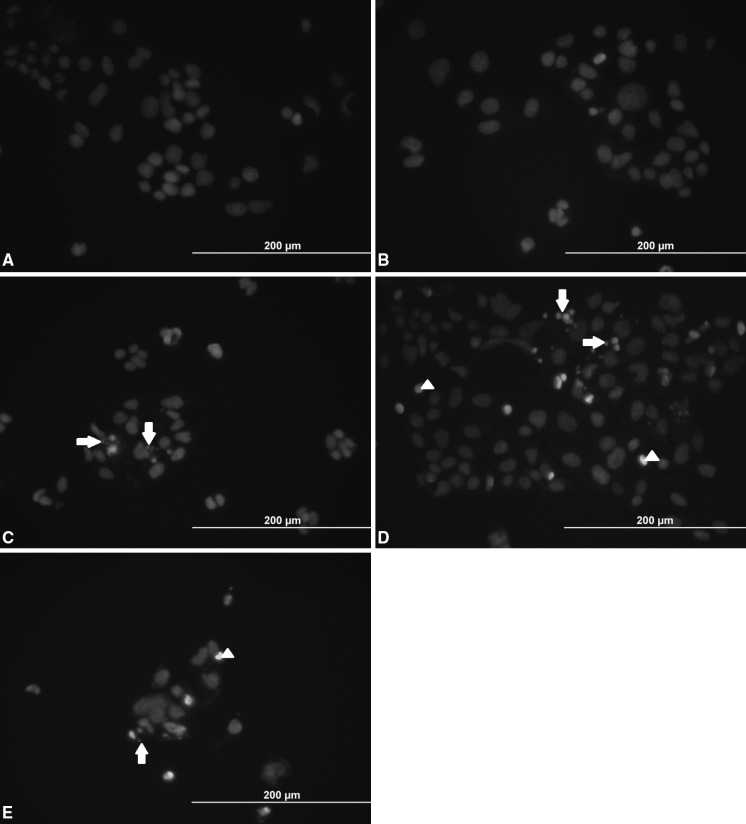
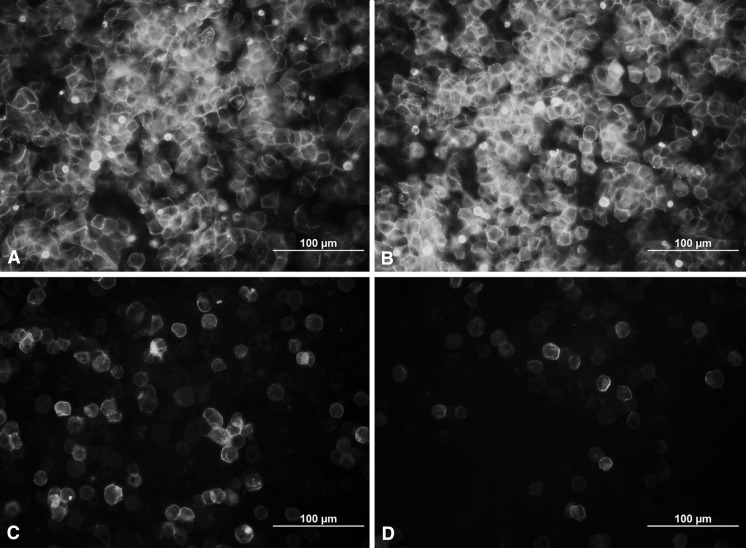
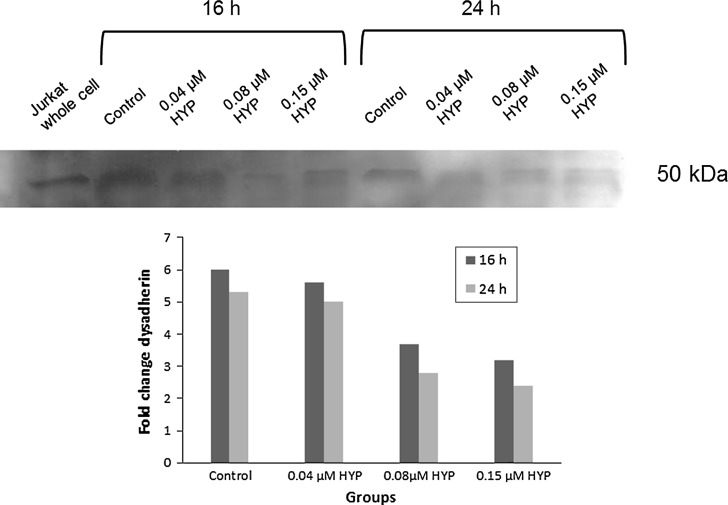
Dysadherin is a recently found anti-adhesion molecule, therefore detection and down regulation of its expression is promising in cancer treatment. The up-regulation of dysadherin contributes to colon cancer recurrence and metastasis. Dysadherin also has connections with cytoskeletal proteins and it can cause alterations in the organisation of filamentous actin (F-actin) in metastatic cancers. In this study, hypericin (HYP)-mediated photodynamic therapy (PDT) was performed in two different grade colon adenocarcinoma cell lines HT-29 (Grade I) and Caco-2 (Grade II). Cells were treated with 0.04, 0.08 or 0.15 μM HYP concentrations and irradiated with (4 J/cm(2)) fluorescent lamps. The effects of HYP was examined 16 and 24 h after the activation. We investigated for the first time the effect of HYP-mediated PDT on the expression of dysadherin and F-actin organisation. According to the results, HYP mediated PDT caused a decrease in gene expression and immunofluorescence staining of dysadherin and an increase in actin stress fibers and actin aggregates in HT-29 and Caco-2 cell lines. Besides, cytotoxicity, number of floating cells and apoptotic index changed depending on the cell type, HYP concentration and incubation time. We have demonstrated for the first time that dysadherin and F-actin could be target molecules for HYP-mediated PDT in HT-29 and Caco-2 colon cancer cell lines.


Figures

Scheme 1
Scheme 1
Experimental groups and PDT procedure
Fig. 1
Fig. 1
HYP photocytotoxicity (MTT test) in (A) HT-29 and (B) Caco-2 cells 16 and 24 h after PDT. The cells were treated with HYP (0.04, 0.08 and 0.15 μM HYP), irradiated with 4 J/cm2 and harvested 16 or 24 h after PDT. The results (mean ± SE) of three independent experiments are shown as % of the untreated control. a statistically significant from control group, b statistically significant from 0.04 μM HYP group (P ≤ 0.05)
Fig. 2
Fig. 2
0.04, 0.08, 0.15 μM HYP accumulation in HT-29 and Caco-2 cells measured with a flow cytometer 24 h after HYP-mediated PDT, expressed as the ratio of mean fluorescence intensity of treatment/control group. a statistically significant from control group, b statistically significant from 0.04 μM HYP group (P ≤ 0.05). c statistically significant from 0.08 μM HYP group (P ≤ 0.05)
Fig. 3
Fig. 3
Histograms of HYP fluorescence intensity using flow cytometer in HT-29 cells 24 h after PDT
Fig. 4
Fig. 4
Histograms of HYP fluorescence intensity using flow cytometer in Caco-2 cells 24 h after PDT
Fig. 5
Fig. 5
Apoptotic cell % of treatment groups compared to control group (apoptotic index) in (A) HT-29 and (B) Caco-2 cells is presented. The cells were treated with HYP (0.04, 0.08 and 0.15 μM HYP), irradiated with 4 J/cm2 and harvested 16 or 24 h after PDT. a statistically significant from control group (P ≤ 0.001), b statistically significant from 0.04 μM HYP group, c statistically significant from 0.08 μM HYP group (P ≤ 0.05)
Fig. 6
Fig. 6
HT-29 cells were incubated with different concentrations of HYP and 16 h after PDT HYP-induced apoptosis was determined by DAPI staining using fluorescence microscopy. Control group (A), DMSO (B), HYP treatment groups 0.04 μM (C), 0.08 μM (D) and 0.15 μM HYP (E). arrow head nuclear condensation, arrow nuclear fragmentation
Fig. 7
Fig. 7
HT-29 cells were incubated with different concentrations of HYP and 24 h after PDT HYP-induced apoptosis was determined by DAPI staining using fluorescence microscopy. Control group (A), DMSO (B), HYP treatment groups 0.04 μM (C), 0.08 μM (D) and 0.15 μM HYP (E). arrow head nuclear condensation, arrow nuclear fragmentation
Fig. 8
Fig. 8
Caco-2 cells were incubated with different concentrations of HYP and 16 h after PDT HYP-induced apoptosis was determined by DAPI staining using fluorescence microscopy. Control group (A), DMSO (B), HYP treatment groups 0.04 μM (C), 0.08 μM (D) and 0.15 μM HYP (E). arrow head nuclear condensation, arrow nuclear fragmentation
Fig. 9
Fig. 9
Caco-2 cells were incubated with different concentrations of HYP and 24 h after PDT HYP-induced apoptosis was determined by DAPI staining using fluorescence microscopy. Control group (A), DMSO (B), HYP treatment groups 0.04 μM (C), 0.08 μM (D) and 0.15 μM HYP (E). arrow head nuclear condensation, arrow nuclear fragmentation
Fig. 10
Fig. 10
Immunofluorescence staining of dysadherin (cell membrane, red color) in HT-29 cells 16 and 24 h after PDT. Magnification ×400. (Color figure online)
Fig. 11
Fig. 11
Immunofluorescence staining of dysadherin (cell membrane, red color) in Caco-2 cells 16 and 24 h after PDT. Magnification ×400. (Color figure online)
Fig. 12
Fig. 12
Immunofluorescence staining of F-actin (green) in HT-29 cells. The cells were untreated (A) or treated with HYP 0.04 μM (B), 0.08 μM (C) and 0.15 μM HYP (D), irradiated with 4 J/cm2 and harvested 16 h after PDT. arrow head actin aggregates, arrow actin stress fibers. (Color figure online)
Fig. 13
Fig. 13
Immunofluorescence staining of F-actin (green) in HT-29 cells. The cells were untreated (A) or treated with HYP 0.04 μM (B), 0.08 μM (C) and 0.15 μM HYP (D), irradiated with 4 J/cm2 and harvested 24 h after PDT. arrow head actin aggregates, arrow actin stress fibers. (Color figure online)
Fig. 14
Fig. 14
Immunofluorescence staining of F-actin (green) in Caco-2 cells. The cells were untreated (A) or treated with HYP 0.04 μM (B), 0.08 μM (C) and 0.15 μM HYP (D), irradiated with 4 J/cm2 and harvested 16 h after PDT. arrow head actin aggregates, arrow actin stress fibers. (Color figure online)
Fig. 15
Fig. 15
Immunofluorescence staining of F-actin (green) in Caco-2 cells. The cells were untreated (A) or treated with HYP 0.04 μM (B), 0.08 μM (C) and 0.15 μM HYP (D), irradiated with 4 J/cm2 and harvested 24 h after PDT. arrow head actin aggregates, arrow actin stress fibers. (Color figure online)
Fig. 16
Fig. 16
A RT-PCR products of dysadherin and cyclophilin A isolated from HT-29 and Caco-2 cell lines. The 201 bp band for dysadherin and 406 bp band for cyclophilin A (positive control) were identified after seperation of products in 2 % agarose gel and stained wirth EtBr. B Relative dysadherin expression (dysadherin/cyclophilin A) according to measured intensities of bands. a Statistically significant from control group (P ≤ 0.001), b statistically significant from 0.04 μM hypericin group, c statistically significant from 0.08 μM hypericin group (P ≤ 0.05)
Fig. 17
Fig. 17
Dysadherin expression was analysed by western blotting and densitometry in HT-29 cells 16 h and 24 h after PDT
Fig. 18
Fig. 18
Dysadherin expression was analysed by western blotting and densitometry in Caco-2 cells 16 and 24 h after PDT

Similar articles

Cited by

References

    1. Ackroyd R, Kelty C, Brown N, Reed M. The history of photodetection and photodynamic therapy. Photochem Photobiol. 2001;74:656–669. doi: 10.1562/0031-8655(2001)074<0656:THOPAP>2.0.CO;2. - DOI - PubMed
    1. Allison RR, Sibata CH. Oncologic photodynamic therapy photosensitizers: a clinical review. Photodiagnosis Photodyn. 2010;7:61–75. doi: 10.1016/j.pdpdt.2010.02.001. - DOI - PubMed
    1. Aoki S, Shimamura T, Shibata T, Nakanishi Y, Moriya Y, Sato Y, Kitajima M, Sakamoto M, Hirohashi S. Prognostic significance of dysadherin expression in advanced colorectal carcinoma. Br J Cancer. 2003;88:726–732. doi: 10.1038/sj.bjc.6600778. - DOI - PMC - PubMed
    1. Ashkenazi A. Targeting death and decoy receptors of the tumour-necrosis factor superfamily. Nat Rev Drug Discov. 2002;2:420–430. doi: 10.1038/nrc821. - DOI - PubMed
    1. Batistatou A, Charalabopoulos AK, Scopa CD, Nakanishi Y, Kappas A, Hirohashi S, Agnantis NJ, Charalabopoulos K. Expression patterns of dysadherin and E-cadherin in lymph node metastases of colorectal carcinoma. Virchows Arch. 2006;448:763–767. doi: 10.1007/s00428-006-0183-8. - DOI - PubMed

LinkOut - more resources