. 2013 Oct 18:79:6.13.1-6.13.19.
doi: 10.1002/0471142905.hg0613s79.

Genome-scale sequencing to identify genes involved in Mendelian disorders

Affiliations

Genome-scale sequencing to identify genes involved in Mendelian disorders

Thomas C Markello et al. Curr Protoc Hum Genet. .

Abstract

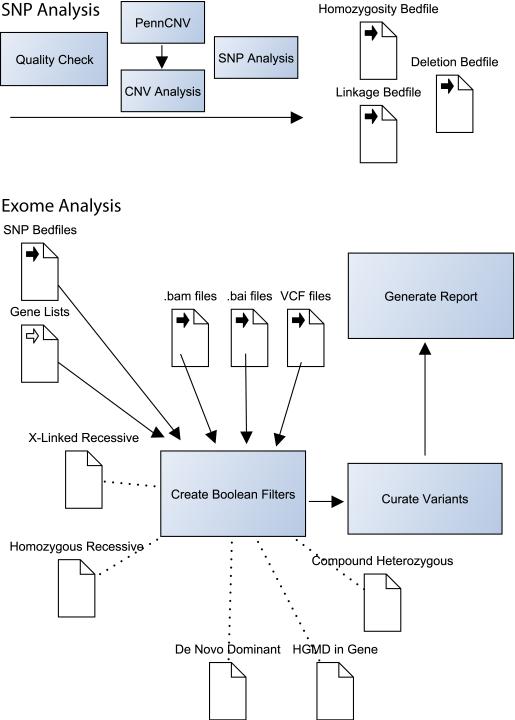
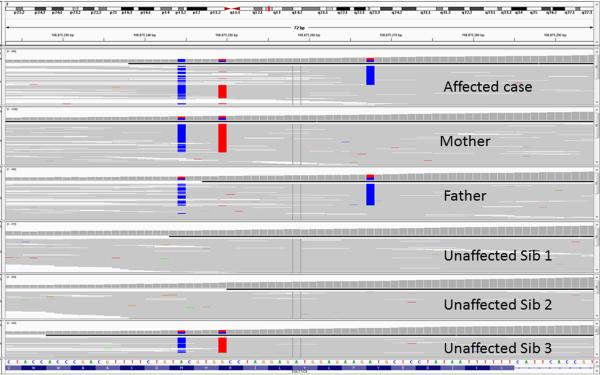
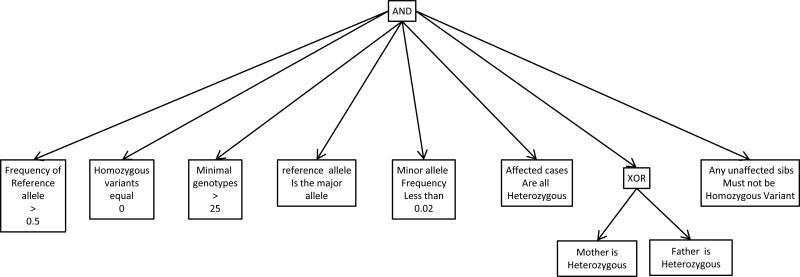
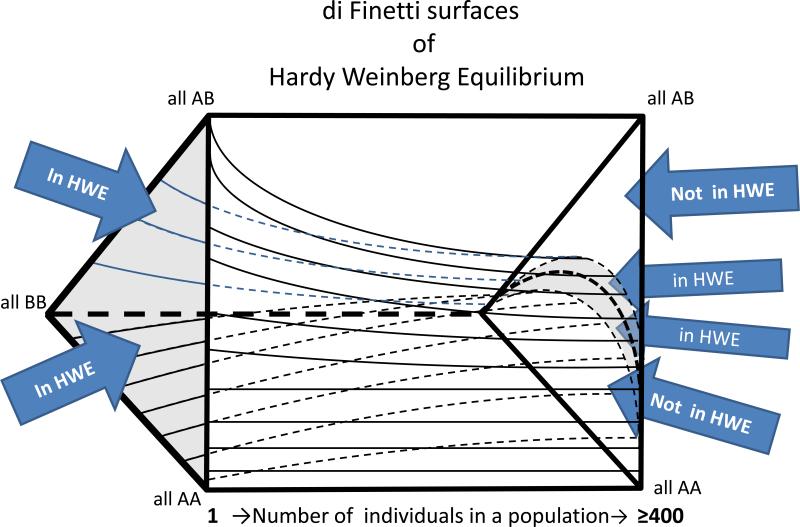
The analysis of genome-scale sequence data can be defined as the interrogation of a complete set of genetic instructions in a search for individual loci that produce or contribute to a pathological state. Bioinformatic analysis of sequence data requires sufficient discriminant power to find this needle in a haystack. Current approaches make choices about selectivity and specificity thresholds, and the quality, quantity, and completeness of the data in these analyses. There are many software tools available for individual, analytic component-tasks, including commercial and open-source options. Three major types of techniques have been included in most published exome projects to date: frequency/population genetic analysis, inheritance state consistency, and predictions of deleteriousness. The required infrastructure and use of each technique during analysis of genomic sequence data for clinical and research applications are discussed. Future developments will alter the strategies and sequence of using these tools and are also discussed.

Keywords: Mendelian inheritance; bioinformatics; clinical sequencing; exome; next generation sequencing.


Figures

Figure 1
Figure 1. Selected Components of the NIH UDP Analysis Pipeline
The NIH Undiagnosed Diseases Program analysis pipeline combines exome data with high-density SNP array data. We find that this is a cost-effective method for combining deep coverage of coding regions with a genome-spanning structural survey. SNP chips are checked for quality then analyzed for copy number variations (CNVs) with PennCNV (http://www.openbioinformatics.org/penncnv/). The list of CNVs is manually curated and combined with manual analysis for homozygosity and verification of parentage. If sufficient family members are available, Boolean searches and further manual curation are used to map recombination sites. CNVs, recombination sites and other regions of interest are defined in Browser Extensible Data (BED) file format for incorporation into later analysis. Subsequent exome analysis utilizes two primary programs: IGV and VarSifter (see text). The former is used to visualize pile-ups in the assembled BAM file and the second is used to incorporate BED file filters, allele frequency data, pathogenicity data and gene lists. VarSifter also allows the construction of arbitrary Boolean filters, providing fine control over searches for subsets of interest.
Figure 2
Figure 2. Integrated Genome Viewer Screenshot
The Integrated Genome Viewer (IGV, http://www.broadinstitute.org/igv/) is a lightweight yet powerful tool for viewing short read pile ups. The example show includes pileups from six individuals: two parents, one affected child and three unaffected children. For convenience, a case was selected that shows two variants that are physically close to one another (and fit on the same screen). At the top of the display is a diagram of the chromosome being reviewed, with a small vertical red bar (between q12.1 and q13) highlighting the region being displayed below. The bulk of the display is taken up by six rows of pile-up data. Each row is an individual; each short read is a thin, gray horizontal line. Base positions that have been genotyped as non-reference are highlighted blue or red. In this case, the mother is heterozygous for two DNA variants. The father is heterozygous for one of the same variants and also for one different variant. The fact that each parent's pair of variants is cis-oriented is knowable because there are short reads with both variants, and short reads with neither variant. The affected sibling has DNA variations on both alleles, in contrast to any of the unaffected siblings.
Figure 3
Figure 3. Boolean Filter for finding compound-heterozygote “half hets”
Boolean filtration can be used find variant subsets of interest within the called genotypes in a genome-scale sequencing data set. The schematic shown diagrams the criteria for all alleles to be one of two that can pair to fit a compound heterozygous recessive Mendelian model. After application of this filter, the resulting variant list is sorted by locus name. Variants of certain classes are prioritized, including those that result in stop, splice site, frame shift and non-synonymous amino acid changes. A normal number is about 300 to 900 total per exome. At any one locus there are at most a very small number of these types of variants, and typically there are only a very few loci with two or more. These must be inspected individually to see if there are two variants within loci that have more than one allele, to see if any pair are oppositely phased, one to each of the two parents. Pairs of variants that occur at the same loci, are of the type to change protein function, and are correctly phased (typically are no more than 0 to 5) constitute the compound heterozygous candidate variant pairs.
Figure 4
Figure 4. Di Finetti Diagram
A de Finetti diagram is used to graph genotype frequencies in populations. It presumes two alleles, and can be used to plot genotype frequencies at which Hardy-Weinberg Equilibrium (HWE) is satisfied. The figure shows a rectangular prism with surfaces plotted in its interior. The vertices of the triangles on the ends of the prism correspond to genotypes as shown: AA, AB and BB. The length of the prism is a scale of individuals in the population from 1 (far left) to ≥ 400 (far right). The area between the upper and lower internal plot surfaces define the combinations of genotypes that are consistent with HWE given a particular population size. As the population size increases, an increasingly small proportion of all of the possible genotype combinations are in HWE. However, difference between the in-HWE and out-of-HWE regions changes increasingly gradually as the population size reaches hundreds of individuals. For this reason, a data set of 100's of individuals allows stringent criteria to be used in assessing whether a set of genotypes is out of HWE—potentially due to misalignment.

References

    1. Abecasis GR, Auton A, Brooks LD, DePristo MA, Durbin RM, Handsaker RE, Kang HM, Marth GT, McVean GA. An integrated map of genetic variation from 1,092 human genomes. Nature. 2012;491:56–65. - PMC - PubMed
    1. Adzhubei IA, Schmidt S, Peshkin L, Ramensky VE, Gerasimova A, Bork P, Kondrashov AS, Sunyaev SR. A method and server for predicting damaging missense mutations. Nature methods. 2010;7:248–249. - PMC - PubMed
    1. Anonymous http://gvs.gs.washington.edu/SeattleSeqAnnotation/
    1. Anonymous . Online Mendelian Inheritance in Man, OMIM (TM) McKusick-Nathans Institute of Genetic Medicine, Johns Hopkins University; National Center for Biotechnology Information, National Library of Medicine; Baltimore, MD: Bethesda, MD:
    1. Blankenberg D, Von Kuster G, Coraor N, Ananda G, Lazarus R, Mangan M, Nekrutenko A, Taylor J. Galaxy: a web-based genome analysis tool for experimentalists. Current protocols in molecular biology / edited by Frederick M. Ausubel ... [et al.] 2010 Chapter 19:Unit 19 10 11-21. - PMC - PubMed

Publication types

LinkOut - more resources