. 2014 Mar 15;192(6):2551-63.
doi: 10.4049/jimmunol.1302884. Epub 2014 Feb 7.

Comprehensive immunophenotyping of cerebrospinal fluid cells in patients with neuroimmunological diseases

Affiliations

Comprehensive immunophenotyping of cerebrospinal fluid cells in patients with neuroimmunological diseases

Sungpil Han et al. J Immunol. .

Abstract

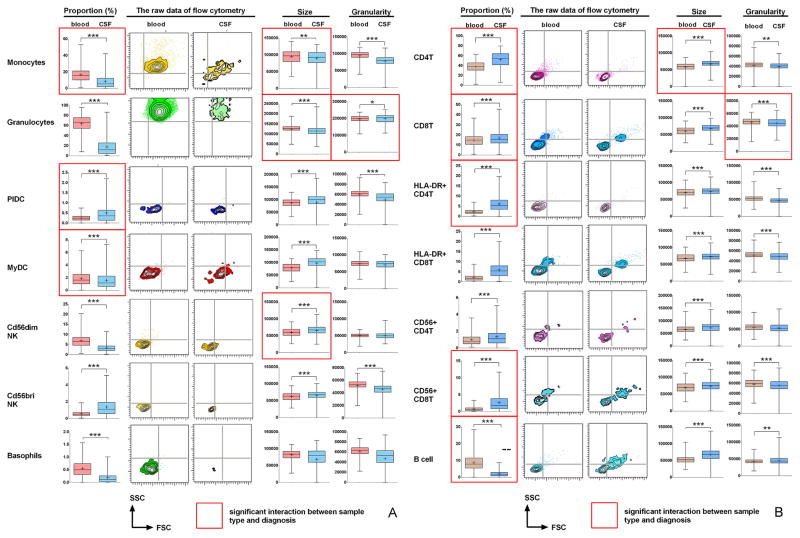
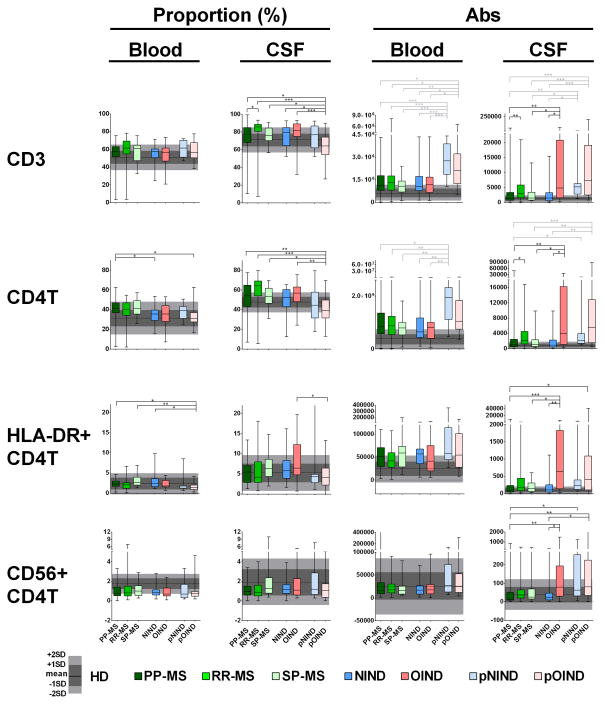
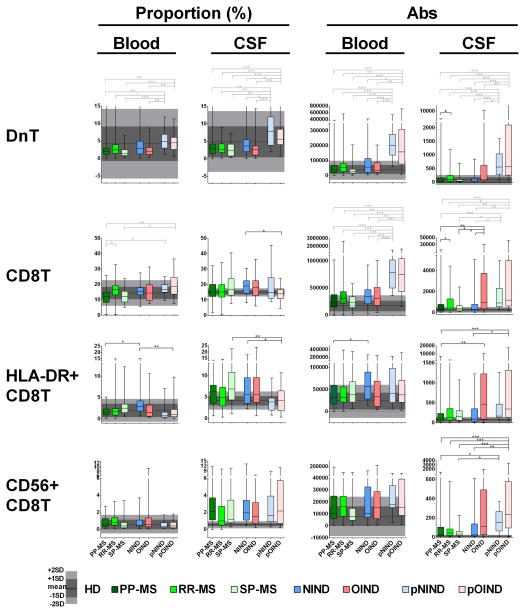
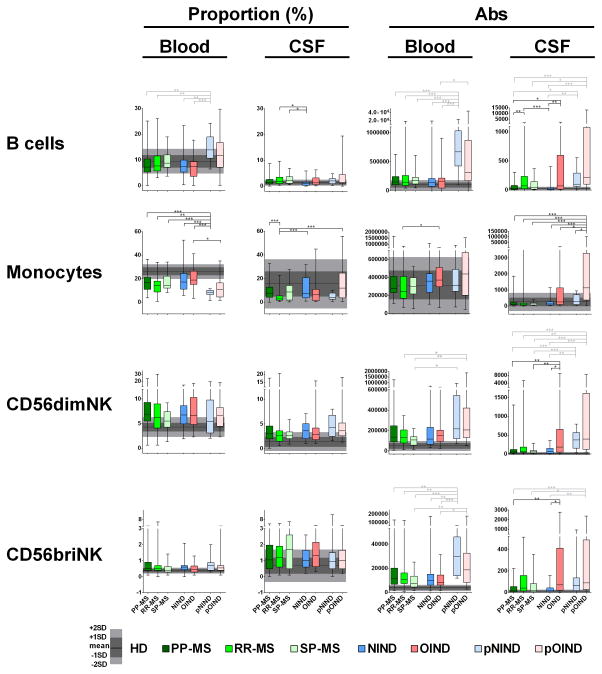
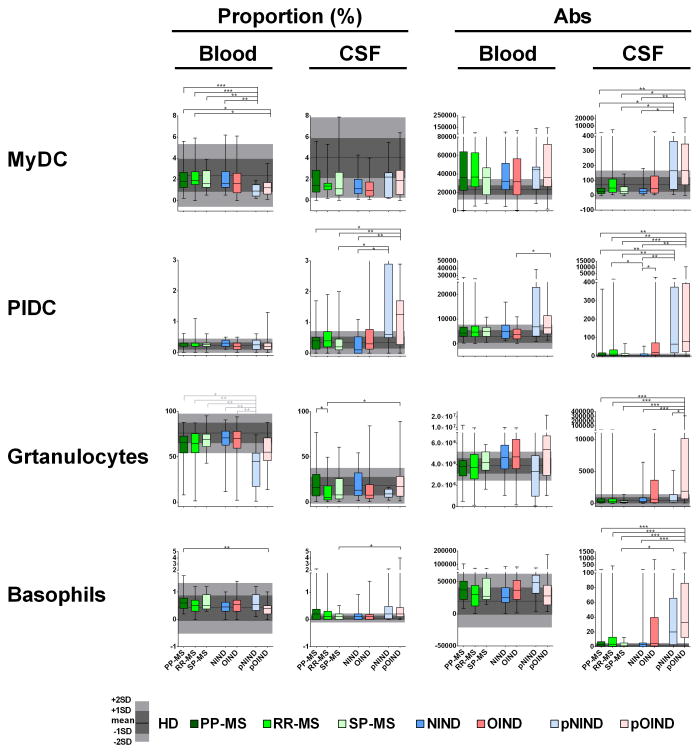
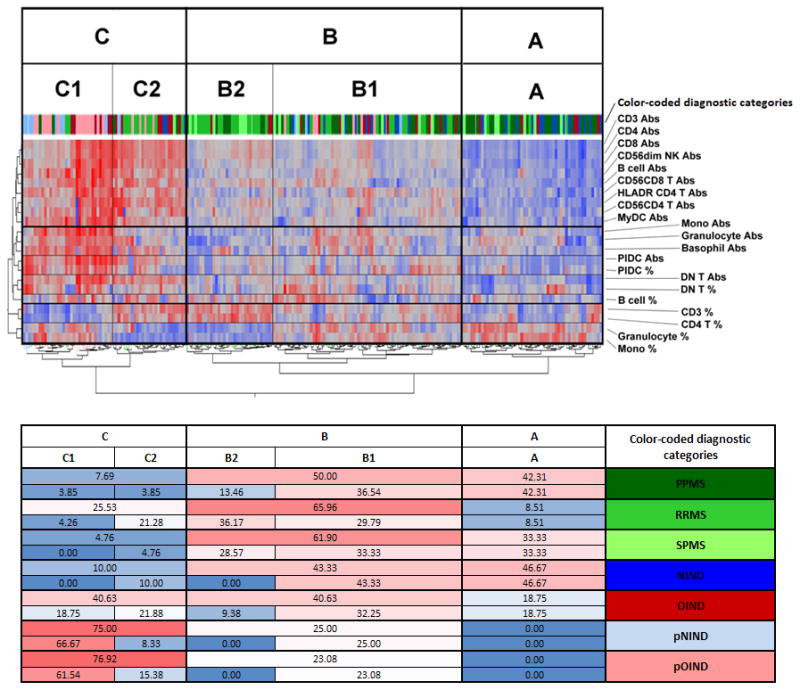
We performed unbiased, comprehensive immunophenotyping of cerebrospinal fluid (CSF) and blood leukocytes in 221 subjects referred for the diagnostic work-up of neuroimmunological disorders to obtain insight about disease-specific phenotypes of intrathecal immune responses. Quantification of 14 different immune cell subsets, coupled with the assessment of their activation status, revealed physiological differences between intrathecal and systemic immunity, irrespective of final diagnosis. Our data are consistent with a model where the CNS shapes intrathecal immune responses to provide effective protection against persistent viral infections, especially by memory T cells, plasmacytoid dendritic cells, and CD56(bright) NK cells. Our data also argue that CSF immune cells do not simply reflect cells recruited from the periphery. Instead, they represent a mixture of cells that are recruited from the blood, have been activated intrathecally and leave the CNS after performing effector functions. Diagnosis-specific differences provide mechanistic insight into the disease process in the defined subtypes of multiple sclerosis (MS), neonatal onset multisystem inflammatory disease, and Aicardi-Goutières syndrome. This analysis also determined that secondary-progressive MS patients are immunologically closer to relapsing-remitting patients as compared with patients with primary-progressive MS. Because CSF immunophenotyping captures the biology of the intrathecal inflammatory processes, it has the potential to guide optimal selection of immunomodulatory therapies in individual patients and monitor their efficacy. Our study adds to the increasing number of publications that demonstrate poor correlation between systemic and intrathecal inflammatory biomarkers in patients with neuroimmunological diseases and stresses the importance of studying immune responses directly in the intrathecal compartment.


Figures

Figure 1
Figure 1. The differences between the blood and CSF samples in the proportion and activation status of immune cells for all patients
(a) Differences in the cells of the innate immune system: monocytes, granulocytes, plasmacytoid DCs (PlDC), myeloid DCs (MyDC), CD56dim and CD56bright NK cells and basophils. (b) Differences in the cells belonging to adaptive immune system: CD4+ and CD8+ T cells and their subsets (HLA-DR+ effector cells and CD56+ cytotoxic cells) and CD19+ B cells. Left panels in each row demonstrate differences in the proportions of specified cell population among all CD45+ leukocytes between blood (red) and CSF (blue). Next two panels in each row show representative raw FACS images of the size (forward scatter; FSC on x axis) and granularity (side scatter; SSC on y axis) for specified cell population from MS patient. The right 2 panels in each row represent group comparisons between blood and CSF of the size and granularity for specified subpopulation of immune cells. Statistically significant differences are depicted as follows: *: P<0.05, **: 0.001<P<0.05, ***: P<0.001. Mean values are shown ± SD. Red edge highlights those markers for which statistical interaction was identified between sample type and diagnosis. For these markers the diagnosis – specific plots can be found in Supplementary Figures 2a and 2b.
Figure 2
Figure 2. Differences in the proportions and absolute numbers of immune cells among diagnostic categories: CD3 T cells, CD4+ T cells and their subtypes
Two left panels in each row represent proportions of specific cell populations in blood and CSF, while two right panels represent absolute numbers of the same cell population in the blood and CSF. Each diagnostic category is represented by one vertical box blot, while data from healthy donors (HD) are depicted as grey shading, with horizontal line representing mean, dark shade of grey representing +/− 1SD and lighter shade of grey representing +/− 2SD of HD cohort. Each box plot shows median, 25–75%-tile and whisker blots represent minimum-maximum-tile for each diagnostic category. *: P<0.05, **: 0.001<P<0.05, ***: P<0.001.
Figure 3
Figure 3. Differences in the proportions and absolute numbers of immune cells among diagnostic categories: double negative T cells, CD8+ T cells and their subtypes
Two left panels in each row represent proportions of specific cell populations in blood and CSF, while two right panels represent absolute numbers of the same cell population in the blood and CSF. Each diagnostic category is represented by one vertical box blot, while data from healthy donors (HD) are depicted as grey shading, with horizontal line representing mean, dark shade of grey representing +/− 1SD and lighter shade of grey representing +/− 2SD of HD cohort. Each box plot shows median, 25–75%-tile and whisker blots represent minimum-maximum-tile for each diagnostic category. *: P<0.05, **: 0.001<P<0.05, ***: P<0.001.
Figure 4
Figure 4. Differences in the proportions and absolute numbers of immune cells among diagnostic categories: B cells, Monocytes and NK cell
Two left panels in each row represent proportions of specific cell populations in blood and CSF, while two right panels represent absolute numbers of the same cell population in the blood and CSF. Each diagnostic category is represented by one vertical box blot, while data from healthy donors (HD) are depicted as grey shading, with horizontal line representing mean, dark shade of grey representing +/− 1SD and lighter shade of grey representing +/− 2SD of HD cohort. Each box plot shows median, 25–75%-tile and whisker blots represent minimum-maximum-tile for each diagnostic category. *: P<0.05, **: 0.001<P<0.05, ***: P<0.001.
Figure 5
Figure 5. Differences in the proportions and absolute numbers of immune cells among diagnostic categories: Myeloid (MyDC) and plasmacytoid dendritic cell (PlDC), granulocytes and basophils
Two left panels in each row represent proportions of specific cell populations in blood and CSF, while two right panels represent absolute numbers of the same cell population in the blood and CSF. Each diagnostic category is represented by one vertical box blot, while data from healthy donors (HD) are depicted as grey shading, with horizontal line representing mean, dark shade of grey representing +/− 1SD and lighter shade of grey representing +/− 2SD of HD cohort. Each box plot shows median, 25–75%-tile and whisker blots represent minimum-maximum-tile for each diagnostic category. *: P<0.05, **: 0.001<P<0.05, ***: P<0.001.
Figure 6
Figure 6. Unsupervised clustering of diagnostic codes based on CSF immunophenotyping data
A two-way, unsupervised hierarchical clustering dendrogram of subjects and biomarkers based on selection of CSF immunophenotyping markers that were discriminatory in subgroup analyses. Red: relatively high expression; blue: relatively low expression. The proportions of patients from different diagnostic categories that are classified to distinct clustering subgroups are outlined below the dendrogram. Color-coded diagnostic categories are identical for both panels.

References

    1. Lucchinetti CF, Bruck W, Rodriguez M, Lassmann H. Distinct patterns of multiple sclerosis pathology indicates heterogeneity on pathogenesis. Brain Pathol. 1996;6:259–274. - PMC - PubMed
    1. Miller DH, Leary SM. Primary-progressive multiple sclerosis. Lancet neurology. 2007;6:903–912. - PubMed
    1. Mahad D, Lassmann H, Turnbull D. Review: Mitochondria and disease progression in multiple sclerosis. Neuropathol Appl Neurobiol. 2008;34:577–589. - PMC - PubMed
    1. Sastre-Garriga J, Ingle GT, Chard DT, Cercignani M, Ramio-Torrenta L, Miller DH, Thompson AJ. Grey and white matter volume changes in early primary progressive multiple sclerosis: a longitudinal study. Brain. 2005;128:1454–1460. - PubMed
    1. Lucchinetti C, Bruck W. The pathology of primary progressive multiple sclerosis. Mult Scler. 2004;10(Suppl 1):S23–30. - PubMed

Publication types

MeSH terms

Supplementary concepts