. 2014 Jun;25(6):1171-86.
doi: 10.1681/ASN.2013040433. Epub 2014 Feb 7.

Thrombospondin-1 activation of signal-regulatory protein-α stimulates reactive oxygen species production and promotes renal ischemia reperfusion injury

Affiliations

Thrombospondin-1 activation of signal-regulatory protein-α stimulates reactive oxygen species production and promotes renal ischemia reperfusion injury

Mingyi Yao et al. J Am Soc Nephrol. 2014 Jun.

Erratum in

  • J Am Soc Nephrol. 2014 Aug;25(8):1884

Abstract

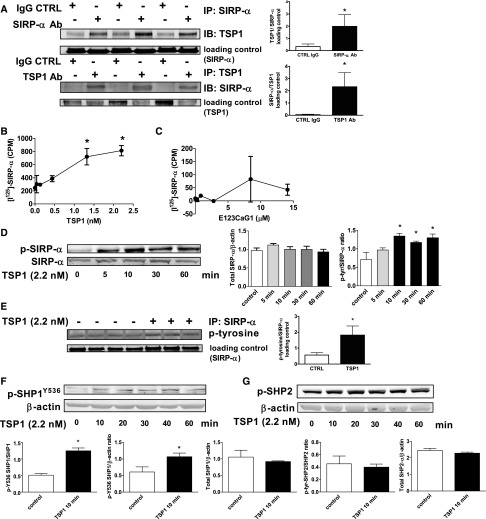
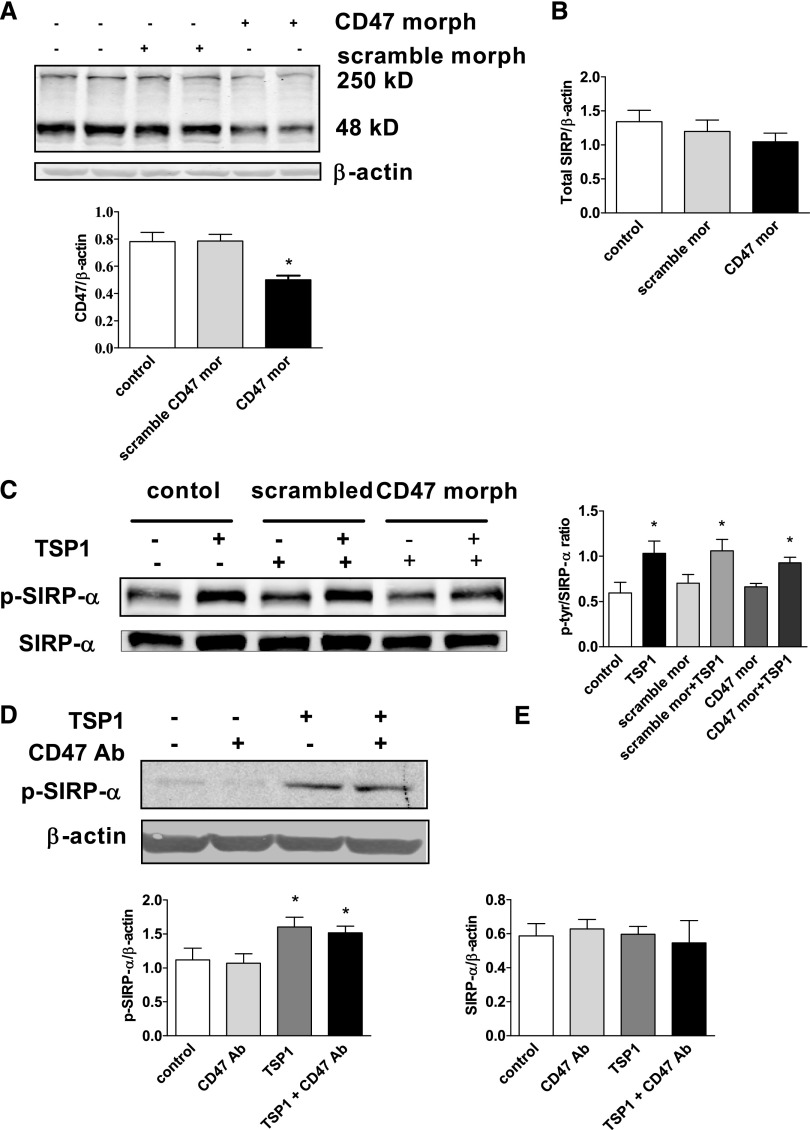
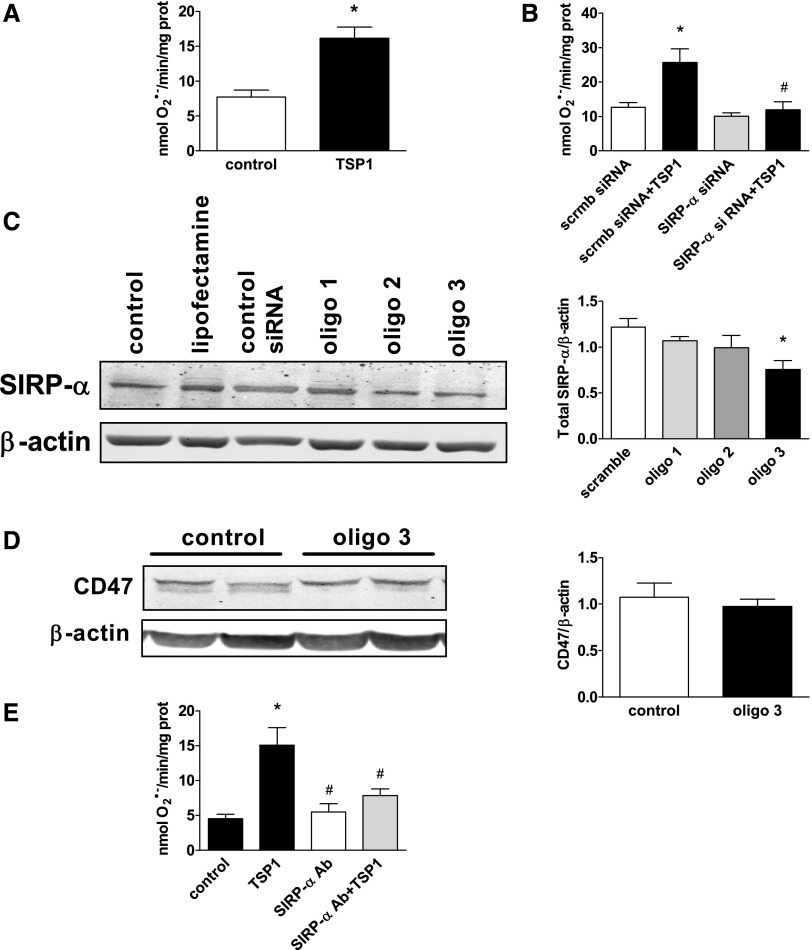
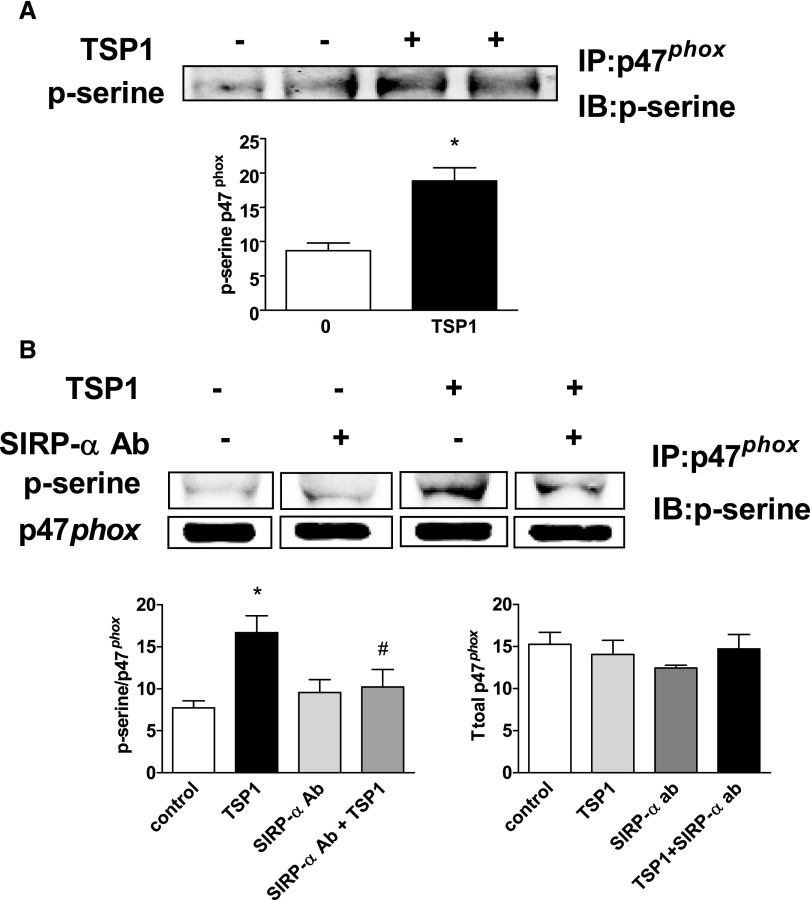
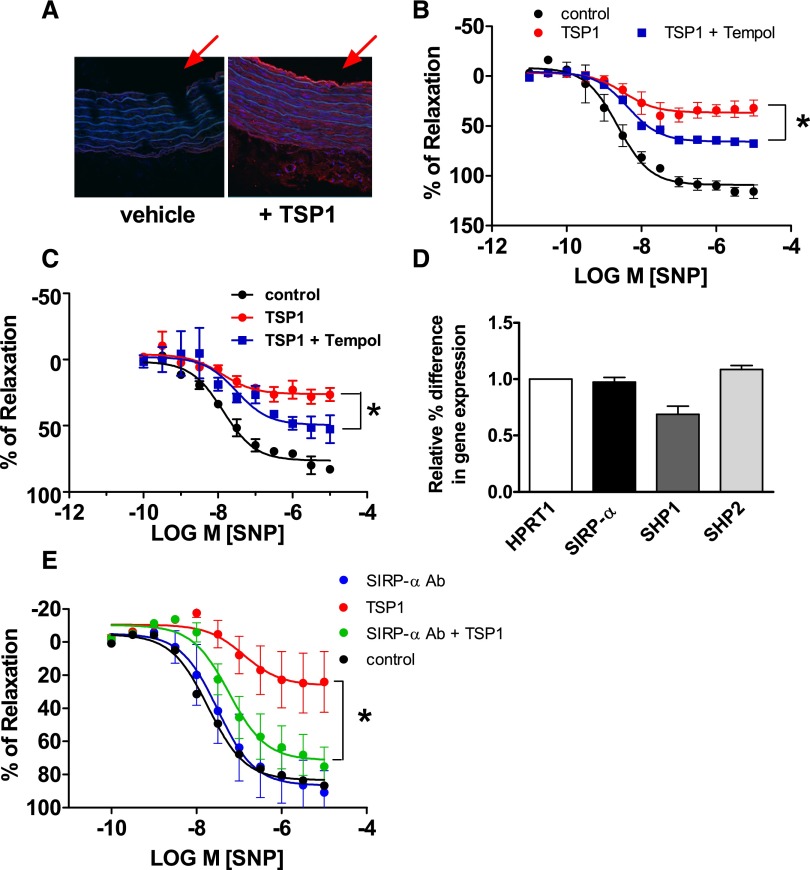
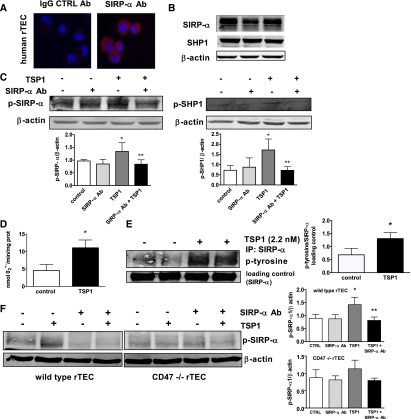
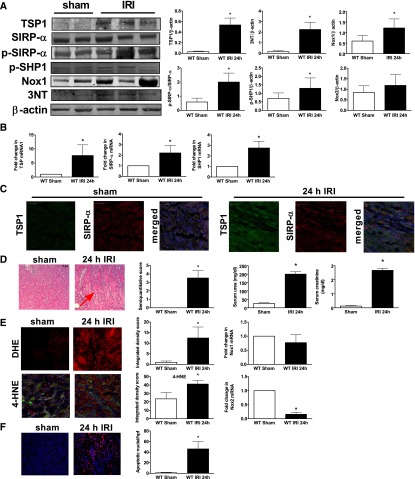
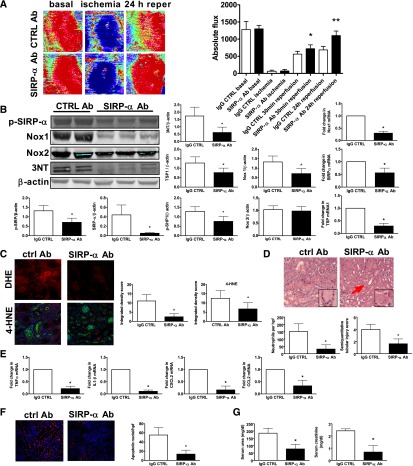
Ischemia reperfusion injury (IRI) causes tissue and organ injury, in part, through alterations in tissue blood flow and the production of reactive oxygen species. The cell surface receptor signal-regulatory protein-α (SIRP-α) is expressed on inflammatory cells and suppresses phagocytosis, but the function of SIRP-α in IRI has not been determined. We reported previously that the matricellular protein thrombospondin-1 is upregulated in IRI. Here, we report a novel interaction between thrombospondin-1 and SIRP-α on nonphagocytic cells. In cell-free experiments, thrombospondin-1 bound SIRP-α. In vascular smooth muscle cells and renal tubular epithelial cells, treatment with thrombospondin-1 led to phosphorylation of SIRP-α and downstream activation of Src homology domain 2-containing phosphatase-1. Thrombospondin-1 also stimulated phosphorylation of p47(phox) (an organizer subunit for nicotinamide adenine dinucleotide phosphate (NADPH) oxidase 1/2) and increased production of superoxide, both of which were abrogated by knockdown or antibody blockade of SIRP-α. In rodent aortic rings, treatment with thrombospondin-1 increased the production of superoxide and inhibited nitric oxide-mediated vasodilation in a SIRP-α-dependent manner. Renal IRI upregulated the thrombospondin-1-SIRP-α signaling axis and was associated with increased superoxide production and cell death. A SIRP-α antibody that blocks thrombospondin-1 activation of SIRP-α mitigated the effects of renal IRI, increasing blood flow, suppressing production of reactive oxygen species, and preserving cellular architecture. A role for CD47 in SIRP-α activation in these pathways is also described. Overall, these results suggest that thrombospondin-1 binding to SIRP-α on nonphagocytic cells activates NADPH oxidase, limits vasodilation, and promotes renal IRI.


Figures

Figure 1.
Figure 1.
TSP1 binds to and activates nonphagocytic SIRP-α and its downstream signal transducer SHP1. (A) Coimmunoprecipitation in arterial VSMCs of TSP1 and SIRP-α. Immunoprecipitation was with monoclonal Ab to TSP1, SIRP-α, or an isotype-matched control IgG antibody. Results presented are representative of six separate experiments. Plastic wells coated with TSP1 (B) or the recombinant domain of TSP1 containing the C-terminal (E123CaG1, C) at the indicated concentrations were incubated with 125I-SIRP-α at room temperature. Bound radioactivity was quantified and data are presented as the mean±SEM. of three separate experiments. VSMCs were incubated in basal medium with TSP1 (2.2 nmol/L) for the indicated time points, cell lysate prepared, protein separated by SDS-PAGE electrophoresis, membranes probed with a phospho-tyrosine antibody (D) or lysates immunoprecipitated with a SIRP-α Ab, protein separated via SDS-PAGE electrophoresis, and nitrocellulose membranes probed with Ab to total SIRP-α and to phosphorylated tyrosine residues (E), as well as phosphorylated SHP1 (Y536) (F) and p-SHP2 (G). Densitometry is presented as mean ratios of p-tyr-SIRP-α to total SIRP-α and total SIRP-α to β actin (±SEM) (D), p-SHP1 to total SHP1, p-SHP1 to β actin, and total SHP1 to β actin (±SEM) (F), and p-SHP2 to total SHP2 and total SHP2 to β actin (±SEM) (G). Representative data from four independent experiments are presented. *Statistically significant difference (P<0.05 compared with untreated).
Figure 2.
Figure 2.
TSP1-stimulated phosphorylation of VSMC SIRP-α may not depend completely on CD47 activation. (A) VSMCs were treated with a CD47-specific (10 μM) or scrambled oligonucleotide morpholino as per the manufacturer instructions. Western blot analysis of CD47 was performed. Densitometry is presented as the mean ratio of CD47 to β actin (±SEM). (B) Densitometry of Western blots from untreated (control), scrambled, and CD47 morpholino treated VSMC is presented as the mean ratio of total SIRP-α to β actin (±SEM). (C) VSMCs were pretreated with a CD47-specific or scrambled morpholino, then incubated in basal medium with TSP1 (2.2 nmol/L) for 10 minutes, lysate prepared and Western blots performed. Densitometry is presented as the mean ratio of p-SIRP-α to SIRP-α (±SEM). (D) VSMCs were incubated in basal medium, treated with a CD47-blocking Ab (1 μg/ml) for 20 minutes followed by TSP1 (2.2 nmol/L) for 10 minutes and cell lysate prepared. Western blot analysis of p-SIRP-α was performed. Densitometry is presented as the mean ratio of p-SIRP-α to β actin (±SEM). (E) Densitometry of Western blots from CD47 Ab and TSP1-treated VSMCs is presented as the mean ratio of total SIRP-α to β actin (±SEM). For all measurements: *statistically significant difference (P<0.05) compared with untreated and control morpholino-treated, and representative examples of four independent experiments are presented.
Figure 3.
Figure 3.
TSP1-stimulated O2·− production in VSMCs requires SIRP-α. (A) VSMCs were incubated with vehicle or TSP1 (2.2 nmol/L) for 60 minutes. Superoxide production was measured in the 28,000g membrane fraction and calculated from the initial linear rate of superoxide dismutase–inhibitable cytochrome c reduction. Data represent the rate of superoxide production (±SEM). *Statistically significant difference (P<0.05) compared with untreated. (B) VSMCs were transfected with SIRP-α siRNA (oligo 3) or a control scrambled (scrmb) siRNA and incubated with TSP1 (2.2 nmol/L) for 60 minutes. Superoxide production was measured as described above. Data represent the rate of superoxide production (±SEM). *Statistically significant difference (P<0.05) compared with scrmb; #statistically significant difference (P<0.05) compared with scrmb siRNA+TSP1. (C) VSMCs were transfected with several SIRP-α or scrambled (scrmb) siRNA oligos. Western blot analysis was performed for SIRP-α. A representative blot from three separate experiments is presented. Densitometry is presented as the mean ratio of total SIRP-α to β actin (±SEM). *Statistically significant difference (P<0.05) compared with scrambled control. (D) VSMCs were transfected with SIRP-α (oligo 3) or control scrambled siRNA. Western blot analysis was performed for CD47. Densitometry is presented as the mean ratio of total CD47 to β actin (±SEM) from three experiments. (E) VSMCs were treated with a SIRP-α–blocking Ab (1 μg/ml) for 10 minutes, followed by TSP1 (2.2 nmol/L) for 60 minutes. Superoxide production was measured. Data represent the rate of superoxide production (±SEM). *Statistically significant difference (P<0.05) compared with untreated control; #statistically significant difference (P<0.05) compared with TSP1 treated.
Figure 4.
Figure 4.
TSP1, via SIRP-α, phosphorylates the Nox1/2 organizer subunit p47phox. (A) VSMCs were treated in minimal medium with TSP1 (2.2 nmol/L) for 60 minutes or (B) a SIRP-α–blocking Ab (1 μg/ml) for 10 minutes with or without TSP1 (2.2 nmol/L) for 60 minutes, cell lysates prepared, immunoprecipitated with a p47phox Ab, resolved via gel electrophoresis, and blots probed with a phospho-serine Ab. A representative blot from four separate experiments is presented. Densitometry is presented as the mean ratio of total p-serine to p47phox (±SEM). *Statistically significant difference (P<0.05) compared with untreated control; #statistically significant difference (P<0.05) compared with TSP1 treated. Densitometry of Western blot of total p47phox expression from indicated treated cell groups not significantly different from control.
Figure 5.
Figure 5.
TSP1, via SIRP-α, stimulates VSMC O2·− production and inhibits vasodilation. (A) Murine aortic segments were freshly harvested from wild-type male C57BL/6 mice, incubated in standard myograph buffer with TSP1 (2.2 nmol/L, 60 minutes), and tissue sections prepared for immunofluorescence. Representative images of three independent experiments are presented. TSP1 appears red. The red arrows highlight the vessel lumen. Murine (B) and rat (C) aortic rings were prepared from freshly harvested thoracic aortas. The endothelium was removed and the resulting arterial rings were incubated with vehicle, TSP1 (2.2 nmol/L, 60 minutes), or TSP1+Tempol (30 μM) and constricted with phenylephrine (3×10⁻⁷ M). Endothelium-independent vasodilation was stimulated by SNP (10−9 to 10−5 M). Data represent the means±SEM of four experiments. *Statistically significant difference (P<0.05) in relaxation between TSP1 versus TSP1 + Tempol. (D) RT-PCR assessment of SIRP-α, SHP1, and SHP2 mRNA of murine thoracic aorta. Data were normalized to the housekeeping gene HPRT1 and represent the means±SEM of five separate samples. (E) Murine thoracic aortas were harvested and endothelial-free arterial rings were incubated with vehicle, TSP1 (2.2 nmol/L, 60 minutes), or TSP1+a SIRP-α–blocking Ab (1 μg/ml) and constricted with phenylephrine (3×10⁻⁷ M). Endothelium-independent vasodilation was stimulated by SNP (10−9 to 10−5 M). Data represent the means±SEM of four experiments. *Statistically significant difference (P<0.05) in relaxation between TSP1 versus TSP1+SIRP-α Ab.
Figure 6.
Figure 6.
TSP1 stimulates SIRP-α phosphorylation and O2·− production in human rTECs. (A) Human rTECs were stained for SIRP-α (red) and nuclear protein (blue). Representative images are presented at a magnification of ×20. (B) Human rTECs were cultured in basal medium, lysate prepared and analyzed for total SIRP-α and SHP1 protein expression. A representative blot from three separate experiments is presented. (C) Human rTECs were incubated with vehicle or TSP1 (2.2 nmol/L) with or without a SIRP-α Ab (1 μg/ml) for 60 minutes, and protein expression of p-SIRP-α and p-SHP1 was determined. Data represent the mean ratios of target protein to β actin (±SEM). *Statistically significant difference (P<0.05) compared with untreated. **Statistically significant difference (P<0.05) compared with TSP1 treated. (D) Human rTECs in minimal medium were treated with TSP1 (2.2 nmol/L) for 45 minutes and O2·− production measured as described previously. Data represent the rate of superoxide production (±SEM). *Statistically significant difference (P<0.05) compared with untreated. (E) Human rTECs were incubated in basal medium with TSP1 (2.2 nmol/L), cell lysate prepared and immunoprecipitated with a SIRP-α Ab, protein separated via SDS-PAGE electrophoresis, and nitrocellulose membranes probed with Ab to total SIRP-α and to phosphorylated tyrosine residues. A representative blot from three separate experiments is presented. Data represent the mean ratios of target protein to SIRP-α (± SEM). *Statistically significant difference (P<0.05) compared with untreated (control). (F) Wild-type and CD47 null murine rTECs were treated with TSP1 (2.2 nmol/L) with or without a SIRP-α Ab (1 μg/ml) for 60 minutes and protein expression of p-SIRP-α determined. A representative blot from three separate experiments is shown. Data are presented as the mean ratio of target protein to β actin (±SEM). *Statistically significant difference (P<0.05) compared with untreated (control). **Statistically significant difference (P<0.05) compared with TSP1 treated.
Figure 7.
Figure 7.
TSP1-SIRP-α signaling is upregulated in renal IRI concurrent with increased ROS production, decreased blood flow, and increased tissue injury. Male C57BL/6 mice were challenged with 20 minutes of unilateral renal ischemia and 24 hours of reperfusion (n=8) or sham surgery (n=6) and Western blot for (A) TSP1, SIRP-α, p-SIRP-α, p-SHP1, Nox1, Nox2, 3-nitrotyrosine, and β actin was performed. Data shown are mean±SEM. *Statistically significant (P<0.001) IRI compared with sham-operated kidneys. (B) RT-PCR analysis of renal mRNA expression of the indicated genes in IRI and sham-operated kidneys. Data shown are mean±SEM. *Statistically significant (P<0.05) IRI compared with sham. (C) Representative kidney tissue sections from IRI and sham-operated mice stained for TSP1 and SIRP-α. TSP1 colored green; SIRP-α colored red; nuclei colored blue. Scale bar, 50 μm (magnification ×20). (D) Quantitative analysis and photomicrographs of tubular damage and neutrophil invasion in juxtamedullalary sections from IRI and sham-operated mice are shown (magnification, ×200; arrow highlights tubular injury); serum urea and creatinine from the same. Data shown are means ± SEM. *Statistically significant (P<0.05) IRI compared with sham. (E) Representative tissue sections and quantitative analysis from IRI and sham-operated mice stained with DHE or 4-HNE and visualized by microscopy (magnification, ×200). RT-PCR analysis of Nox1 and Nox2 mRNA from sham and post-IRI kidneys. Data shown are means±SEM. *Statistically significant (P<0.05) IRI compared with sham. (F) Representative tissue sections and quantitative analysis from IRI and sham-operated mice stained by TUNEL assay and visualized by microscopy (magnification, ×200). *Statistically significant (P<0.05) IRI compared with sham.
Figure 8.
Figure 8.
Disrupting TSP1–SIRP-α signaling suppresses Nox1 transcription and oxidative stress, increases reperfusion blood flow, and limits renal IRI injury. Wild-type mice were treated with a SIRP-α–blocking Ab or isotype control (CTRL) Ab and challenged with renal ischemia and 24-hour reperfusion (n=8 per group). (A) Laser Doppler images of renal blood flow. Red indicates blood flow. Results represent the means±SEM of four measurements from five mice in each group. *Statistically significant difference (P<0.001) for SIRP-α compared with isotype control at 30 minutes; **statistically significant difference (P<0.001) for SIRP-α compared with isotype control at 24 hours of reperfusion. (B) Western and RT-PCR analysis was performed for the indicated proteins and genes. Data shown are means±SEM, with representative Western blots.*Statistically significant difference (P<0.001) for SIRP-α compared with isotype control Ab. (C) Quantification and representative tissue sections from SIRP-α or control Ab treated mice after renal IRI stained with DHE or 4-HNE and visualized by microscopy (magnification, ×200) (n=5 per group). (D) Representative tissue sections and analysis of renal tubular damage and neutrophilic invasion from SIRP-α and isotype control Ab–treated mice (magnification, ×200; inset ×400). Data shown are means±SEM, *statistically significant difference (P<0.001) for SIRP-α compared with control Ab. Arrows highlight rTEC death and cast formation. (E) RT-PCR analysis of inflammatory cytokines and chemokines. Data shown are means±SEM. *Statistically significant difference (P<0.001) for SIRP-α compared with control Ab. (F) Quantification and tissue sections from control or SIRP-α Ab–treated mice after renal IRI mice stained by TUNEL assay (magnification, ×200). Data shown are means±SEM (n=6 per group). *Statistically significant difference (P<0.001) for SIRP-α compared with control Ab. (G) Serum urea and creatinine from mice. Data shown are means±SEM (n=6 per group). *Statistically significant difference (P<0.05) for SIRP-α compared with control Ab.

References

    1. Lawler J: Thrombospondin-1 as an endogenous inhibitor of angiogenesis and tumor growth. J Cell Mol Med 6: 1–12, 2002 - PMC - PubMed
    1. Chen H, Herndon ME, Lawler J: The cell biology of thrombospondin-1. Matrix Biol 19: 597–614, 2000 - PubMed
    1. Rogers NM, Thomson AW, Isenberg JS: Activation of parenchymal CD47 promotes renal ischemia-reperfusion injury. J Am Soc Nephrol 23: 1538–1550, 2012 - PMC - PubMed
    1. Riessen R, Kearney M, Lawler J, Isner JM: Immunolocalization of thrombospondin-1 in human atherosclerotic and restenotic arteries. Am Heart J 135: 357–364, 1998 - PubMed
    1. Bauer EM, Qin Y, Miller TW, Bandle RW, Csanyi G, Pagano PJ, Bauer PM, Schnermann J, Roberts DD, Isenberg JS: Thrombospondin-1 supports blood pressure by limiting eNOS activation and endothelial-dependent vasorelaxation. Cardiovasc Res 88: 471–481, 2010 - PMC - PubMed

Publication types

MeSH terms