. 2013 Aug 6;3(4):20130016.
doi: 10.1098/rsfs.2013.0016.

Evolution of intratumoral phenotypic heterogeneity: the role of trait inheritance

Affiliations

Evolution of intratumoral phenotypic heterogeneity: the role of trait inheritance

Jill Gallaher et al. Interface Focus. .

Abstract

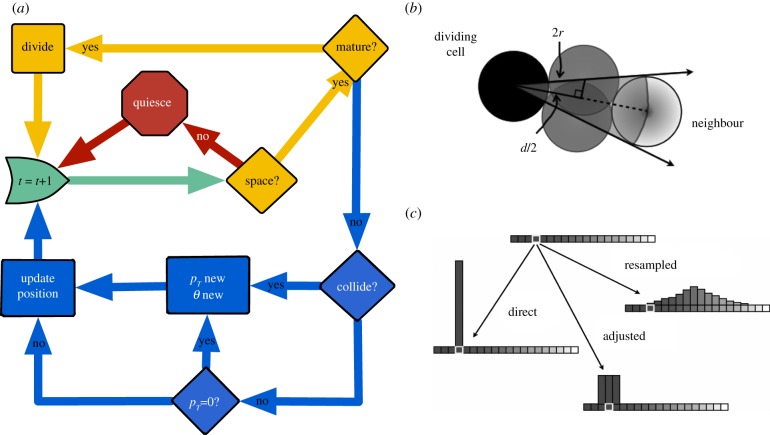
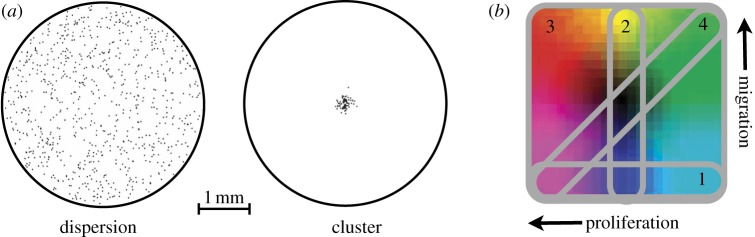
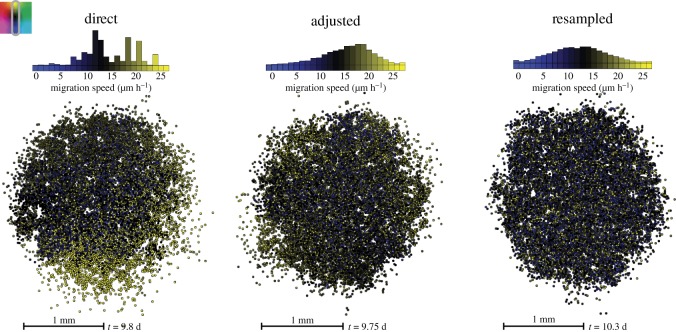
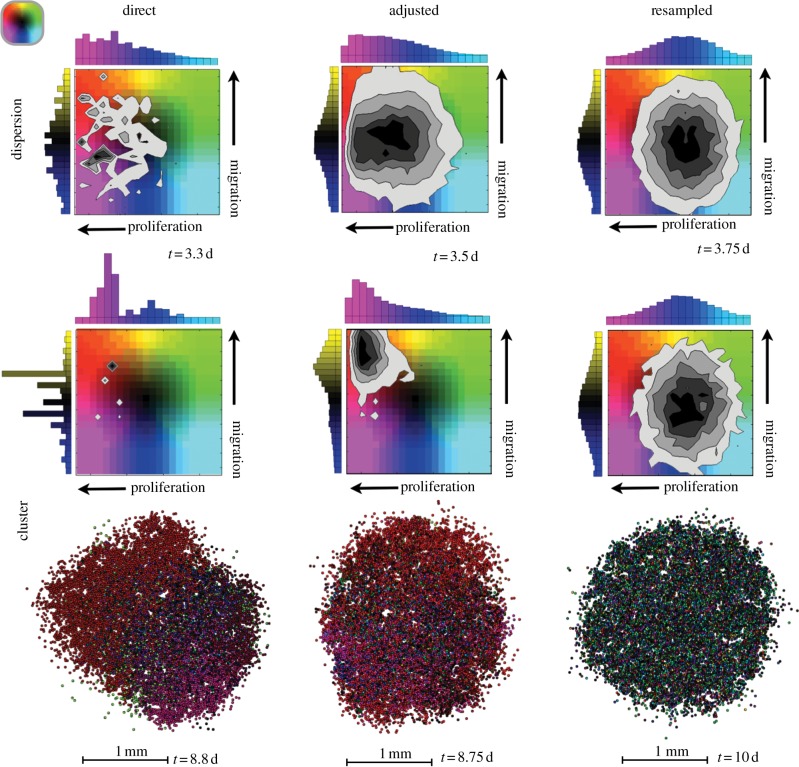
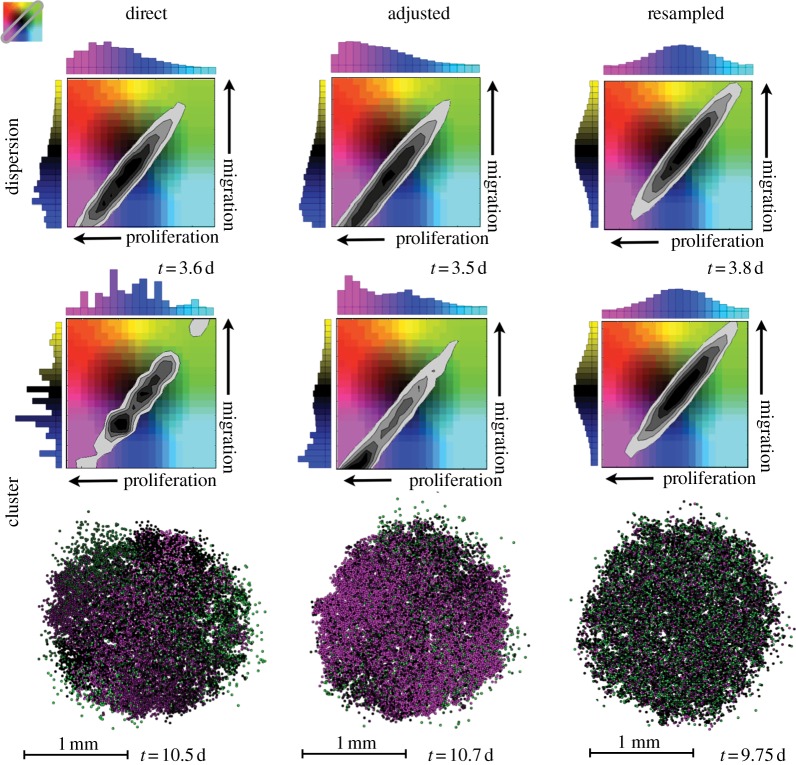
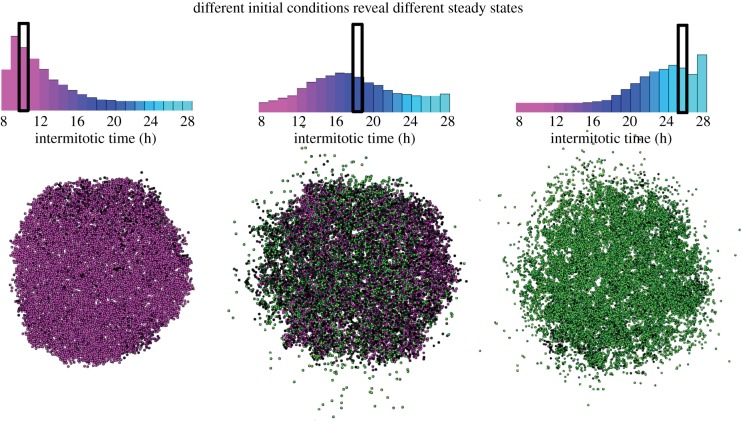
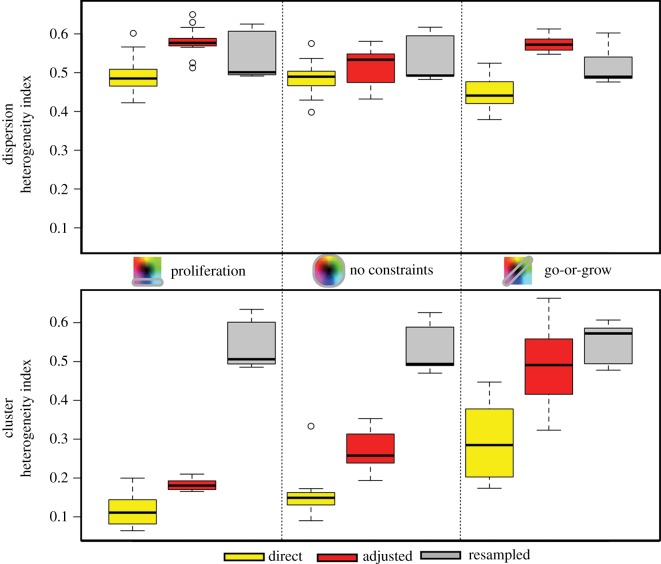
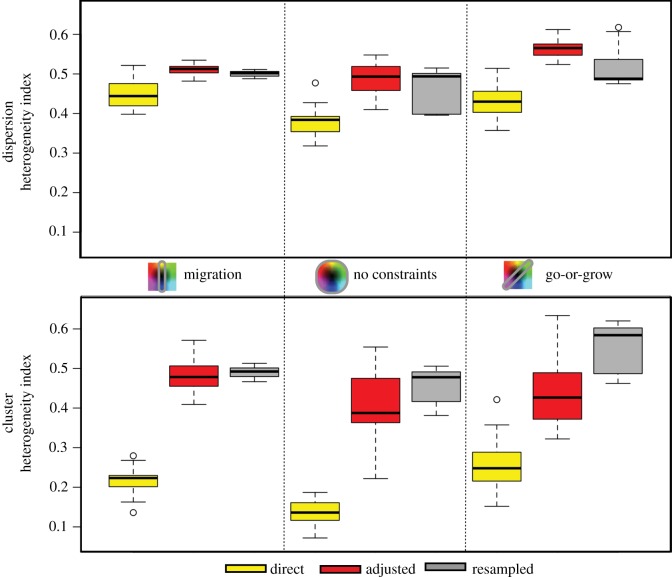
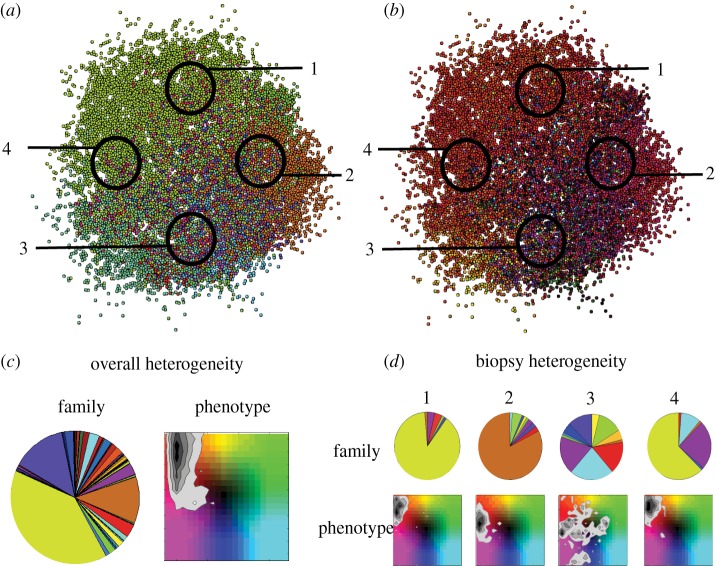
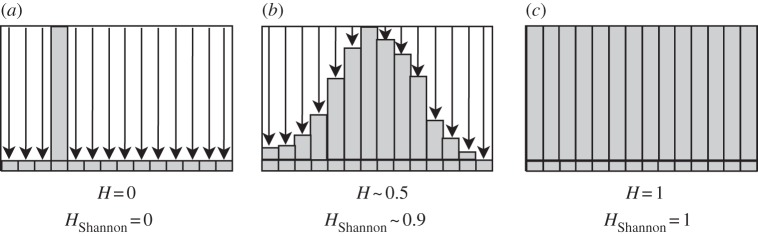
A tumour is a heterogeneous population of cells that competes for limited resources. In the clinic, we typically probe the tumour by biopsy, and then characterize it by the dominant genetic clone. But genotypes are only the first link in the chain of hierarchical events that leads to a specific cell phenotype. The relationship between genotype and phenotype is not simple, and the so-called genotype to phenotype map is poorly understood. Many genotypes can produce the same phenotype, so genetic heterogeneity may not translate directly to phenotypic heterogeneity. We therefore choose to focus on the functional endpoint, the phenotype as defined by a collection of cellular traits (e.g. proliferative and migratory ability). Here, we will examine how phenotypic heterogeneity evolves in space and time and how the way in which phenotypes are inherited will drive this evolution. A tumour can be thought of as an ecosystem, which critically means that we cannot just consider it as a collection of mutated cells but more as a complex system of many interacting cellular and microenvironmental elements. At its simplest, a growing tumour with increased proliferation capacity must compete for space as a limited resource. Hypercellularity leads to a contact-inhibited core with a competitive proliferating rim. Evolution and selection occurs, and an individual cell's capacity to survive and propagate is determined by its combination of traits and interaction with the environment. With heterogeneity in phenotypes, the clone that will dominate is not always obvious as there are both local interactions and global pressures. Several combinations of phenotypes can coexist, changing the fitness of the whole. To understand some aspects of heterogeneity in a growing tumour, we build an off-lattice agent-based model consisting of individual cells with assigned trait values for proliferation and migration rates. We represent heterogeneity in these traits with frequency distributions and combinations of traits with density maps. How the distributions change over time is dependent on how traits are passed on to progeny cells, which is our main enquiry. We bypass the translation of genetics to behaviour by focusing on the functional end result of inheritance of the phenotype combined with the environmental influence of limited space.

Keywords: evolution; heterogeneity; phenotypic inheritance.


Figures

Figure 1.
Figure 1.
Model details: (a) Flow diagram describing decision-making of each cell at each time frame. The time frame starts at the green arrow where it either goes through division (yellow loop), goes into quiescence (red loop) or migrates (blue loop). (b) The geometry of angle exclusion that leads to quiescence from contact inhibition from a dividing cell (black) and its neighbour (light grey). The mid-grey ‘phantom’ cells show the closest possible position of a new cell on each side of the overlap so that there is a block of excluded angles. (c) The different modes of inheritance (direct, adjusted and resampled) are shown with the probability of choosing the trait value of the daughter cells given the parent's trait value (white box).
Figure 2.
Figure 2.
Model details: (a) The two initial spatial configurations: dispersion and cluster. (b) The different constraints on the phenotype space labelled in order of presentation (1, proliferation only; 2, migration only; 3, no constraints; 4, go-or-grow).
Figure 3.
Figure 3.
Heterogeneity of IMTs in dispersions upon reaching 25 000 cells (top) and clusters upon reaching 8000 cells (bottom) with different inheriting modes (columns for direct, adjusted and resampled inheritance). The spatial distributions are shown with the time taken to reach the final population recorded below. The histograms above the images show the distribution of IMTs at this final population. The gradient from magenta to blue to cyan represents cells with IMTs going from short to long.
Figure 4.
Figure 4.
Heterogeneity in migration speeds with different inheriting modes (columns for direct, adjusted and resampled inheritance). The cells all have the same proliferation rate (18 h) but vary in how fast they are moving. The image shows the spatial distribution upon reaching 8000 cells, and the time taken to reach this population is recorded below. The histograms above the images show the distribution of migration speeds at this final population. The gradient from blue to black to yellow represents cells with speeds going from slow to fast.
Figure 5.
Figure 5.
The frequency of occurrence of cells with combinations of traits in the dispersion upon reaching 25 000 cells (top) and the cluster upon reaching 8000 cells (bottom). The time taken to reach these populations is listed. The histograms to the top and side of the phenotype density maps show the distribution of proliferation rates and migration speeds, respectively, with increasing values along the direction of the arrow. The phenotype density map represents the frequency of occurrence of each trait combination (darker greyscale values signify more cells with that combination). The spatial layout shows the cluster of cells coloured according to where they fall in the phenotype space.
Figure 6.
Figure 6.
The frequency of occurrence of cells when confined to the diagonal of the phenotype space (go-or-grow) in the dispersion upon reaching 25 000 cells (top) and the cluster upon reaching 8000 cells (bottom). The time taken to reach these populations is listed. The histograms to the top and side of the phenotype density map show the distribution of proliferation rates and migration speeds, respectively, with increasing values along the direction of the arrow. The phenotype density map represents the frequency of occurrence of each trait combination (darker greyscale values signify more cells with that combination). The spatial layout shows the cluster of cells coloured according to where they fall in the phenotype space.
Figure 7.
Figure 7.
With the adjusted inheritance, the go-or-grow constraint yields different populations of clusters grown to 8000 cells depending on the initial distribution. All initial distributions (black box) are monoclonal with IMTs at 10 h (left), 18 h (middle) and 26 h (right).
Figure 8.
Figure 8.
Heterogeneity in proliferation rate as calculated via equation (A 1) for each constraint on phenotype space (columns), for each inheritance type (colours) and for each spatial configuration (top is the dispersion and bottom is the cluster). The columns are for: proliferation only, both traits with no constraints and go-or-grow. From 15 different runs, the range, upper quartile and lower quartile are shown.
Figure 9.
Figure 9.
Heterogeneity in migration rate as calculated via equation (A 1) for each constraint on phenotype space (columns), for each inheritance type (colours) and for each spatial configuration (top is the dispersion and bottom is the cluster). The columns are for: migration only, both traits with no constraints and go-or-grow. From 15 different runs, the range, upper quartile and lower quartile are shown.
Figure 10.
Figure 10.
(a) Typical growth rates of the dispersion and cluster configurations. The dispersion is fit with an exponential, whereas the cluster is fit to a power law (both with R2 > 0.999). (b) The percentage of cells of the whole population that are in the proliferating state. The two spatial configurations clearly lead to different degrees of competition.
Figure 11.
Figure 11.
Growth rates (left) and proliferating fractions (right) of monoclonal populations with various combinations of proliferation and migration rates. To quantify the growth rate and proliferating fractions: (i) the dispersion was grown from 800 to 25 000 cells and (ii) the cluster was grown from 80 to 8000 cells. The growth rates are found by dividing the total change in the number of cells by the total change in time. This is then normalized by the initial population. The proliferating fraction is taken at the final time step.
Figure 12.
Figure 12.
Growth rates for the dispersion (top) and the cluster (bottom) for each constraint on phenotype space (columns) and for each inheritance type (colours). From 15 different runs, the range, upper quartile and lower quartile are shown.
Figure 13.
Figure 13.
The percentage of the total population of cells that are proliferating for the dispersion (top) and the cluster (bottom). Fifteen different runs make the variance in the plot.
Figure 14.
Figure 14.
Heterogeneity from (a) familial origin and (b) phenotype does not always correspond. Site-specific differences are also found. We show heterogeneity (c) overall and (d) within each biopsy. We see that even if a tumour may have several dominant clones, the phenotypes may converge.
Figure 15.
Figure 15.
An illustration of the heterogeneity index as calculated via equation (A 1), and with the Shannon index from the frequency distribution of trait values. If all cells in the population have the same trait value, we get a minimum heterogeneity index (a). If the population has an equal spread of trait values throughout the range, the heterogeneity index is maximum (c). The two values differ in the configuration shown in (b), where the Shannon index grows logarithmically compared with the linear growth used here.

References

    1. Merlo LMF, Maley CC. 2010. The role of genetic diversity in cancer. J. Clin. Invest. 120, 401–403. (10.1172/JCI42088) - DOI - PMC - PubMed
    1. Marusyk A, Almendro V, Polyak K. 2102. Intra-tumour heterogeneity: a looking glass for cancer? Nat. Rev. Cancer 12, 323–334. (10.1038/nrc3261) - DOI - PubMed
    1. Gerlinger M, et al. 2012. Intratumor heterogeneity and branched evolution revealed by multiregion sequencing. N. Engl. J. Med. 366, 883–892. (10.1056/NEJMoa1113205) - DOI - PMC - PubMed
    1. Sottoriva A, et al. 2013. Intratumor heterogeneity in human glioblastoma reflects cancer evolutionary dynamics. Proc. Natl Acad. Sci. USA 110, 4009–4014.10.1073/pnas.1219747110 (10.1073/pnas.1219747110) - DOI - DOI - PMC - PubMed
    1. Marusyk A, Polyak K. 2013. Cancer cell phenotypes in fifty shades of grey. Science 339, 528–529. (10.1126/science.1234415) - DOI - PubMed

LinkOut - more resources