Review
. 2013 Oct 6;3(5):20130037.
doi: 10.1098/rsfs.2013.0037.

Magnetic field effects in flavoproteins and related systems

Affiliations
Review

Magnetic field effects in flavoproteins and related systems

Emrys W Evans et al. Interface Focus. .

Abstract

Within the framework of the radical pair mechanism, magnetic fields may alter the rate and yields of chemical reactions involving spin-correlated radical pairs as intermediates. Such effects have been studied in detail in a variety of chemical systems both experimentally and theoretically. In recent years, there has been growing interest in whether such magnetic field effects (MFEs) also occur in biological systems, a question driven most notably by the increasing body of evidence for the involvement of such effects in the magnetic compass sense of animals. The blue-light photoreceptor cryptochrome is placed at the centre of this debate and photoexcitation of its bound flavin cofactor has indeed been shown to result in the formation of radical pairs. Here, we review studies of MFEs on free flavins in model systems as well as in blue-light photoreceptor proteins and discuss the properties that are crucial in determining the magnetosensitivity of these systems.

Keywords: cryptochrome; magnetic compass; magnetic field effect; photolyase; radical pair mechanism.


Figures

Figure 1.
Figure 1.
(a) Effect of the Zeeman splitting on the singlet (S) and triplet states (T0, T+ and T) for a negative exchange interaction, J. (b) Schematic curve showing the magnetic field dependence of the singlet yield of a singlet-born radical pair. The sign of the field effect would be inverted for a triplet-born radical pair.
Figure 2.
Figure 2.
Chemical structures of (a) riboflavin tetrabutyrate (RFTB), (b) riboflavin (RF), (c) flavin mononucleotide (FMN) and (d) flavin adenine dinucleotide (FAD).
Figure 3.
Figure 3.
Photochemical reaction scheme for intermolecular radical pair formation between flavin (F) and an electron donor (D). Rapid ISC from the excited flavin forms the long-lived triplet state, which is subsequently quenched leading to the triplet-born SCRP, 3[F•− + D+]. The double-headed arrow indicates coherent, magnetic-field-dependent interconversion between triplet and singlet states of the radical pair. Escape from the geminate cage competes with the spin-selective recombination of the singlet radical pair to the ground state.
Figure 4.
Figure 4.
Absorption spectra of FAD in various oxidation and protonation states. Adapted from [52], Copyright © 2010, with permission from Elsevier.
Figure 5.
Figure 5.
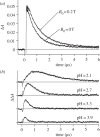
(a) Time profiles of the TA of FAD at λ = 580 nm with (upper, B0 = 0.2 T) and without (lower, B0 = 0) magnetic field. (b) pH dependence of the subtraction time profiles given by subtracting the data without magnetic field from those with magnetic field (ΔΔA(0.2 T) = ΔA(0.2 T) − ΔA(0)). These subtraction time profiles were obtained by averaging the data in the region of λ = 550–650 nm. Adapted with permission from [49], Copyright © 2005 American Chemical Society.
Figure 6.
Figure 6.
The MFE on the free radical yield as a function of detergent concentration, as estimated from the TA profiles. Radicals were generated between riboflavin (RF), flavin mononucleotide (FMN) or riboflavin tetrabutyrate (RFTB) and tryptophan (Trp) or indole (Ind). The MFE is calculated as 100% × ΔΔA(0.2 T)/ΔA(0). The detergent used was sodium dodecyl sulphate (SDS) which has a critical micelle concentration of 8.1 mM. Data were not measured for RTFB for [SDS] < 15 mM owing to insolubility in the absence of micelle formation [44].
Figure 7.
Figure 7.
(a) Structure of Triton X-100 surfactant and schematic depiction of the electron transfer reaction and subsequent radical protonation of flavin in Triton X-100 micelles. (b) Subtraction time profiles obtained as ΔΔA(0.2 T), λ = 390 nm, for RFTA at various pH values. The solid lines are the fittings by the double exponential function given in the text. (c) Plot of the first-order rate constant k1 for the protonation reaction of the intermediate anion radicals in the system of RF (open circle) and RFTA (filled circle). The corresponding values for the second-order rate constant kp are included. Adapted from [45], Copyright © 2004, with permission from Elsevier.
Figure 8.
Figure 8.
Dependence of the MFE on the concentration of NaCl in the FMN/HEWL and RF/HEWL systems at pH 6.1. The MFE is calculated as 100% × ΔΔA(250 mT)/ΔA(0). Adapted from [46]. Copyright © 2003, American Chemical Society.
Figure 9.
Figure 9.
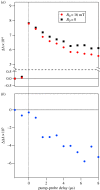
(a) and (c): decay-time profiles of a photoexcited aqueous solution of 10 µM FMN and 0.5 mM HEWL, measured by (a) CRDS (0.75 mJ pump pulse energy, 1 mm path length) and (c) TA (1 mJ pump pulse energy, 10 mm path length), in the presence and absence of an applied magnetic field (52 mT for CRDS and 30 mT for TA). (b) and (d): subtraction profiles ΔΔA(B0) = ΔA(B0)−ΔA(0), determined from decay profiles (a) and (c), respectively. Note the breaks in the vertical axes and the difference in ΔΔA(t) between CRDS and TA of roughly two orders of magnitude. All data points are 2000-shot averages. Adapted with permission from [67]. Copyright © 2011, American Chemical Society.
Figure 10.
Figure 10.
The tryptophan triad in cryptochrome structures. (a) PHR domain of Drosophila cryptochrome (grey-blue) with C-terminal extension (dark pink) (b) class II CPD photolyase (rice) with non-canonical Trp triad. (c,d) Cry-DASH from Synechocystis (c) environment of the isoalloxazine ring of FAD—Asn392 on helix α16 interacts with N5 of the isoalloxazine ring (dashed line—the top of helix α15 has been omitted for clarity); (d) close-up on canonical tryptophan triad and alternative terminal tryptophan, TrpC′ (bright pink), in Synechocystis. FAD (light pink), tryptophan triad (orange) and Asn392 (yellow; (c,d) only) shown in stick representation. The orientation of cryptochromes is identical in (a) and (b) to emphasize the difference between canonical and class II CPD photolyase triads. Figures drawn from PDBs 4GU5, 3UMV and 1NP7.
Figure 11.
Figure 11.
Complete TREPR dataset of XlCry-DASH measured at 274 K. Each time profile is the average of 120 acquisitions recorded with a laser pulse repetition rate of 1.25 Hz, a microwave frequency of 9.68 GHz and a power of 2 mW at a detection bandwidth of 100 MHz. A, enhanced absorption; E, emission. Adapted with permission from [97]. Copyright © 2009, Wiley.
Figure 12.
Figure 12.
TREPR spectra of wild-type (WT, solid blue curve) and different Trp mutant proteins (solid green curves) of Synechocystis Cry-DASH at 274 K, recorded 500 ns after pulsed-laser excitation. The spectra were scaled to a comparable signal-to-noise ratio. From top to bottom: WT, W320F, W373F and W375F. TrpA = W396, TrpB = W373, TrpC = W320 and TrpC′ = W375. Each time profile is the average of 120 acquisitions recorded with a laser pulse repetition rate of 1.25 Hz, a microwave frequency of 9.68 GHz and a power of 2 mW at a detection bandwidth of 100 MHz. The dashed red curve shows a spectral simulation of the TREPR spectrum for the radical pair state [FAD + TrpC′]. Adapted with permission from [100]. Copyright © 2009, Wiley.
Figure 13.
Figure 13.
TA spectra and magnetic-field action spectra of AtCry1 (a,c) and EcPL (b,d). TA spectra, ΔA(0), of (a) AtCry1 and (b) EcPL. ΔA(0) is the difference between signals recorded with and without a 460 nm, 5 ns pump light pulse in the absence of an applied magnetic field. The spectra were integrated over 1 µs periods centred at the indicated times after the pump pulse. Each spectrum is the average of two transients. The laser repetition rate was kept low (0.05 Hz) to minimize protein photodegradation and allow for sample reoxidation. The 1.5 µs signal in (b) at 460 nm is distorted by a transient effect of the laser pulse on the photomultiplier detector. Experimental conditions: AtCry1, 250 K, 60% (v/v) glycerol/water solution; EcPL, 250 K, 50% (v/v) glycerol/water solution. (c,d) Magnetic-field action spectra of AtCry1 and EcPL, respectively, recorded under the same conditions as (a,b), presented as ΔΔA = ΔA(28 mT)−ΔA(0). Two transients each were recorded in the absence and presence of a 28 mT magnetic field. At each wavelength, the double-difference kinetic time profiles were smoothed with a 2 µs boxcar function and the mean and standard deviation calculated over the indicated time intervals. At each wavelength, the mean ± s.d. is plotted. Adapted from [55]. Copyright © 2011, National Academy of Sciences.
Figure 14.
Figure 14.
MFEs on the photochemical kinetics of AtCry1 (a,b) and EcPL (c,d). TA kinetic time profiles of (a) AtCry1 and (c) EcPL both recorded at 510 nm in the absence (blue) and presence (red) of a 28 mT magnetic field. (b,d) Differences between the two signals in the absence and presence of the field: ΔΔA = ΔA(28 mT) − ΔA(0). Boxcar smoothing (200 ns) was used to produce (b,d); no smoothing was used for (a,c). Experimental conditions: AtCry1, 270 K in 60% (v/v) glycerol solution; EcPL, 250 K in 50% (v/v) glycerol solution. Similar traces for both proteins were observed at temperatures between 240 and 275 K and glycerol contents between 25 and 65%. Adapted from [55]. Copyright © 2011, National Academy of Sciences.
Figure 15.
Figure 15.
Proposed photochemical reaction schemes for AtCry1 and EcPL. The black arrows and species are common to both proteins; the blue and red features refer to AtCry1 and EcPL, respectively. Although RP2 in AtCry1 is here drawn as [FADH+Trp], the protonation state of the Trp radical is not certain. The double-headed arrow indicates the coherent, magnetic-field-dependent interconversion of the singlet and triplet states of RP1. Adapted from [55]. Copyright © 2011, National Academy of Sciences.
Figure 16.
Figure 16.
Magnetic field dependence of the yield of RP2 in AtCry1 and EcPL. Black dots depict the experimental data obtained for the percentage change in the yield of RP2 (measured at 510 nm) as a function of the strength of the applied magnetic field for (a) AtCry1 and (b) EcPL. Experimental conditions: (a) AtCry1, 60% glycerol, 270 K; (b) EcPL, 50% glycerol, 260 K. The red lines are the best-fit simulations obtained using a ST dephasing model [55], with kf = 2.5×10⁵ s−1 and (a) kb = 4.9×10⁵ s−1; kSTD = 1.1×10⁷ s−1; (b) kb = 1.2×10⁵ s−1; kSTD = 2.7×10⁷ s−1. The other lines are simulations with the same values of kf and kb but (a) kSTD/s−1 = 0 (green), 5×10⁶ (yellow), 5×10⁷ (blue); (b) kSTD = 0 (green), 1×10⁷ (yellow), 1×10⁸ (blue). The two larger insets show expanded views of the simulations in the low field region. The irregularities visible in some of these curves arise from energy-level anticrossings. The smaller inset in (b) shows, on an expanded scale, the best-fit simulation together with eight measurements in the range 0.7–2.2 mT that were averaged to obtain the (black) point plotted at B0=1.5 mT in this inset and in the main panel. The error bars associated with this data point represent±one standard deviation of the eight measurements. Each data point in the main panels is the average of (a) 10 and (b) 40 (greater than 3 mT) or 80 (less than 3 mT) transients. At each applied magnetic-field strength B0, the double-difference kinetic time profiles ΔA(B0)−ΔA(0) were smoothed with (a) 5 µs and (b) 0.5 µs boxcar functions. The mean ± s.d. (calculated over the time intervals: (a) 2–170 µs and (b) 7–15 µs is plotted for each datum. Adapted from [55]. Copyright © 2011, National Academy of Sciences.
Figure 17.
Figure 17.
(a) Decay-time profiles for EcPL, in the presence and absence of a 16 mT applied magnetic field as measured by CRDS (1 mJ pump pulse energy, 1 mm sample optical path length). Note the break in the vertical axis in (a). (b) MFE time profile, ΔΔA(16 mT) (=ΔA(16 mT) − ΔA(0)), determined from the decay-time graph in (a). All data show averages of only 50 shots. Adapted from [67]. Copyright © 2011, American Chemical Society. (Online version in colour.)

References

    1. Steiner UE, Ulrich T. 1989. Magnetic field effects in chemical kinetics and related phenomena. Chem. Rev. 89, 51–147. (10.1021/cr00091a003) - DOI
    1. Woodward JR. 2002. Radical pairs in solution. Prog. React. Kinet. Mech. 27, 165–207. (10.3184/007967402103165388) - DOI
    1. Timmel CR, Henbest KB. 2004. A study of spin chemistry in weak magnetic fields. Phil. Trans. R. Soc. Lond. A 362, 2573–2589. (10.1098/rsta.2004.1459) - DOI - PubMed
    1. Brocklehurst B, McLauchlan KA. 1996. Free radical mechanism for the effects of environmental electromagnetic fields on biological systems. Int. J. Radiat. Biol. 69, 3–24. (10.1080/095530096146147) - DOI - PubMed
    1. Brocklehurst B. 2002. Magnetic fields and radical reactions: recent developments and their role in nature. Chem. Soc. Rev. 31, 301–311. (10.1039/b107250c) - DOI - PubMed

LinkOut - more resources