. 2014 Jan 2;2(1):52-63.
doi: 10.1016/j.stemcr.2013.11.006. eCollection 2014 Jan 14.

Induced pluripotent stem cell generation-associated point mutations arise during the initial stages of the conversion of these cells

Affiliations

Induced pluripotent stem cell generation-associated point mutations arise during the initial stages of the conversion of these cells

Mayumi Sugiura et al. Stem Cell Reports. .

Abstract

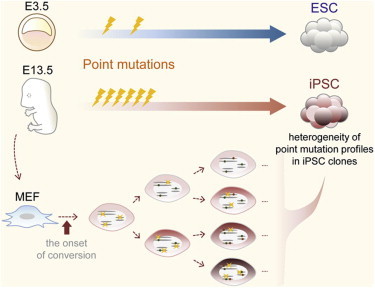
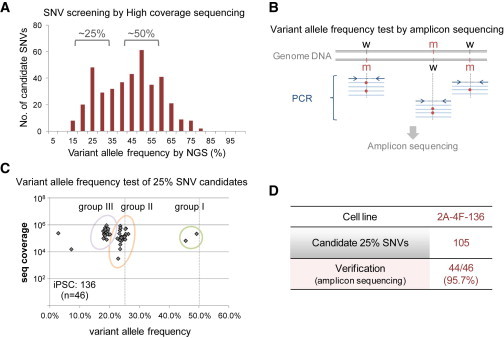
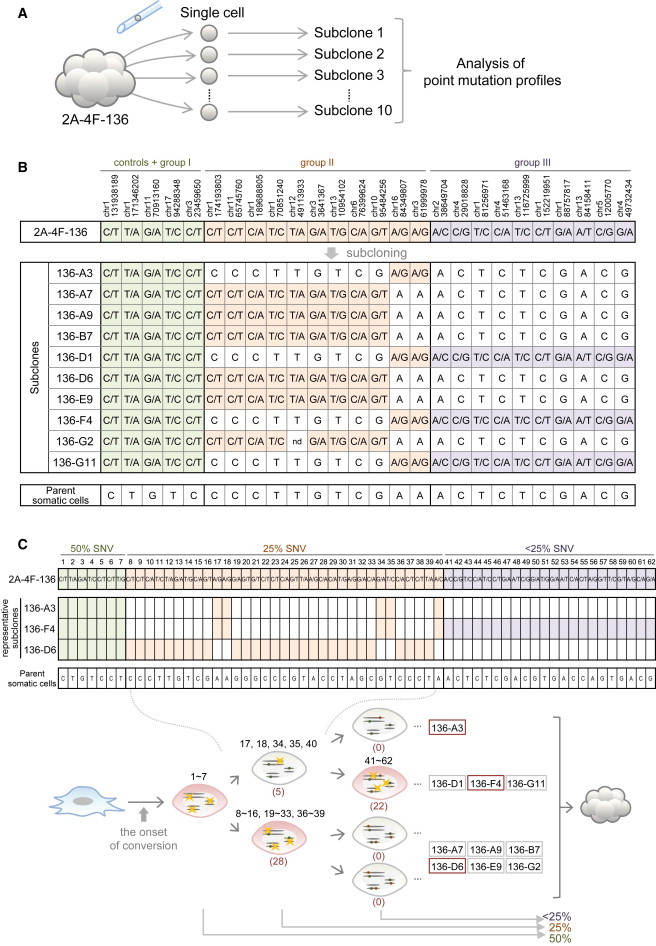
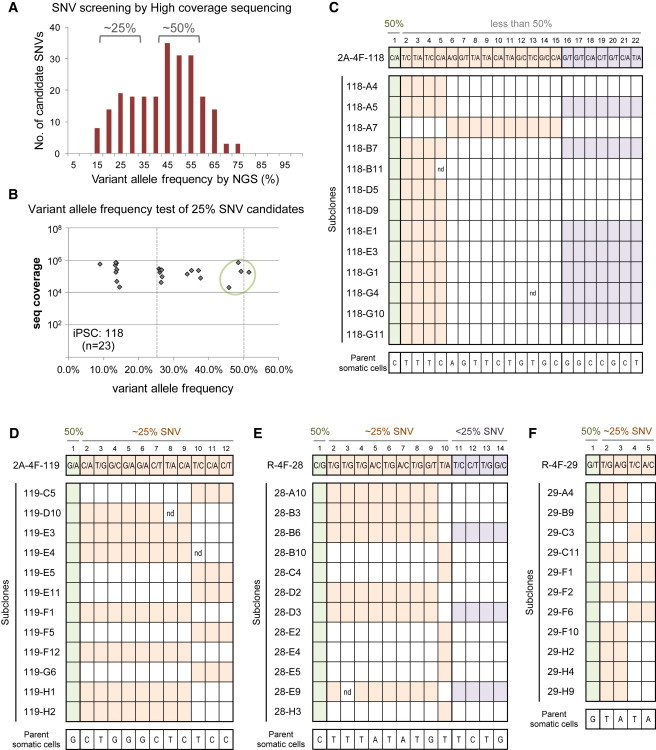
A large number of point mutations have been identified in induced pluripotent stem cell (iPSC) genomes to date. Whether these mutations are associated with iPSC generation is an important and controversial issue. In this study, we approached this critical issue in different ways, including an assessment of iPSCs versus embryonic stem cells (ESCs), and an investigation of variant allele frequencies and the heterogeneity of point mutations within a single iPSC clone. Through these analyses, we obtained strong evidence that iPSC-generation-associated point mutations occur frequently in a transversion-predominant manner just after the onset of cell lineage conversion. The heterogeneity of the point mutation profiles within an iPSC clone was also revealed and reflects the history of the emergence of each mutation. Further, our results suggest a possible approach for establishing iPSCs with fewer point mutations.


Figures

None
Graphical abstract
Figure 1
Figure 1
Point Mutation Load in iPSCs versus ESCs (A) Preparation of iPSC and ESC lines for point mutation analysis. Integration-free iPSCs were generated from a single mouse embryo at E13.5. Plasmids encoding the four required reprogramming factors were transfected into these cells and ESC lines were established from E3.5 blastocysts. After three to four passages, the generated iPSCs and ESCs were collected. (B) Distribution of base substitutions across mouse chromosomes. The dots indicate the positions of the point mutations identified in each line across the chromosomes. Analysis of X and Y chromosomes could not be performed effectively due to the huge number of redundant sequences. (C) Mutation rates. The bar graph represents the number of mutations identified within the 1 × 109 bp genome of iPSC lines (red) and ESC lines (blue). (D) Mutation profiles of iPSCs and ESCs. The frequencies of transitions and transversions are indicated by the pie charts. See also Figures S1, S2, and Tables S1–S5.
Figure 2
Figure 2
A Large Number of 25% SNVs Are Present in the iPSC Genome (A) Variant allele frequencies for SNV candidates screened using high-coverage, whole-genome sequencing data. The histogram indicates the variant allele frequencies by sequence coverage. (B) Schematic representation of the variant allele frequency test by amplicon sequencing. The targeted variants were amplified by PCR and assessed by deep sequencing using an Illumina MiSeq. (C) Variant allele frequency plots of 25% SNV candidates in the iPS136 clone. The plots show variant allele frequencies by sequence coverage of amplicon sequencing. The number of SNV candidates examined is indicated in parentheses. (D) Verification of candidate 25% SNVs. See also Figure S3 and Table S1.
Figure 3
Figure 3
Heterogeneity of Point Mutation Profiles in an iPSC Clone (A) Single-cell isolation and establishment of sublines from a single iPSC clone. (B) Point mutation profiles of each subline. The positions of five 50% SNVs (controls + group I), 11 25% SNVs (group II), and ten <25% SNVs (group III) were examined through sequence patterns (Sanger sequencing) in sublines of iPS136 (136-A3, A7, A9, B7, D1, D6, E9, F4, G2, and G11), original iPS136 cells, and parental somatic cells. The positions in which mutant alleles were detected are indicated with different colors (green, controls + group I; orange, group II; purple, group III). nd, not determined. (C) Time course of point mutation occurrence in iPSCs. Upper panel: sequence patterns of a total of 62 positions that were examined in three representative sublines of the iPS136 clone (136-A3, F4, and D6). Lower panel: conclusions from the point mutation profile analysis in iPS136 sublines. These point mutation profiles indicate that 50% SNVs (Nos. 1–7) were potentially preexisting parental SNVs or mutations that had occurred just after the onset of stem cell conversion. In contrast, 25% SNVs (Nos. 8–40) and <25% SNVs (Nos. 41–62) were generated after the first and second cell divisions, respectively. The values in parentheses indicate the total number of mutations that occurred and were detectable in this experiment. See also Table S1.
Figure 4
Figure 4
Heterogeneity of the Point Mutation Profiles in Other iPSC Clones (A) Variant allele frequencies for SNV candidates screened using high-coverage, whole-genome sequencing data for the iPS118 line. (B) Variant allele frequency plots of 25% SNV candidates of iPS118 cells. The plots show variant allele frequencies determined by sequence coverage of amplicon sequencing. The number of SNV candidates examined is indicated in parentheses. (C) Point mutation profiles of sublines of iPS118. Sequence patterns of a total of 22 positions were examined in 13 subclones of iPS118. (D) Point mutation profiles in sublines of iPS119. Sequence patterns of a total of 12 positions were examined in 12 subclones of iPS119. (E) Point mutation profiles in sublines of iPS28. Sequence patterns of a total of 14 positions were examined in 12 subclones of iPS28. (F) Point mutation profiles in sublines of iPS29. Sequence patterns of a total of five positions were examined in 11 subclones of iPS29. See also Table S1.
Figure 5
Figure 5
No Common SNVs Exist among iPSCs Generated from Single Embryo-Derived MEFs The number of SNVs identified is shown in parentheses. See also Figure S4 and Table S1.

References

    1. Araki R., Uda M., Hoki Y., Sunayama M., Nakamura M., Ando S., Sugiura M., Ideno H., Shimada A., Nifuji A., Abe M. Negligible immunogenicity of terminally differentiated cells derived from induced pluripotent or embryonic stem cells. Nature. 2013;494:100–104. - PubMed
    1. Cheng L., Hansen N.F., Zhao L., Du Y., Zou C., Donovan F.X., Chou B.K., Zhou G., Li S., Dowey S.N., NISC Comparative Sequencing Program Low incidence of DNA sequence variation in human induced pluripotent stem cells generated by nonintegrating plasmid expression. Cell Stem Cell. 2012;10:337–344. - PMC - PubMed
    1. Doan R., Cohen N.D., Sawyer J., Ghaffari N., Johnson C.D., Dindot S.V. Whole-genome sequencing and genetic variant analysis of a Quarter Horse mare. BMC Genomics. 2012;13:78. - PMC - PubMed
    1. Ghosh P., Hsu C., Alyamani E.J., Shehata M.M., Al-Dubaib M.A., Al-Naeem A., Hashad M., Mahmoud O.M., Alharbi K.B., Al-Busadah K. Genome-wide analysis of the emerging infection with Mycobacterium avium subspecies paratuberculosis in the Arabian camels (Camelus dromedarius) PLoS ONE. 2012;7:e31947. - PMC - PubMed
    1. Gore A., Li Z., Fung H.L., Young J.E., Agarwal S., Antosiewicz-Bourget J., Canto I., Giorgetti A., Israel M.A., Kiskinis E. Somatic coding mutations in human induced pluripotent stem cells. Nature. 2011;471:63–67. - PMC - PubMed

Publication types