. 2014:2014:651769.
doi: 10.1155/2014/651769. Epub 2014 Jan 8.

Shear stress, energy losses, and costs: a resolved dilemma of pulsatile cardiac assist devices

Affiliations

Shear stress, energy losses, and costs: a resolved dilemma of pulsatile cardiac assist devices

Sayed Nour et al. Biomed Res Int. 2014.

Abstract

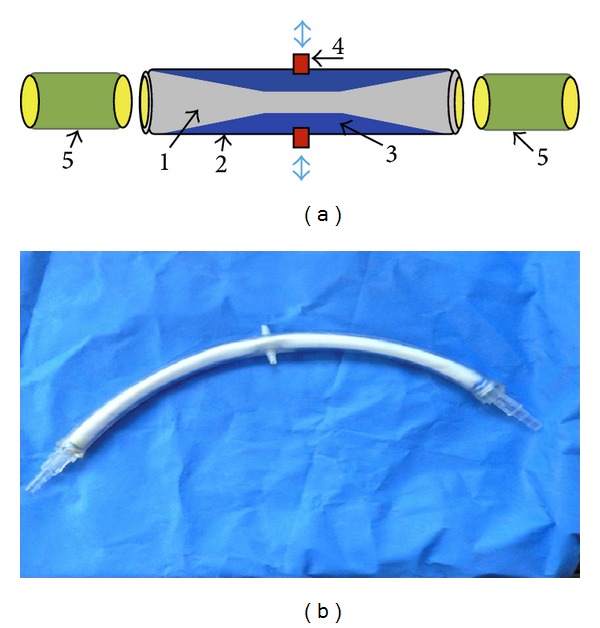
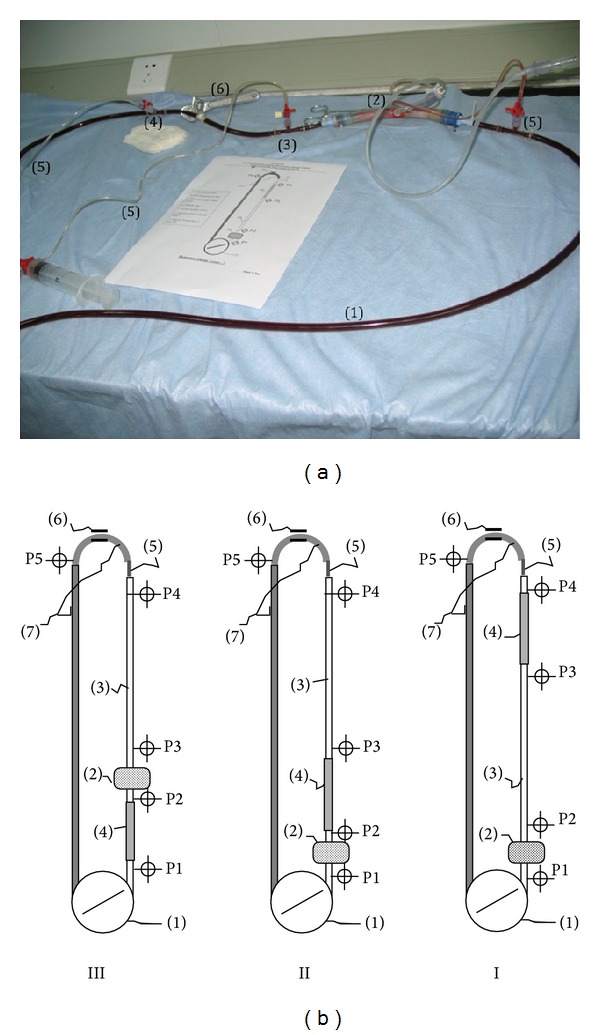
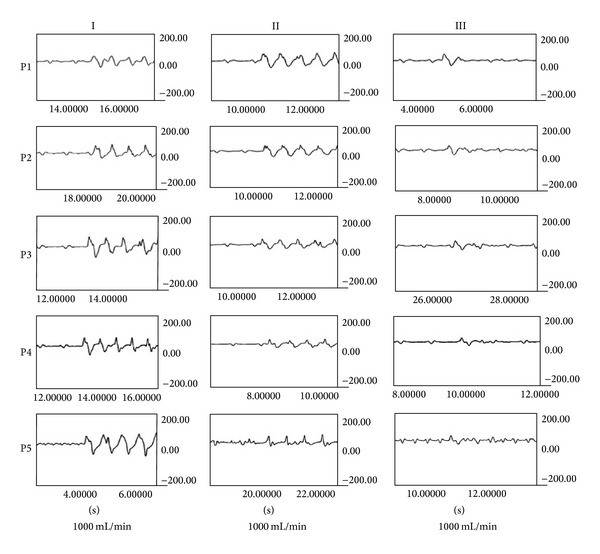
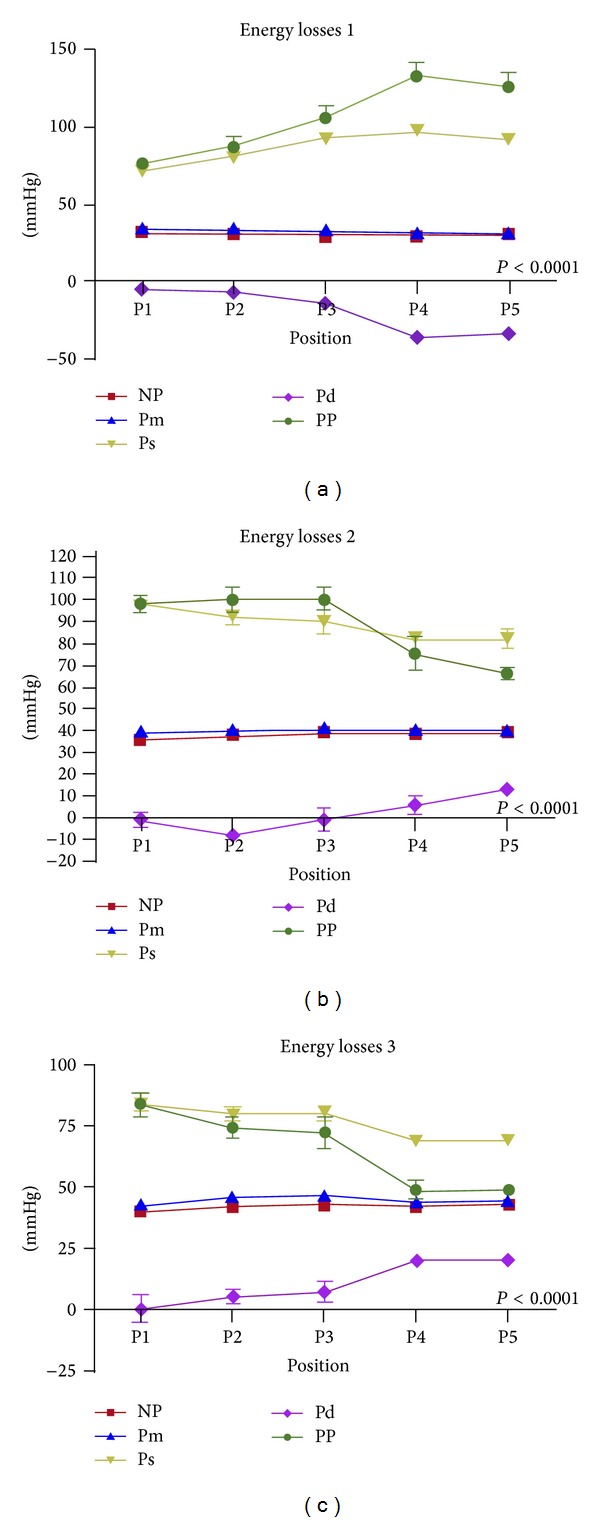
Cardiac assist devices (CAD) cause endothelial dysfunction with considerable morbidity. Employment of pulsatile CAD remains controversial due to inadequate perfusion curves and costs. Alternatively, we are proposing a new concept of pulsatile CAD based on a fundamental revision of the entire circulatory system in correspondence with the physiopathology and law of physics. It concerns a double lumen disposable tube device that could be adapted to conventional cardiopulmonary bypass (CPB) and/or CAD, for inducing a homogenous, downstream pulsatile perfusion mode with lower energy losses. In this study, the device's prototypes were tested in a simulated conventional pediatric CPB circuit for energy losses and as a left ventricular assist device (LVAD) in ischemic piglets model for endothelial shear stress (ESS) evaluations. In conclusion and according to the study results the pulsatile tube was successfully capable of transforming a conventional CPB and/or CAD steady flow into a pulsatile perfusion mode, with nearly physiologic pulse pressure and lower energy losses. This represents a cost-effective promising method with low mortality and morbidity, especially in fragile cardiac patients.


Figures

Figure 1
Figure 1
(a) Disposable pulsatile tube (pipe). According to patents descriptions (World Intellectual Property Organization: WO/2008/000110 and WO/2010/066899). 1 is flexible inner tube; 2 is rigid external tube; 3 is intermediate chamber; 4 is ports; 5 is connectors. (b) pulsatile tube prototype. External polyvinyl chloride (PVC) tube (1/2 inch); internal Polytetrafluoroethylene (PTFE) tube (12 mm), and connectors (1/16–1/4 inch).
Figure 2
Figure 2
(a) Mock circulation: energy losses circuit (I). 1 is arterial perfusion line; 2 is pulsatile tube; 3 is aortic cannula; 4 is venous line; 5 is pressures lines; 6 is partial tube clamp (simulated resistance). (b) Mock circulations with 3 different tube positions. {I} Pulsatile tube was positioned at 6 cm distance from aortic cannula; {II} Pulsatile tube positioned at 150 cm distance from aortic cannula; {III} Pulsatile tube wedged between roller pump and oxygenator. 1 is roller pump; 2 is oxygenator; 3 is arterial line; 4 is pulsatile tube; 5 is aortic cannula; 6 is resistance (tube clamp); 7 is venous line. P1, P2, P3, P4, and P5 are perfusion pressures recording spots.
Figure 3
Figure 3
Perfusions curves (in vitro). Perfusion curves (in mmHg) obtained at different circuit sites in 3 different pulsatile tube positions: I, II, and III close and distant from aortic cannula and pre-oxygenator, respectively. The perfusion curve amplitude was significantly higher at P5 with position I, compared to positions II and III.
Figure 4
Figure 4
Comparative steady and pulsatile flow perfusion curves obtained from 3 different circuits. Energy losses 1 (upper panel) are pulsatile tube at 6 cm from aortic cannula; energy losses 2 are pulsatile tube at 150 cm from aortic cannula; energy losses 3 are pre-oxygenator pulsatile tube position. P1–P5 are distant circuit spots for perfusion pressure records (mmHg). NP is nonpulsatile; Pm is mean pulsatile pressure, Ps is systolic pressure; Pd is diastolic pressure; PP is pulse pressure. The pulse pressure (green color) was significantly higher with position I compared to positions II and III.
Figure 5
Figure 5
Pulsatile flow pulse pressure (a) and systolic pressure (b). Energy losses with different tube positions: I is 6 cm from aortic cannula; II is 150 cm from aortic cannula; III is pre-oxygenator. P1–P5 are perfusion pressure records (mmHg) at main circuit energy losses spots. At P5 the pulse pressure (a) as well as the systolic pressure (b) were significantly higher in position I (red color) compared to other position II (blue color) and III (violet color). Circuit I: P1, P2 are pre/post-oxygenator pressure; P3, P4 are pre/post-tube. Circuit II: P1 is pre-oxygenator; P2, P3 are pre/post-tube; P4 is pre-aortic cannula. Circuit III: P1, P2 are pre/post-tube; P3 is post-oxygenator; P4 is pre-aortic cannula. P5 is post simulated resistance in all circuits. Pm is mean pulsatile pressure; Ps: systolic pulsatile pressure, Pd: pulsatile diastolic pressure; PP: pulse pressure. Pulse pressure was higher at P5 in circuit I, compared with II and III. Pm was higher at P5 compared to NP with position I (P < 0.001).
Figure 6
Figure 6
(a) Pulsatile LVAD perfusion curve in ischemic piglets. Unsynchronized pulsations with heartbeat perfusion curve with nearly physiological pulse pressure. (b) Pulsatile LVAD in piglet ischemic model. Left panel: massive myocardial ischemic zone after LAD ligation; right panel: clearance of the ischemic zone after 15 min of pulsatile LVAD (roller pump + pulsatile tube). 1 is aortic cannula; 2 is LAD permanent snugger; 3 is left ventricular apical vent; 4 is intrainfudibular pulmonary artery and Millar right ventricular pressure catheters; 5 is right atrium pressure line. 6 (c) Hemodynamic results of pulsatile and nonpulsatile left ventricular assist device in ischemic piglet model. P: pulsatile group; NP: nonpulsatile group; MAP: mean arterial pressure (mmHg); CO: cardiac output (L/min); SVRI: systemic vascular resistance index (dynes·s·cm−5/kg−1); PVRI: pulmonary vascular resistance index (dynes·s·cm−5/kg). T1: baseline; T2: 1 h of myocardial ischemia; T3: 1 h after treatment.
Figure 7
Figure 7
Different remodeling zones (Z) of left and right hearts circuits [15]. Left heart: Z1 = left ventricle pump; Z2 = peristaltic aortic pump + valsalva. Right heart: Z1= systemic veins; Z2 = atrio-ventricular cavity; Z3 = interventricular septum; Z4 = infundibulum; Z5 = pulmonary artery.
Figure 8
Figure 8
Main momentum energy losses zones within a CPB perfusion circuit [15]. Z0 = conventional CBP (1); Z1 = post-oxygenator (2) arterial line; Z2 = pulsatile tube; Z3 = pre-aortic cannula zone; Z4 = aortic cannula; Z5 = patient.

Similar articles

Cited by

References

    1. Diehl P, Aleker M, Helbing T, et al. Enhanced microparticles in ventricular assist device patients predict platelet, leukocyte and endothelial cell activation. Interactive CardioVasc Thoracic Surgery. 2010;11:133–137. - PubMed
    1. Pieske B. Reverse remodeling in heart failure—fact or fiction? European Heart Journal, Supplement. 2004;6:D66–D78.
    1. Habazettl H, Kukucka M, Weng YG, et al. Arteriolar blood flow pulsatility in a patient before and after implantation of an axial flow pump. Annals of Thoracic Surgery. 2006;81(3):1109–1111. - PubMed
    1. McHugh J, Cheek DJ. Nitric oxide and regulation of vascular tone: pharmacological and physiological considerations. The American Journal of Critical Care. 1998;7(2):131–140. - PubMed
    1. Thorin E, Nguyen T-D, Bouthillier A. Control of vascular tone by endogenous endothelin-1 in human pial arteries. Stroke. 1998;29(1):175–180. - PubMed

LinkOut - more resources