. 2014 May;38(5):1255-65.
doi: 10.1111/acer.12360. Epub 2014 Feb 11.

An evolutionarily conserved mechanism of calcium-dependent neurotoxicity in a zebrafish model of fetal alcohol spectrum disorders

Affiliations

An evolutionarily conserved mechanism of calcium-dependent neurotoxicity in a zebrafish model of fetal alcohol spectrum disorders

George R Flentke et al. Alcohol Clin Exp Res. 2014 May.

Abstract

Background: Fetal alcohol spectrum disorders (FASD) are a leading cause of neurodevelopmental disability. Nonhuman animal models offer novel insights into its underlying mechanisms. Although the developing zebrafish has great promise for FASD research, a significant challenge to its wider adoption is the paucity of clear, mechanistic parallels between its ethanol (EtOH) responses and those of nonpiscine, established models. Inconsistencies in the published pharmacodynamics for EtOH-exposed zebrafish, alongside the use of comparatively high EtOH doses, challenge the interpretation of this model's clinical relevance.

Methods: To address these limitations, we developed a binge, single-exposure model of EtOH exposure in the early zebrafish embryo.

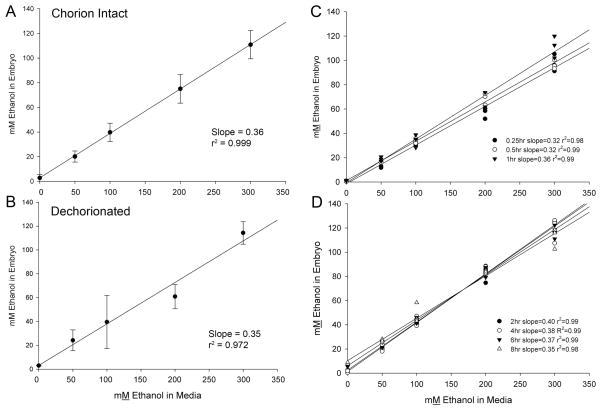
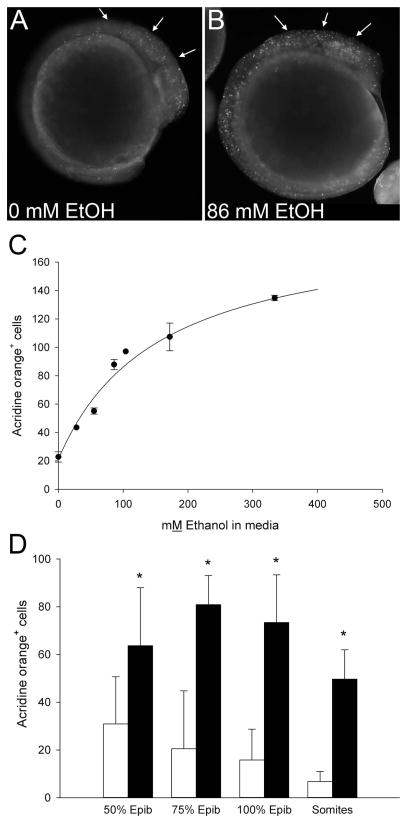
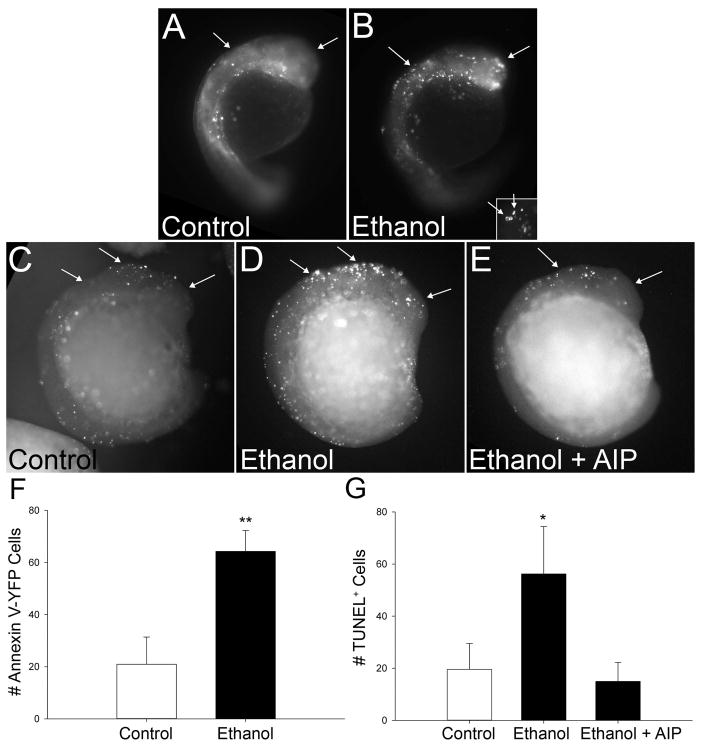
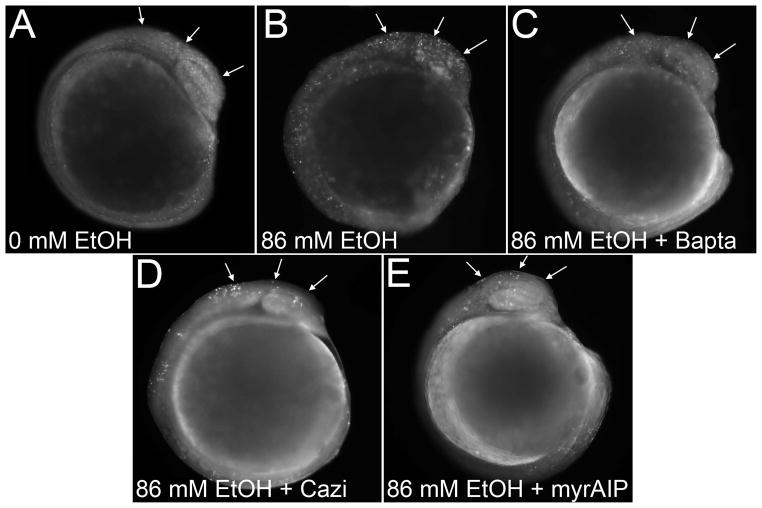
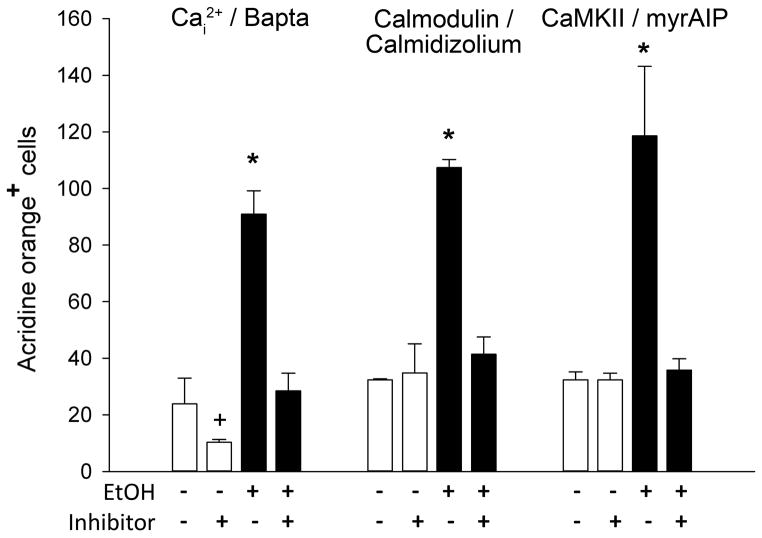
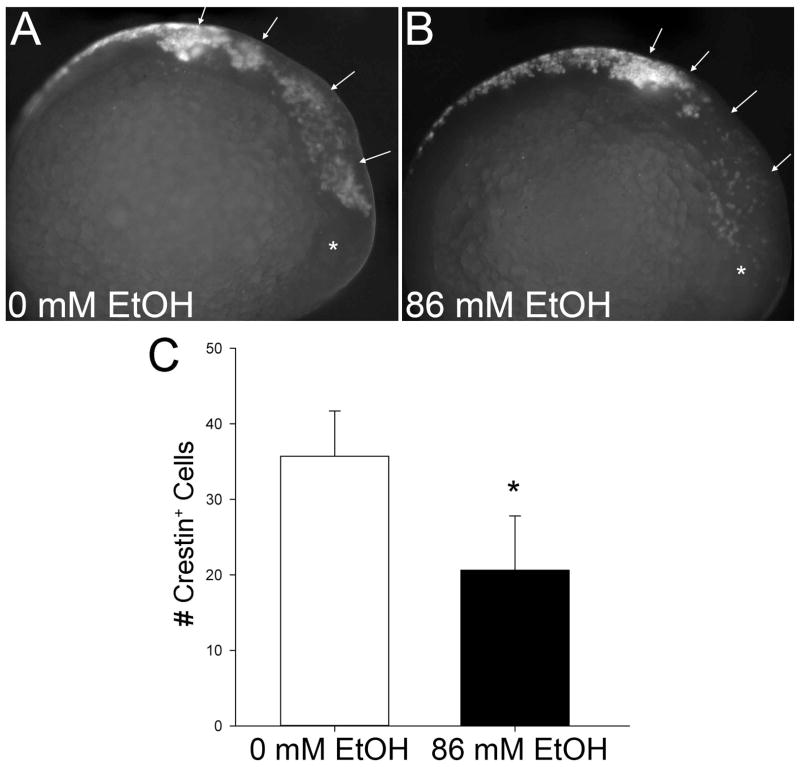
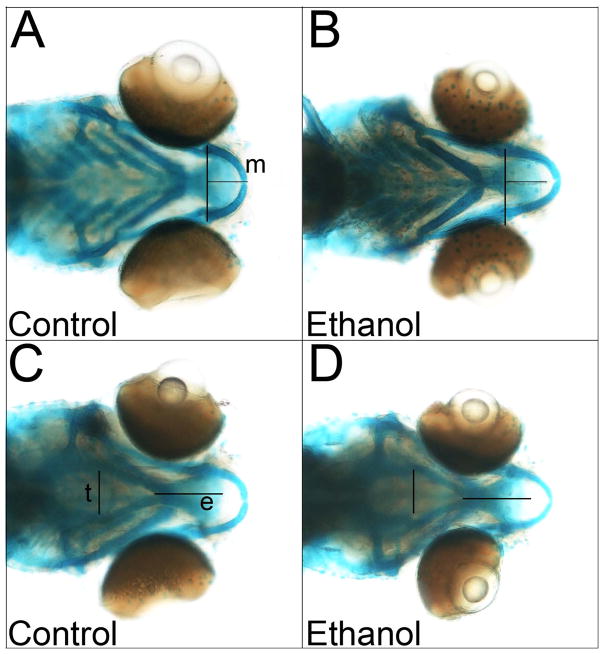
Results: Brief (3-hour) EtOH exposure is sufficient to cause significant neural crest losses and craniofacial alterations, with peak vulnerability during neurogenesis and early somitogenesis. These losses are apoptotic, documented using TUNEL assay and secA5-YFP-reporter fish. Apoptosis is dose dependent with an EC50 = 56.2 ± 14.3 mM EtOHint , a clinically relevant value within the range producing apoptosis in chick and mouse neural crest. This apoptosis requires the calcium-dependent activation of CaMKII and recapitulates the well-described EtOH signaling mechanism in avian neural crest. Importantly, we resolve the existing confusion regarding zebrafish EtOH kinetics. We show that steady-state EtOH concentrations within both chorion-intact and dechorionated embryos are maintained at 35.7 ± 2.8% of EtOHext levels across the range from 50 to 300 mM EtOHext , a value consistent with several published reports. Equilibrium is rapid and complete within 5 minutes of EtOH addition.

Conclusions: The calcium/CaMKII mechanism of EtOH's neurotoxicity is shared between an amniote (chick) and teleost fish, indicating that this mechanism is evolutionarily conserved. Our data suggest that EtOHext concentrations >2% (v/v) for chorion-intact embryos and 1.5% (v/v) for dechorionated embryos have limited clinical relevance. The strong parallels with established models endorse the zebrafish's relevance for mechanistic studies of EtOH's developmental neurotoxicity.

Keywords: Apoptosis; Calcium Signaling; Ethanol; Fetal Alcohol Spectrum Disorders; Neural Crest; Zebrafish.


Figures

Figure 1
Figure 1. Ethanol Pharmodynamics of Zebrafish Embryos
(A, B) Embryos at 6hpf with chorions intact or removed were incubated 1hr in the indicated ethanol concentration in the media (ethanolext) and the internal ethanol concentration (ethanolint) was quantified thereafter. The ratio of ethanolint/ethanolext concentration was calculated from the slopes by linear regression analysis. For embryos having intact chorions (A), ethanolext between 50mM to 300 mM yielded ethanolint values that were 36% of ethanolext. For dechorionated embryos (B), ethanolint values were 35% of ethanolext levels. (C, D) Embryos with intact chorions maintain steady-state kinetics of ethanol uptake between 0.25hr and 8hr ethanol exposure. (C) Ethanolint levels reached equilibrium with ethanolext levels within 15min of ethanol exposure and were maintained at those levels for the following hour. (D) Between 2hr and 8hr incubation, ethanolint levels were maintained at steady-state values which were 35–36% of ethanolext values across the entire concentration range of 50–300 mM. Values represent mean ± SD of three independent groups per dose, each having 25 (chorionated) or 100 embryos (dechorionated).
Figure 2
Figure 2. Dose-Dependence and Timing of Ethanol-Induced Cell Death
(A, B) Cell death, visualized using acridine orange, in representative embryos exposed 3hr at neurulation-stage to (A) 0mM or (B) 86mM ethanolext. Embryos exposed to 86mM ethanolext at 75% epiboly exhibit numerous labeled cells within developing cranial region (arrows), as well as presomitic and postsomitic mesenchyme. (C) Quantitation of dose- dependent cell death in dechorionated embryos (75%–100% epiboly) exposed 3hr to the indicated ethanolext levels (0, 28, 55, 86, 104, 172, 344mM) and assessed 2hr after ethanol removal. . Data are mean ± SEM. (D) Dechorionated embryos were treated with 0mM (open bars) or 86mM ethanolext (solid bars) at the onset of the indicated stages (somites = 3–6 somites) and cell death was quantified as in (C). Values are mean ± SD with 6–20 embryos per group. * Significantly differs from 0mM ethanol at p<0.05, using Kruskal-Wallis one-way ANOVA on ranks and Dunn’s pairwise comparison.
Figure 3
Figure 3. Ethanol-Induced Cell Death is Apoptotic
(A, B) The secA5-YFP transgenic line detects annexin V activation. (A) Control embryos exhibit low levels of AnnexinV+ cells (white dots, arrows). (B) In contrast, AnnexinV-YFP+ apoptotic cells are abundant in cranial regions (arrows) following ethanol exposure. Higher magnification (insert) of Annexin-V-YFP+ cells reveals the ring-shaped appearance characteristic of this early apoptotic marker on the membrane surface. (C–E) TUNEL+ Staining. Control embryos (C) have few TUNEL+ cells within cranial and other regions (arrows). In contrast, ethanol treatment (D) significantly increases TUNEL+ cell abundance within cranial regions (arrows) and more caudal populations. (E) Embryo pretreatment with the CaMKII inhibitor myristoylated-AIP prevents the ethanol-induced apoptosis. (F, G) Quantitation of Ethanol-Induced Apoptosis. The number of Annexin-V-YFP+ cells (F) and TUNEL+ cells (G) were significantly increased within cranial regions following ethanol exposure as compared with controls. Values represent the mean ± SEM of 2–4 independent experiments, each having 6–10 (TUNEL) or 20–25 (Annexin-V) embryos per treatment. * p<0.05 vs. control using Kruskal-Wallis ANOVA on ranks. ** p<0.001 vs. control using two-tailed t-test.
Figure 4
Figure 4. Ethanol-Induced Cell Death is CaMKII-Dependent
(A) Embryos exposed to 0mM ethanol have low cell death levels, assessed using acridine orange. (B) Cell death is significantly enhanced in embryos exposed to 86 mM ethanol (arrows). Ethanol-induced cell death in cranial regions is significantly reduced by pretreatment with the intracellular calcium chelator Bapta-AM (C), the calmodulin inhibitor calmidizolium (D), or the CaMKII inhibitor myristoylated-AIP (E).
Figure 5
Figure 5. Quantitation of Calcium-Dependent Cell Death
Acridine orange+ cells were enumerated in cranial region of embryos treated as indicated. Values represent mean ± SD of 2–3 independent experiments, each having 12–20 embryos per treatment. + p=0.041 and * p<0.001 vs. 0mM ethanol using one-way ANOVA followed by Holm-Sidak comparison.
Figure 6
Figure 6. Ethanol Reduces Neural Crest Cellularity
Neural crest populations were visualized using in situ hybridization for crestin expression in embryos treated 3hr with 0mM (A) or 86mM ethanolext (B). Stage-matched embryos are shown. Arrows indicate cranial neural crest populations; * indicates the developing eye. (C) Quantitation of neural crest populations. The numbers of crestin+ cells within the cranial region were counted. Values represent the mean ± SD of 3–5 embryos per treatment. * p<0.001 using two-tailed t-test.
Figure 7
Figure 7. Ethanol Alters Craniofacial Structures
Skeletal elements of control or ethanol-treated zebrafish larvae at 6-days post-fertilization, viewed in ventral (A) or dorsal (B) aspect. Lines indicate cartilage dimensions significantly altered by ethanol; control dimensions are overlayed onto ethanol to highlight their differences. (e) ethmoid plate, (m) mandibular cartilage, (t) trabeculae crania.

Comment in

Similar articles

Cited by

References

    1. Ali S, Champagne DL, Alia A, Richardson MK. Large-scale analysis of acute ethanol exposure in zebrafish development: a critical time window and resilience. PLoS One. 2011;6:e20037. - PMC - PubMed
    1. Battaglia FC. Fetal alcohol syndrome diagnosis, epidimiology, prevention and treatment. Washington, D.C: National Academy Press; 1996.
    1. Bilotta J, Barnett JA, Hancock L, Saszik S. Ethanol exposure alters zebrafish development: a novel model of fetal alcohol syndrome. Neurotox Teratol. 2004;26:737–743. - PubMed
    1. Blader P, Strahle U. Ethanol impairs migration of the prechordal plate in the zebrafish embryo. Dev Biol. 1998;201:185–201. - PubMed
    1. Bradfield JY, West JR, Maider SE. Uptake and elimination of ethanol by young zebrafish embryos. Neurotox Teratol. 2006;28:629–633. - PubMed

Publication types

MeSH terms

Substances

LinkOut - more resources