

Eicosapentaenoic acid/docosahexaenoic acid 1:1 ratio improves histological alterations in obese rats with metabolic syndrome
- PMID: 24512213
- PMCID: PMC3927584
- DOI: 10.1186/1476-511X-13-31
Eicosapentaenoic acid/docosahexaenoic acid 1:1 ratio improves histological alterations in obese rats with metabolic syndrome
Abstract
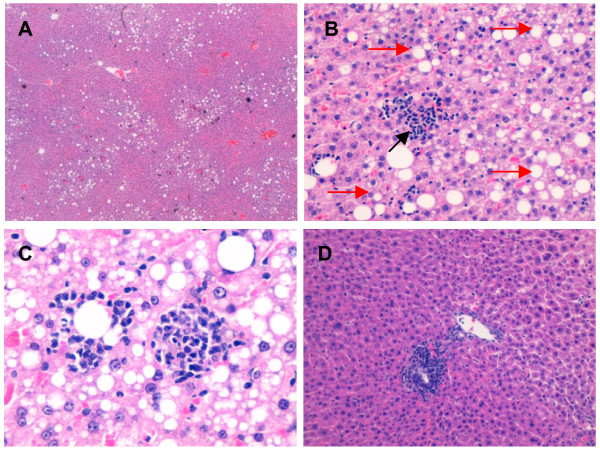
Background: Marine polyunsaturated fatty acids, eicosapentaenoic acid (EPA) and docosahexaenoic acid (DHA) have been associated with improvement in the Metabolic Syndrome (MS). The aim of this study is to evaluate how three fish-oil diets with different eicosapentaenoic acid/docosahexaenoic acid ratios (EPA/DHA ratio) affect the histology of liver, kidney, adipose tissue and aorta in a preliminary morphological study. This work uses an animal model of metabolic syndrome in comparison with healthy animals in order to provide information about the best EPA:DHA ratio to prevent or to improve metabolic syndrome symptoms.
Methods: 35 Wistar rats, as a control, and 35 spontaneously hypertensive obese rats (SHROB) were fed for 13 weeks with 3 different supplementation of fish oil containing EPA and DHA ratios (1:1, 2:1 and 1:2, respectively). All samples were stained with haematoxylin/eosin stain, except aorta samples, which were stained also with Verhoeff and van Gieson's stain. A histological study was carried out to evaluate changes. These changes were statistically analyzed using SPSS IBM 19 software. The quantitative data were expressed by mean ± SD and were compared among groups and treatments using ANOVA with post-hoc tests for parametric data and the U-Mann-Whitney for non-parametric data. Qualitative data were expressed in frequencies, and compared with contingency tables using χ² statistics.
Results: EPA:DHA 1:1 treatment tended to improve the density and the wrinkling of elastic layers in SHROB rats. Only Wistar rats fed with EPA:DHA 1:1 treatment did not show mast cells in adipose tissue and has less kidney atrophy. In both strains EPA:DHA 1:1 treatment improved inflammation related parameters in liver and kidney.
Conclusions: EPA:DHA 1:1 treatment was the most beneficial treatment since improved many histological parameters in both groups of rats.
Figures


Similar articles
-
Effect of n-3 PUFA supplementation at different EPA:DHA ratios on the spontaneously hypertensive obese rat model of the metabolic syndrome.Br J Nutr. 2015 Mar 28;113(6):878-87. doi: 10.1017/S0007114514004437. Epub 2015 Feb 27. Br J Nutr. 2015. PMID: 25720761
-
Healthy effect of different proportions of marine ω-3 PUFAs EPA and DHA supplementation in Wistar rats: Lipidomic biomarkers of oxidative stress and inflammation.J Nutr Biochem. 2015 Nov;26(11):1385-92. doi: 10.1016/j.jnutbio.2015.07.007. Epub 2015 Jul 26. J Nutr Biochem. 2015. PMID: 26320676
-
Dietary Eicosapentaenoic Acid and Docosahexaenoic Acid Ethyl Esters Influence the Gut Microbiota and Bacterial Metabolites in Rats.J Oleo Sci. 2021 Oct 5;70(10):1469-1480. doi: 10.5650/jos.ess21189. Epub 2021 Sep 8. J Oleo Sci. 2021. PMID: 34497184
-
Effects of dietary eicosapentaenoic acid and docosahexaenoic acid supplementation on metabolic syndrome: A systematic review and meta-analysis of data from 33 randomized controlled trials.Clin Nutr. 2021 Jul;40(7):4538-4550. doi: 10.1016/j.clnu.2021.05.025. Epub 2021 Jun 5. Clin Nutr. 2021. PMID: 34229258
-
Omega-3 fatty acids eicosapentaenoic acid and docosahexaenoic acid and their mechanisms of action on apolipoprotein B-containing lipoproteins in humans: a review.Lipids Health Dis. 2017 Aug 10;16(1):149. doi: 10.1186/s12944-017-0541-3. Lipids Health Dis. 2017. PMID: 28797250 Free PMC article. Review.
Cited by
-
Immunomodulatory effect of marine lipids on food allergy.Front Nutr. 2023 Nov 14;10:1254681. doi: 10.3389/fnut.2023.1254681. eCollection 2023. Front Nutr. 2023. PMID: 38035353 Free PMC article. Review.
-
Effects of a Fish Oil Rich in Docosahexaenoic Acid on Cardiometabolic Risk Factors and Oxidative Stress in Healthy Rats.Mar Drugs. 2021 Sep 29;19(10):555. doi: 10.3390/md19100555. Mar Drugs. 2021. PMID: 34677454 Free PMC article.
-
Effects of combined D-fagomine and omega-3 PUFAs on gut microbiota subpopulations and diabetes risk factors in rats fed a high-fat diet.Sci Rep. 2019 Nov 12;9(1):16628. doi: 10.1038/s41598-019-52678-5. Sci Rep. 2019. PMID: 31719544 Free PMC article.
-
Unraveling biochemical pathways affected by mitochondrial dysfunctions using metabolomic approaches.Metabolites. 2014 Sep 25;4(3):831-78. doi: 10.3390/metabo4030831. Metabolites. 2014. PMID: 25257998 Free PMC article. Review.
-
Dietary DHA/EPA Ratio Changes Fatty Acid Composition and Attenuates Diet-Induced Accumulation of Lipid in the Liver of ApoE-/- Mice.Oxid Med Cell Longev. 2018 Nov 14;2018:6256802. doi: 10.1155/2018/6256802. eCollection 2018. Oxid Med Cell Longev. 2018. PMID: 30538803 Free PMC article.
References
-
- Mataix Verdú J. Nutrición y Alimentación Humana. Spain: Ergon; 2009. pp. 1238–1239.
-
- Lluís L, Taltavull N, Muñoz-Cortés M, Sanchez-Martos V, Romeu M, Giralt M. et al.Protective effect of the omega-3 polyunsaturated fatty acids:eicosapentaenoic acid/docosahexaenoic acid 1:1 ratio on cardiovascular disease risk markers in rats. Lipids Health Dis. 2013;12:140. doi: 10.1186/1476-511X-12-140. - DOI - PMC - PubMed
-
- Rueda F, Domingo JC, Mach N. Effect of omega-3 fatty acids and other food supplements on elderly-related pathological processes. Rev Esp Nutr Hum Diet. 2011;15(1):20–29.
Publication types
MeSH terms
Substances
LinkOut - more resources
Full Text Sources
Other Literature Sources
Medical
Research Materials
