

Different patterns of local field potentials from limbic DBS targets in patients with major depressive and obsessive compulsive disorder
- PMID: 24514569
- PMCID: PMC4813757
- DOI: 10.1038/mp.2014.2
Different patterns of local field potentials from limbic DBS targets in patients with major depressive and obsessive compulsive disorder
Abstract
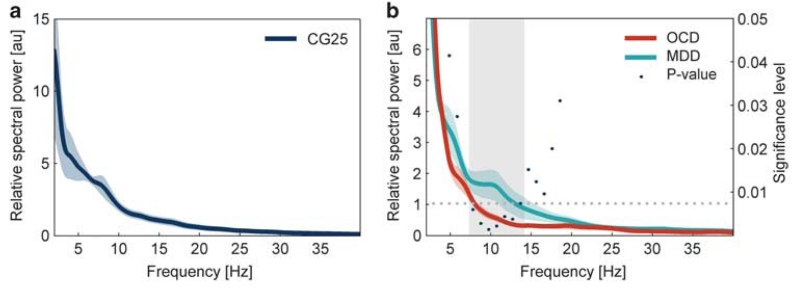
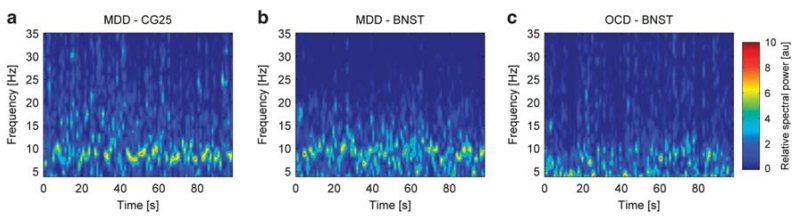
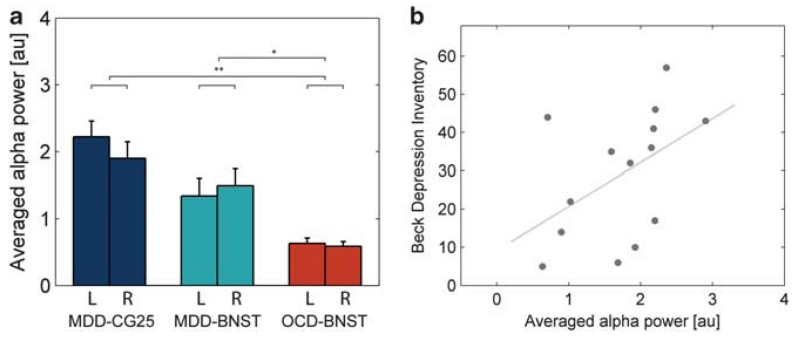
The role of distinct limbic areas in emotion regulation has been largely inferred from neuroimaging studies. Recently, the opportunity for intracranial recordings from limbic areas has arisen in patients undergoing deep brain stimulation (DBS) for neuropsychiatric disorders including major depressive disorder (MDD) and obsessive compulsive disorder (OCD). Here we test the hypothesis that distinct temporal patterns of local field potential (LFP) activity in the human limbic system reflect disease state and symptom severity in MDD and OCD patients. To this end, we recorded LFPs via implanted DBS electrodes from the bed nucleus of stria terminalis (BNST area) in 12 patients (5 OCD, 7 MDD) and from the subgenual cingulate cortex in 7 MDD patients (CG25 area). We found a distinct pattern of oscillatory activity with significantly higher α-power in MDD compared with OCD in the BNST area (broad α-band 8-14 Hz; P<0.01) and a similar level of α-activity in the CG25 area as in the BNST area in MDD patients. The mean α-power correlated with severity of depressive symptoms as assessed by the Beck depression inventory in MDD (n=14, r=0.55, P=0.042) but not with severity of obsessive compulsive symptoms in OCD. Here we show larger α-band activity in MDD patients compared with OCD recorded from intracranial DBS targets. Our results suggest that α-activity in the limbic system may be a signature of symptom severity in MDD and may serve as a potential state biomarker for closed loop DBS in MDD.
Figures
References
-
- Goodman WK, Alterman RL. Deep brain stimulation for intractable psychiatric disorders. Annu Rev Med. 2012;63:511–524. - PubMed
-
- Ackermans L, Duits A, van der Linden C, Tijssen M, Schruers K, Temel Y, et al. Double-blind clinical trial of thalamic stimulation in patients with Tourette syndrome. Brain. 2011;134:832–844. - PubMed
-
- Mayberg HS, Lozano AM, Voon V, McNeely HE, Seminowicz D, Hamani C, et al. Deep brain stimulation for treatment-resistant depression. Neuron. 2005;45:651–660. - PubMed
-
- Muller UJ, Voges J, Steiner J, Galazky I, Heinze HJ, Moller M, et al. Deep brain stimulation of the nucleus accumbens for the treatment of addiction. Ann N Y Acad Sci. 2013;1282:119–128. - PubMed
Publication types
MeSH terms
Grants and funding
LinkOut - more resources
Full Text Sources
Other Literature Sources
Medical
