The genetic architecture of maize height
- PMID: 24514905
- PMCID: PMC3982682
- DOI: 10.1534/genetics.113.159152
The genetic architecture of maize height
Abstract
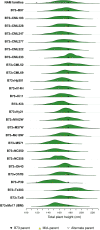
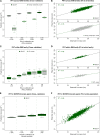
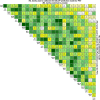
Height is one of the most heritable and easily measured traits in maize (Zea mays L.). Given a pedigree or estimates of the genomic identity-by-state among related plants, height is also accurately predictable. But, mapping alleles explaining natural variation in maize height remains a formidable challenge. To address this challenge, we measured the plant height, ear height, flowering time, and node counts of plants grown in >64,500 plots across 13 environments. These plots contained >7300 inbreds representing most publically available maize inbreds in the United States and families of the maize Nested Association Mapping (NAM) panel. Joint-linkage mapping of quantitative trait loci (QTL), fine mapping in near isogenic lines (NILs), genome-wide association studies (GWAS), and genomic best linear unbiased prediction (GBLUP) were performed. The heritability of maize height was estimated to be >90%. Mapping NAM family-nested QTL revealed the largest explained 2.1 ± 0.9% of height variation. The effects of two tropical alleles at this QTL were independently validated by fine mapping in NIL families. Several significant associations found by GWAS colocalized with established height loci, including brassinosteroid-deficient dwarf1, dwarf plant1, and semi-dwarf2. GBLUP explained >80% of height variation in the panels and outperformed bootstrap aggregation of family-nested QTL models in evaluations of prediction accuracy. These results revealed maize height was under strong genetic control and had a highly polygenic genetic architecture. They also showed that multiple models of genetic architecture differing in polygenicity and effect sizes can plausibly explain a population's variation in maize height, but they may vary in predictive efficacy.
Keywords: GBLUP; height; maize; plant.
Figures


Similar articles
-
The genetic architecture of maize stalk strength.PLoS One. 2013 Jun 20;8(6):e67066. doi: 10.1371/journal.pone.0067066. Print 2013. PLoS One. 2013. PMID: 23840585 Free PMC article.
-
Mapping quantitative trait loci associated with stem-related traits in maize (Zea mays L.).Plant Mol Biol. 2020 Dec;104(6):583-595. doi: 10.1007/s11103-020-01062-3. Epub 2020 Sep 8. Plant Mol Biol. 2020. PMID: 32901412
-
Limits on the reproducibility of marker associations with southern leaf blight resistance in the maize nested association mapping population.BMC Genomics. 2014 Dec 5;15(1):1068. doi: 10.1186/1471-2164-15-1068. BMC Genomics. 2014. PMID: 25475173 Free PMC article.
-
Entering the second century of maize quantitative genetics.Heredity (Edinb). 2014 Jan;112(1):30-8. doi: 10.1038/hdy.2013.6. Epub 2013 Mar 6. Heredity (Edinb). 2014. PMID: 23462502 Free PMC article. Review.
-
Ten Years of the Maize Nested Association Mapping Population: Impact, Limitations, and Future Directions.Plant Cell. 2020 Jul;32(7):2083-2093. doi: 10.1105/tpc.19.00951. Epub 2020 May 12. Plant Cell. 2020. PMID: 32398275 Free PMC article. Review.
Cited by
-
The Use of Targeted Marker Subsets to Account for Population Structure and Relatedness in Genome-Wide Association Studies of Maize (Zea mays L.).G3 (Bethesda). 2016 Aug 9;6(8):2365-74. doi: 10.1534/g3.116.029090. G3 (Bethesda). 2016. PMID: 27233668 Free PMC article.
-
Elucidating the patterns of pleiotropy and its biological relevance in maize.PLoS Genet. 2023 Mar 21;19(3):e1010664. doi: 10.1371/journal.pgen.1010664. eCollection 2023 Mar. PLoS Genet. 2023. PMID: 36943844 Free PMC article.
-
Joint RNA-Seq and miRNA Profiling Analyses to Reveal Molecular Mechanisms in Regulating Thickness of Pod Canopy in Brassica napus.Genes (Basel). 2019 Aug 5;10(8):591. doi: 10.3390/genes10080591. Genes (Basel). 2019. PMID: 31387302 Free PMC article.
-
Fine mapping of candidate quantitative trait loci for plant and ear height in a maize nested-association mapping population.Front Plant Sci. 2022 Aug 4;13:963985. doi: 10.3389/fpls.2022.963985. eCollection 2022. Front Plant Sci. 2022. PMID: 35991429 Free PMC article.
-
Integrating Genomic and Phenomic Approaches to Support Plant Genetic Resources Conservation and Use.Plants (Basel). 2021 Oct 22;10(11):2260. doi: 10.3390/plants10112260. Plants (Basel). 2021. PMID: 34834625 Free PMC article. Review.
References
-
- Andorf C. M., Lawrence C. J., Harper L. C., Schaeffer M. L., Campbell D. A., et al. , 2010. The Locus Lookup tool at MaizeGDB: identification of genomic regions in maize by integrating sequence information with physical and genetic maps. Bioinformatics 26: 434–436. - PubMed
-
- Bardol N., Ventelon M., Mangin B., Jasson S., Loywick V., et al. , 2013. Combined linkage and linkage disequilibrium QTL mapping in multiple families of maize (Zea mays L.) line crosses highlights complementarities between models based on parental haplotype and single locus polymorphism. Theor. Appl. Genet. 126: 2717–2736. - PubMed
-
- Beavis W., Grant D., Albertsen M. and R. Fincher, 1991. Quantitative trait loci for plant height in four maize populations and their associations with qualitative genetic loci. Theor. Appl. Genet. 83: 141–145. - PubMed
-
- Benjamini Y., Hochberg Y., 1995. Controlling the false discovery rate: a practical and powerful approach to multiple testing. J. R. Stat. Soc. B 57: 289–300.
Publication types
MeSH terms
LinkOut - more resources
Full Text Sources
Other Literature Sources

