. 2014 Mar 21;289(12):8579-87.
doi: 10.1074/jbc.M113.507533. Epub 2014 Feb 10.

NO* binds human cystathionine β-synthase quickly and tightly

Affiliations

NO* binds human cystathionine β-synthase quickly and tightly

João B Vicente et al. J Biol Chem. .

Abstract

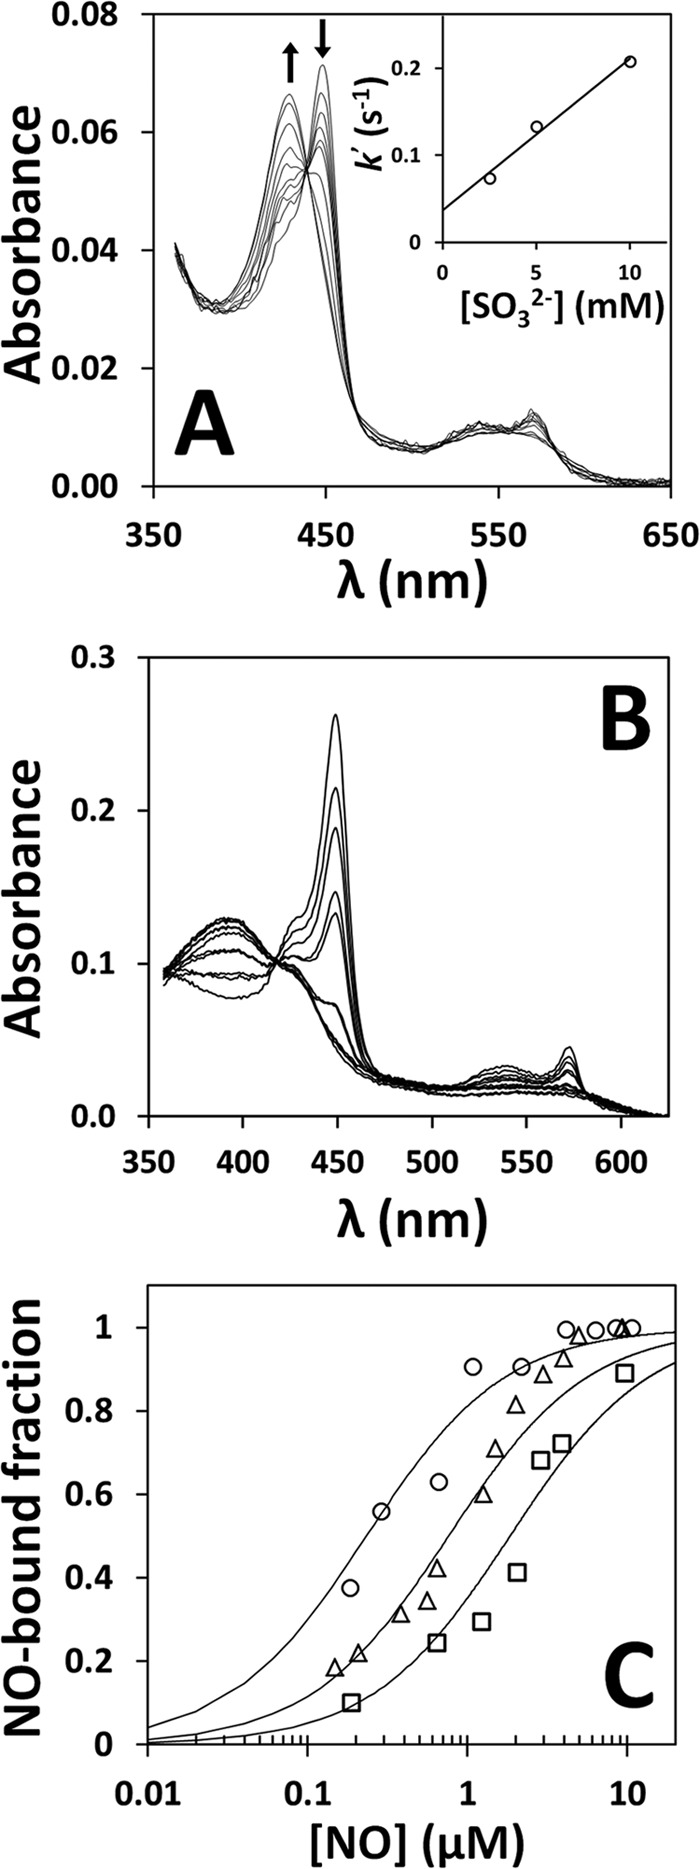
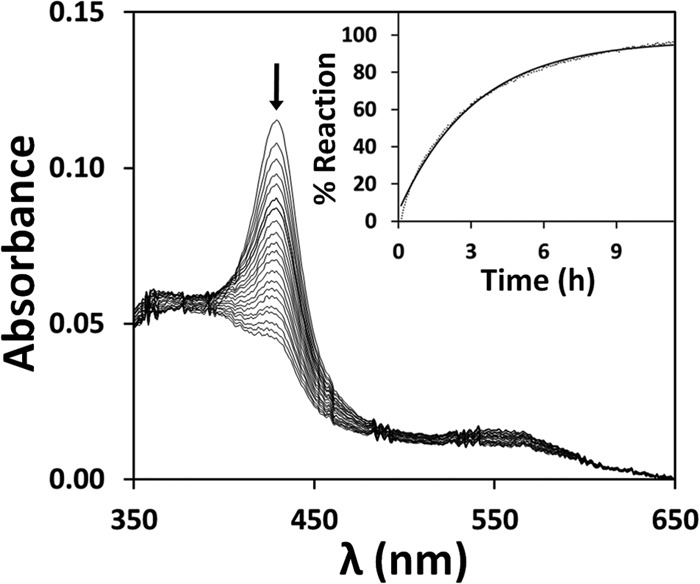
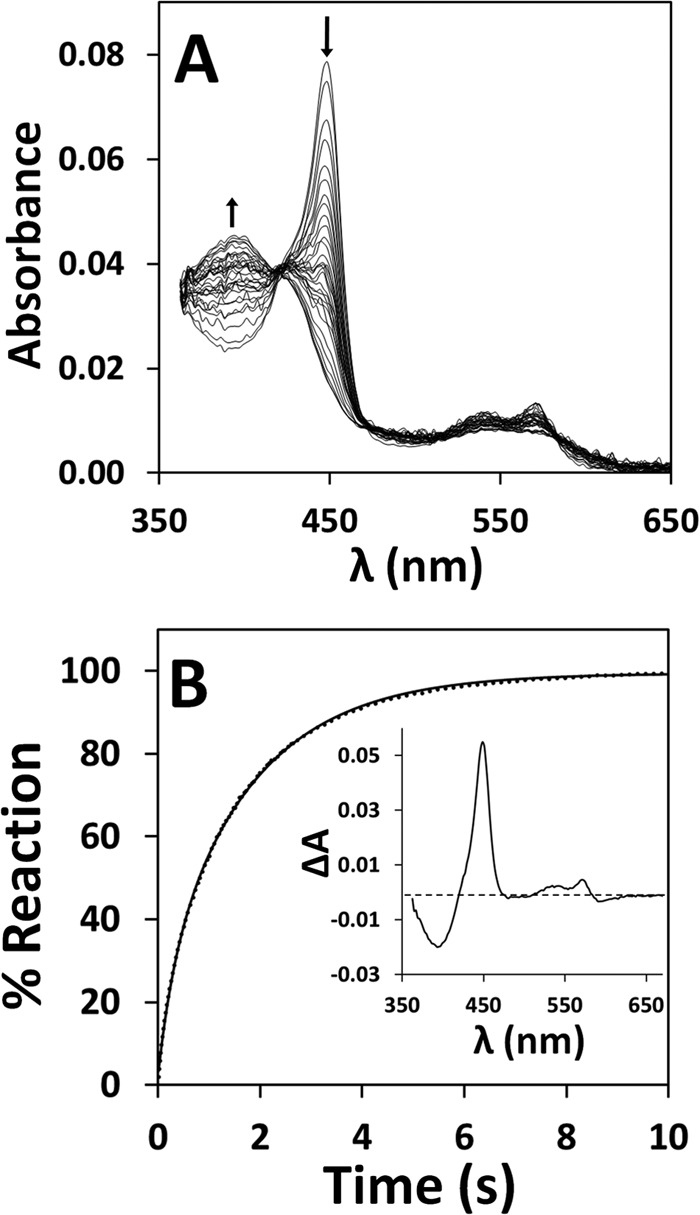
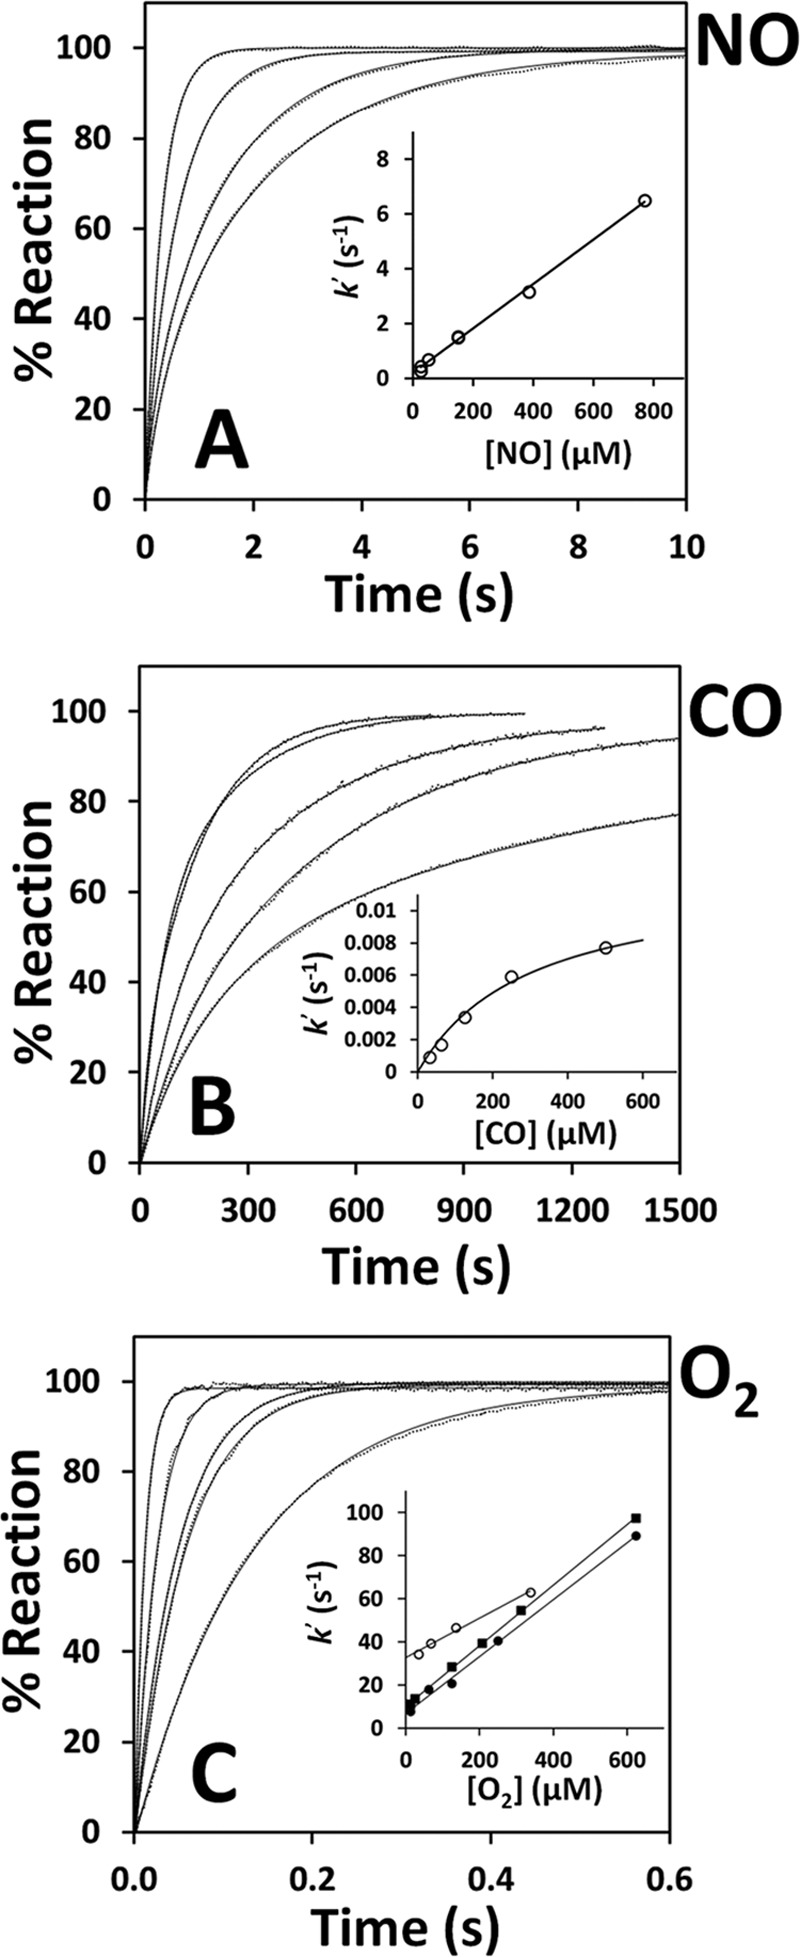
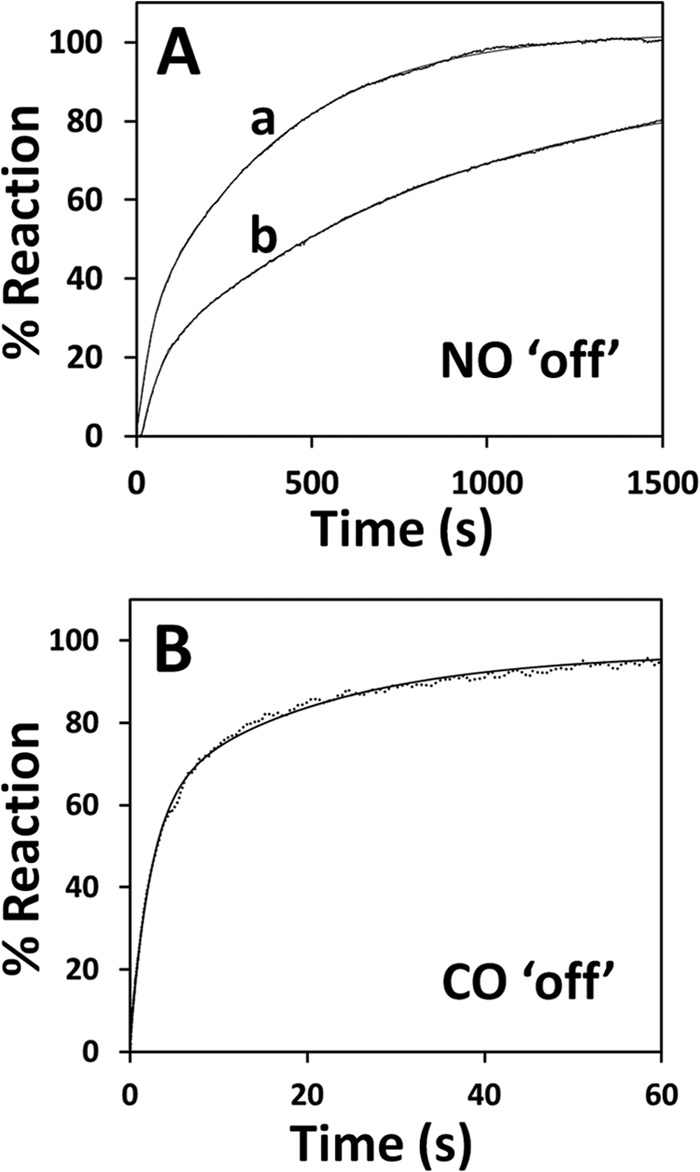
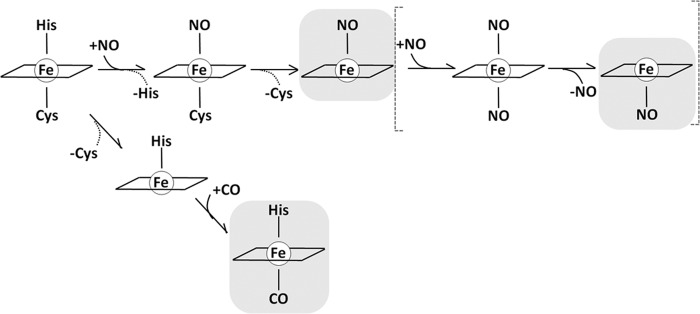
The hexa-coordinate heme in the H2S-generating human enzyme cystathionine β-synthase (CBS) acts as a redox-sensitive regulator that impairs CBS activity upon binding of NO(•) or CO at the reduced iron. Despite the proposed physiological relevance of this inhibitory mechanism, unlike CO, NO(•) was reported to bind at the CBS heme with very low affinity (Kd = 30-281 μm). This discrepancy was herein reconciled by investigating the NO(•) reactivity of recombinant human CBS by static and stopped-flow UV-visible absorption spectroscopy. We found that NO(•) binds tightly to the ferrous CBS heme, with an apparent Kd ≤ 0.23 μm. In line with this result, at 25 °C, NO(•) binds quickly to CBS (k on ∼ 8 × 10(3) m(-1) s(-1)) and dissociates slowly from the enzyme (k off ∼ 0.003 s(-1)). The observed rate constants for NO(•) binding were found to be linearly dependent on [NO(•)] up to ∼ 800 μm NO(•), and >100-fold higher than those measured for CO, indicating that the reaction is not limited by the slow dissociation of Cys-52 from the heme iron, as reported for CO. For the first time the heme of human CBS is reported to bind NO(•) quickly and tightly, providing a mechanistic basis for the in vivo regulation of the enzyme by NO(•). The novel findings reported here shed new light on CBS regulation by NO(•) and its possible (patho)physiological relevance, enforcing the growing evidence for an interplay among the gasotransmitters NO(•), CO, and H2S in cell signaling.

Keywords: Cell Signaling; Enzyme Kinetics; Heme; Hydrogen Sulfide; Redox Regulation.


Figures

FIGURE 1.
FIGURE 1.
Tight binding of NO to human CBS. A, reaction of ferrous CBS (1.4 μm in heme content, before mixing) with sulfite (20 mm before mixing). Temperature = 25 °C. Spectra were recorded at 0.01, 0.5, 1.0, 1.5, 2.0, 2.5, 4.1, 7.8, 15.5, and 27.1 s (arrows depict the direction of absorption changes). Inset, dependence of the observed rate constants on sulfite concentration, yielding k = 1.7 × 101 m−1 s−1. B, NO titration of CBS (2.2 μm in heme), prereduced with 11.3 μm dithionite. Spectra (from two titrations with five data points each) were recorded with ∼2-min intervals, at [NO] = 0.5, 1.1, 1.6, 2.2, 3.2, 4.3, 6.5, 8.6, 10.8, and 13.0 μm. Buffer was 50 mm potassium phosphate, 300 mm KCl, 10% glycerol, 100 μm EDTA, pH 7.0, containing 2 mm glucose, 4 units/ml glucose oxidase, 13 μg/ml catalase, and 60 units/ml SOD. C, NO titrations of ferrous CBS (1.3–2.2 μm in heme) measured at 11.3 μm dithionite (Kd = 0.23 μm, circles), 22.5 μm dithionite (Kd = 0.76 μm, triangles), 45 μm dithionite (Kd = 1.84 μm, squares).
FIGURE 2.
FIGURE 2.
Reductive nitrosylation of ferric CBS. Spectra collected at 25 °C over 12 h, after anaerobic addition of 1.08 mm NO to 1.2 μm (heme content) ferric CBS (in 50 mm potassium phosphate, 300 mm KCl, 10% glycerol, 100 μm EDTA, pH 7.0, containing 4 units/ml glucose oxidase, 13 μg/ml catalase, 60 units/ml SOD, and 2 mm glucose). Spectra were recorded every 10 min (arrow depicts the direction of absorption changes). Inset, reaction time course (dotted line) and its best fit (full line) to a single exponential (k′ = 0.32 h−1).
FIGURE 3.
FIGURE 3.
Kinetics of NO binding to ferrous CBS. A, spectra collected over 10 s after mixing 1.6 μm ferrous CBS (in heme content) with 100 μm NO at 25 °C, in 50 mm potassium phosphate, 300 mm KCl, 10% glycerol, 100 μm EDTA, pH 7.0, containing 4 units/ml glucose oxidase, 13 μg/ml catalase, 60 units/ml SOD, and 2 mm glucose. Arrows depict the direction of absorption changes. B, reaction time course (dotted line) and its best fit (full line) to the sum of two exponentials (k1 = 3.2 s−1 and k2 = 0.56 s−1, accounting for 20 and 80% of the overall amplitude, respectively). Inset, optical transition as obtained by global fit analysis.
FIGURE 4.
FIGURE 4.
Reaction of ferrous CBS with NO, CO, and O2. Reactions were investigated at 25 °C in 50 mm potassium phosphate, 300 mm KCl, 10% glycerol, 100 μm EDTA, pH 7.0, containing 2 mm glucose, 4 units/ml glucose oxidase, 13 μg/ml catalase, and SOD (6 units/ml for NO and CO assays and 6–90 units/ml for O2 assays). A, normalized absorption changes measured at 449 nm after mixing ferrous CBS (1.6 μm in heme, before mixing) with NO (770, 300, 100, and 50 μm before mixing, from left to right). Traces (dotted lines) are shown with their best fit (full lines) to the sum of two exponentials. Inset, [NO] dependence of the rate constant relative to the major kinetic phase, yielding k ∼ 8 × 10³ m−1 s−1. B, reaction of ferrous CBS (2.6 μm in heme, before mixing) with CO (1000, 500, 250, 125 and 62.5 μm before mixing, from left to right). Traces (dotted lines) are shown with their best fit (full lines) to the sum of two exponentials. Inset, [CO] dependence of the rate constant relative to the major kinetic phase, yielding klim = 0.012 s−1. C, normalized absorption changes measured at 449 nm after mixing ferrous CBS (1.4 μm in heme, before mixing) with O2 (1250, 500, 250, 125, and 25 μm before mixing, from left to right). Traces (dotted lines) are shown with their best fit (full lines) to a single exponential. Inset, [O2] dependence of the rate constant measured at [SOD] = 6 units/ml (open circles, k ∼ 9.2 × 10⁴ m−1 s−1, k0 ∼ 32.6 s−1), 60 units/ml (filled squares, k ∼ 1.4 × 10⁵ m−1 s−1, k0 ∼ 10.1 s−1), and 90 units/ml (filled circles, k ∼ 1.3 × 10⁵ m−1 s−1, k0 ∼ 6.8 s−1).
FIGURE 5.
FIGURE 5.
Dissociation of NO and CO from ferrous CBS. Reactions were investigated at 25 °C in 50 mm potassium phosphate, 300 mm KCl, 10% glycerol, 100 μm EDTA, pH 7.0, containing 2 mm glucose, 4 units/ml glucose oxidase, 13 μg/ml catalase, and SOD (60 units/ml for NO dissociation and 6 units/ml for CO dissociation). A, NO dissociation measured after mixing NO-bound ferrous CBS (2 μm in heme, before mixing) with CO-equilibrated buffer containing 45 mm dithionite (line a, 422 nm) or O2-equilibrated buffer (line b, 426 nm). Fitted rate constant (percentage of the overall amplitude): line a, k1 = 0.05 s−1 (20%) and k2 = 0.002 s−1 (80%); line b, k1 = 0.016 s−1 (25%) and k2 = 0.001 s−1 (75%). B, CO dissociation measured after mixing CO-bound ferrous CBS (1.8 μm in heme, before mixing) with 1 mm NO (before mixing; λ = 415 nm). Fitted rate constant (percentage of the overall amplitude): k1 = 0.44 s−1 (60%) and k2 = 0.05 s−1 (40%).
FIGURE 6.
FIGURE 6.
Mechanisms for NO and CO binding to CBS.

References

    1. Kabil O., Banerjee R. (2014) Enzymology of H2S biogenesis, decay and signaling. Antioxid. Redox Signal. 20, 770–782 - PMC - PubMed
    1. Kajimura M., Fukuda R., Bateman R. M., Yamamoto T., Suematsu M. (2010) Interactions of multiple gas-transducing systems: hallmarks and uncertainties of CO, NO, and H2S gas biology. Antioxid. Redox Signal. 13, 157–192 - PMC - PubMed
    1. Mustafa A. K., Gadalla M. M., Snyder S. H. (2009) Signaling by gasotransmitters. Sci. Signal. 2, re2. - PMC - PubMed
    1. Li L., Hsu A., Moore P. K. (2009) Actions and interactions of nitric oxide, carbon monoxide and hydrogen sulphide in the cardiovascular system and in inflammation: a tale of three gases. Pharmacol. Ther. 123, 386–400 - PubMed
    1. Kabil O., Banerjee R. (2010) Redox biochemistry of hydrogen sulfide. J. Biol. Chem. 285, 21903–21907 - PMC - PubMed

Publication types

LinkOut - more resources