. 2014 Mar 21;289(12):8312-25.
doi: 10.1074/jbc.M113.545301. Epub 2014 Feb 10.

The 2-oxoacid dehydrogenase complexes in mitochondria can produce superoxide/hydrogen peroxide at much higher rates than complex I

Affiliations

The 2-oxoacid dehydrogenase complexes in mitochondria can produce superoxide/hydrogen peroxide at much higher rates than complex I

Casey L Quinlan et al. J Biol Chem. .

Abstract

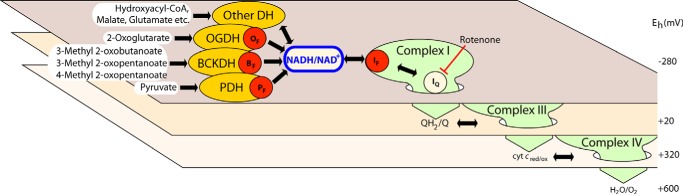
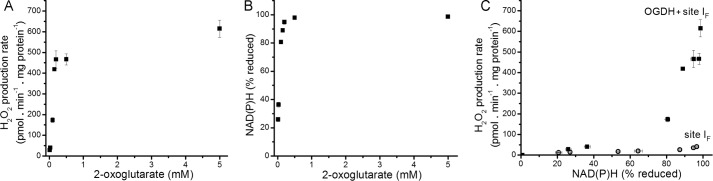
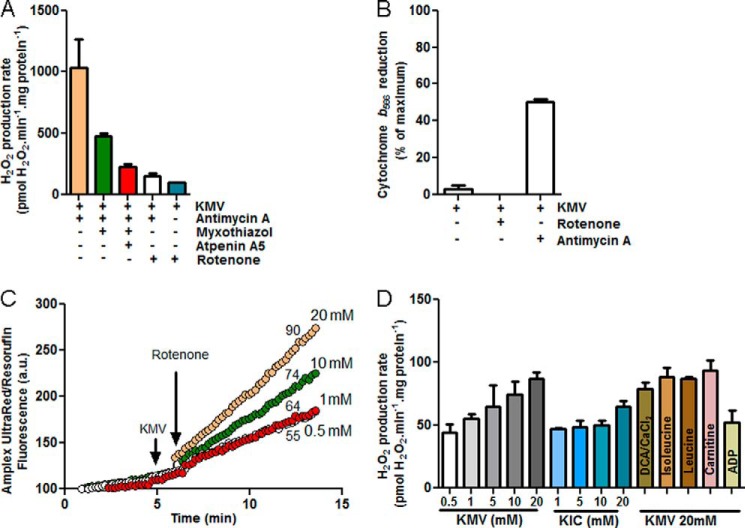
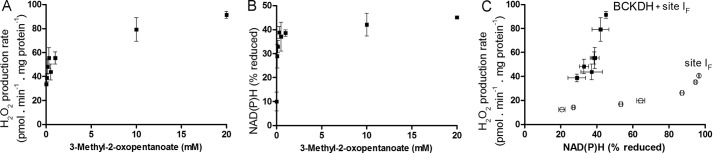
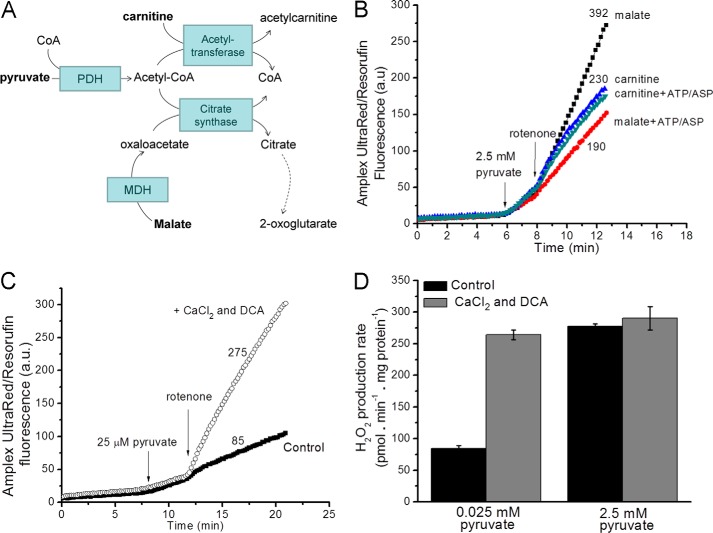
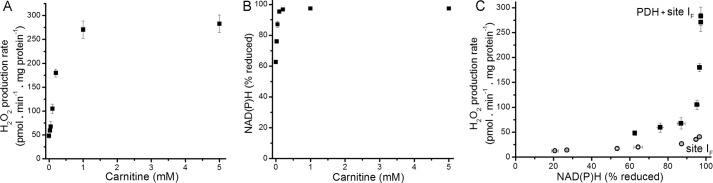
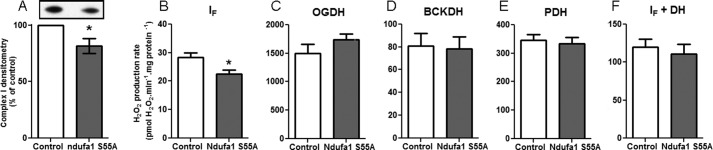
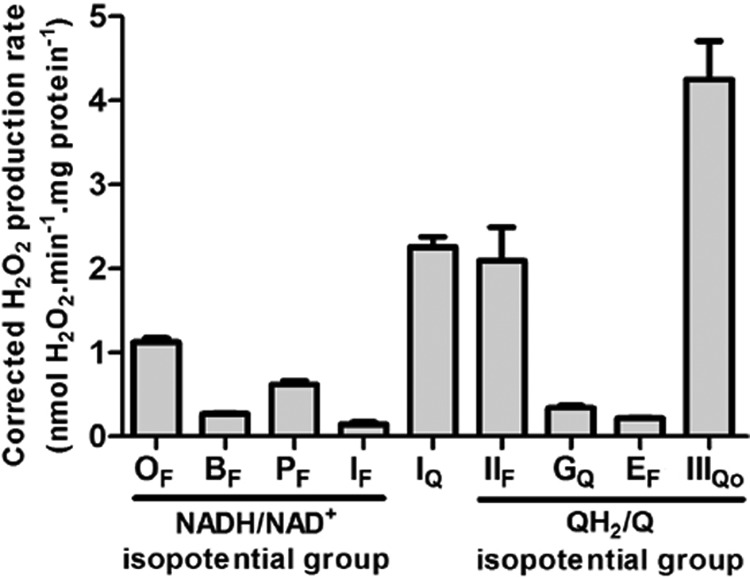
Several flavin-dependent enzymes of the mitochondrial matrix utilize NAD(+) or NADH at about the same operating redox potential as the NADH/NAD(+) pool and comprise the NADH/NAD(+) isopotential enzyme group. Complex I (specifically the flavin, site IF) is often regarded as the major source of matrix superoxide/H2O2 production at this redox potential. However, the 2-oxoglutarate dehydrogenase (OGDH), branched-chain 2-oxoacid dehydrogenase (BCKDH), and pyruvate dehydrogenase (PDH) complexes are also capable of considerable superoxide/H2O2 production. To differentiate the superoxide/H2O2-producing capacities of these different mitochondrial sites in situ, we compared the observed rates of H2O2 production over a range of different NAD(P)H reduction levels in isolated skeletal muscle mitochondria under conditions that favored superoxide/H2O2 production from complex I, the OGDH complex, the BCKDH complex, or the PDH complex. The rates from all four complexes increased at higher NAD(P)H/NAD(P)(+) ratios, although the 2-oxoacid dehydrogenase complexes produced superoxide/H2O2 at high rates only when oxidizing their specific 2-oxoacid substrates and not in the reverse reaction from NADH. At optimal conditions for each system, superoxide/H2O2 was produced by the OGDH complex at about twice the rate from the PDH complex, four times the rate from the BCKDH complex, and eight times the rate from site IF of complex I. Depending on the substrates present, the dominant sites of superoxide/H2O2 production at the level of NADH may be the OGDH and PDH complexes, but these activities may often be misattributed to complex I.

Keywords: 2-Oxoglutarate Dehydrogenase Complex; Branched-chain 2-Oxoacid Dehydrogenase Complex; Branched-chain Ketoacid Dehydrogenase; Mitochondria; NADH Autofluorescence; Pyruvate Dehydrogenase Complex; Rat; Reactive Oxygen Species (ROS); Skeletal Muscle; α-Ketoglutarate Dehydrogenase.


Figures

FIGURE 1.
FIGURE 1.
The NADH/NAD+ isopotential group and its component superoxide/H2O2-producing enzymes. The three planes represent different isopotential groups of redox centers in mitochondria. Each group contains multiple redox centers operating at about the same redox potential (Eh): centers around NADH/NAD+ at Eh ∼ −280 mV, around QH2/Q at Eh ∼ +20 mV, and around cytochrome c at Eh ∼ +320 mV (34). The normal flow of electrons from substrate dehydrogenases through NADH and the respiratory complexes of the electron transport chain to oxygen are indicated by the large green arrows dropping down through the isopotential planes. Electrons from NAD-linked substrates enter the NADH/NAD+ pool at Eh ∼ −280 mV through NAD-linked dehydrogenases (DH) including the OGDH, BCKDH, and PDH complexes and flow into complex I (site IF). In the absence of rotenone they then drop down via site IQ to QH2/Q in the next isopotential pool through complex III to cytochrome c and ultimately to their final acceptor, oxygen. In the presence of rotenone (red blunted arrow) other sites of superoxide and H2O2 production are fully oxidized and, therefore, do not leak electrons to O2, and only the sites in the NADH/NAD+ isopotential pool are active. These sites (red dots) are site IF, the flavin of the OGDH complex (OF), the flavin of the BCKDH complex (BF), and the flavin of the PDH complex (PF) (see Ref. 26).
FIGURE 2.
FIGURE 2.
Superoxide/H2O2 production with malate as substrate; complex I and the OGDH complex. A, Amplex UltraRed traces illustrate that H2O2 production rates with 5 mm malate as substrate were decreased by the addition of 2.5 mm ATP and 1.5 mm aspartate. Mitochondria were suspended in non-phosphorylating medium, and 4 μm rotenone was added where indicated. A representative trace is shown; numbers indicate mean rates in pmol of H2O2·min−1·mg of protein−1 from four replicates. a.u., arbitrary units. B, complex I activity measured in alamethicin-permeabilized mitochondria as the rotenone-sensitive NADH:Q-oxidoreductase activity at 30 °C was unaffected by addition of ATP plus aspartate. C, schematic to illustrate that in isolated mitochondria ATP and aspartate may indirectly inhibit the OGDH complex by decreasing its substrates 2-oxoglutarate (through aspartate aminotransferase (AAT)) and CoA (through inhibition of succinate thiokinase), increasing its inhibitory product succinyl CoA (through inhibition of succinate thiokinase) and through direct inhibitory effects of ATP on the enzyme. D, dependence of superoxide/H2O2 production on the redox state of NAD(P)H (measured by autofluorescence). Malate was titrated from 20 μm–5 mm in the presence of 4 μm rotenone either in the presence or absence of 1.5 mm aspartate and 2.5 mm ATP. Data in A are representative traces. Data in B and D are the means ± S.E. (n = 3).
FIGURE 3.
FIGURE 3.
Generation of superoxide and H2O2 by the 2-oxoglutarate dehydrogenase complex. The complex contains multiple copies of the three major components: thiamin pyrophosphate (TPP)-dependent E1, E2, which contains the lipoyl group (lip), and E3, which contains FAD. Side reactions involving the E3-bound FAD and the E2-bound lipoyl residues when NAD is limiting are shown in red. Oxidation of FADH2 by O2 can generate superoxide or H2O2 (19–21). When it generates superoxide, the resulting FADH* can reduce lipoyl residues to thiyl radicals (19, 50), which may inactivate E1 (dashed line) or dismutate (arrows to the reduced and oxidized lipoyl species).
FIGURE 4.
FIGURE 4.
The properties of superoxide/H2O2 production by the OGDH complex. A, typical Amplex UltraRed traces indicate that mitochondria suspended in non-phosphorylating medium with 2.5 mm 2-oxoglutarate (2-OG) as substrate generated H2O2 at relatively low rates in the absence of the positive regulator ADP. Rates were greatly enhanced by the addition of 4 μm rotenone and were dependent on the ADP concentration. a.u., arbitrary units. B, mean rates of H2O2 production with 2.5 mm 2-oxoglutarate and 4 μm rotenone in the presence of either 2.5 mm ATP or 2.5 mm ADP. Data are the mean ± S.E. (n = 3). C, Effect of 1 mm malonate on the rates of H2O2 production with 2.5 mm 2-oxoglutarate as substrate in the presence of 2.5 mm ADP. D, effect of 2 mm succinyl phosphonate on H2O2 production rates in intact and alamethicin-permeabilized mitochondria. In the permeabilized mitochondria, 50 μm 2-oxoglutarate was oxidized in the presence of 100 μm CoA. In the intact mitochondria, 50 μm 2-oxoglutarate was oxidized in the presence of 2.5 mm ADP and 4 μm rotenone. E, Amplex UltraRed traces show the effect of different concentrations of KMV in the presence of 2.5 mm 2-oxoglutarate and 2.5 mm ADP. F, mean rates of H2O2 production when OGDH was inhibited by increasing concentrations of 2-methyl-3-oxopentanoate in the presence of 2.5 mm 2-oxoglutarate and 2.5 mm ADP. Data are the means ± S.E. (n = 3). Panels A, C, D, and E show representative traces; additions are indicated by arrows; numbers indicate mean rates in pmol of H2O2·min−1·mg of protein−1 (n ≥ 3).
FIGURE 5.
FIGURE 5.
Relationship between the observed rate of H2O2 production by the OGDH complex and the reduction state of NAD(P)H. A, dependence of the rate of H2O2 production on 2-oxoglutarate concentration in non-phosphorylating medium in the presence of 2.5 mm ADP after the addition of 4 μm rotenone. B, dependence of %NAD(P)H reduction on 2-oxoglutarate concentration in non-phosphorylating medium in the presence of 2.5 mm ADP after the addition of rotenone (100% reduction was subsequently established by addition of 5 mm malate). C, relationship between the observed rate of H2O2 production from the OGDH complex (plus site IF) and NAD(P)H reduction state (filled squares), obtained by combining panels A and B; open symbols are the replotted data for site IF alone from Fig. 2D. Where not visible, error bars are contained within the points. Data are the means ± S.E. (n = 4).
FIGURE 6.
FIGURE 6.
The branched-chain 2-oxoacid dehydrogenase complex produces superoxide/H2O2. A, mean rates of H2O2 production with 20 mm KMV in non-phosphorylating medium in the presence of 2 μm antimycin A (beige bar), 2 μm antimycin A plus 2 μm myxothiazol (green bar), 2 μm antimycin A, 2 μm myxothiazol and 2 μm atpenin A5 (red bar), 2 μm antimycin A plus 4 μm rotenone (white bar), and 4 μm rotenone (blue bar). Data are the means ± S.E. (n = 3). B, cytochrome b566 reduction state in non-phosphorylating medium in the presence of 20 mm 3-methyl-2-oxopentanoate plus 4 μm rotenone or plus 2 μm antimycin A. C, typical Amplex UltraRed traces indicate that mitochondria suspended in non-phosphorylating medium with different concentrations of 3-methyl-2-oxopentanoate as substrate generated H2O2. Rates were greatly enhanced by the addition of 4 μm rotenone. a.u., arbitrary units. Arrows indicate additions; numbers indicate mean rates in pmol of H2O2·min−1·mg of protein−1 (n ≥ 3). D, mean rates of H2O2 production in non-phosphorylating medium in the presence of the branched-chain 2-oxoacids KMV or KIC at different concentrations and with 20 mm 3-methyl-2-oxopentanoate in the presence of 4 μm rotenone and 450 nm free Ca2+ plus 1 mm dichloroacetate (DCA), 1 mm isoleucine, 1 mm leucine, 1 mm carnitine, or 2.5 mm ADP. Data are the means ± S.E. (n = 3).
FIGURE 7.
FIGURE 7.
Relationship between the observed rate of H2O2 production by the BCKDH complex and the reduction state of NAD(P)H. A, dependence of the rate of H2O2 production on KMV concentration in non-phosphorylating medium after the addition of 4 μm rotenone. B, dependence of %NAD(P)H reduction on 3-methyl-2-oxopentanoate concentration in non-phosphorylating medium after the addition of rotenone (100% reduction was subsequently established by the addition of 5 mm malate and glutamate). C, relationship between the observed rate of H2O2 production from the BCKDH complex (plus site IF) and NAD(P)H reduction state (filled squares) obtained by combining panels A and B; the open symbols are the replotted data for site IF alone from Fig. 2D. Where not visible, error bars are contained within the points. Data are the means ± S.E. (n = 4).
FIGURE 8.
FIGURE 8.
Experimental design for measuring superoxide/H2O2 production from the pyruvate dehydrogenase complex. A, carbon flows with pyruvate plus carnitine or pyruvate plus malate as substrates. MDH, malate dehydrogenase. B, H2O2 production in non-phosphorylating medium with 2.5 mm pyruvate plus 5 mm malate or 2.5 mm pyruvate plus 5 mm carnitine as substrate. The contribution from other sites during oxidation of these substrate pairs was assessed by the sensitivity of the rates to 2.5 mm ATP and 1.5 mm aspartate (ASP). 4 μm rotenone was added where indicated. a.u., arbitrary units. C, Amplex UltraRed traces in non-phosphorylating medium show that at a low pyruvate concentration (25 μm) the rates of H2O2 production were low. The presence of 450 nm free Ca2+ and 1 mm dichloroacetate (DCA) increased the observed rate at low pyruvate concentration. D, rates of H2O2 production in non-phosphorylating medium at low (25 μm) and high (2.5 mm) pyruvate concentrations in the presence and absence of 450 nm free Ca2+ and 1 mm dichloroacetate. Data are the means ± S.E. (n = 3). Panels B and C show representative traces; numbers indicate mean rates in pmol of H2O2·min−1·mg of protein−1 (n = 3).
FIGURE 9.
FIGURE 9.
Relationship between the observed rate of H2O2 production by the PDH complex and the reduction state of NAD(P)H. A, dependence of the rate of H2O2 production on carnitine concentration in non-phosphorylating medium in the presence of 2.5 mm pyruvate and 4 μm rotenone. B, dependence of %NAD(P)H reduction on carnitine concentration in non-phosphorylating medium after the addition of rotenone (100% reduction was subsequently established by the addition of 5 mm malate). C, relationship between the observed rate of H2O2 production from the PDH complex (plus site IF) and the NAD(P)H reduction state (filled squares), obtained by combining panels A and B; the open symbols are the data for site IF alone from Fig. 2D. Where not visible, error bars are contained within the points. Data are the means ± S.E. (n = 3).
FIGURE 10.
FIGURE 10.
Superoxide/H2O2 production by mitochondria from complex I-deficient Ndufa1S55A/Y mice. A, densitometry of Western blots of mitochondria from wild type and mutant mice probed for the 75-kDa NDUFS1 subunit of complex I (inset, representative Western blot. Left, control; right, NdufaS55A/Y). B–F, superoxide/H2O2 generation in non-phosphorylating medium after the addition of 4 μm rotenone by mitochondria from control (white bars) or complex I deficient (NdufaS55A/Y) mice (gray bars) in the presence of 5 mm malate, 2.5 mm ATP, and 1.5 mm aspartate (B), 2.5 mm 2-oxoglutarate and 2.5 mm ADP (C), 20 mm 3-methyl-2-oxopentanoate (D), 2.5 mm pyruvate and 5 mm carnitine (E), and 5 mm malate (F). DH, NADH dehydrogenases. Data in A are expressed as % of paired control from five independent paired skeletal muscle mitochondrial preparations; error bars indicate 95% confidence limits; *, p < 0.05 by 95% confidence interval. Data in B–F are the means ± S.E. (n = 5); *, p < 0.05 by Student's t test.
FIGURE 11.
FIGURE 11.
Maximum rates of superoxide/H2O2 production from characterized sites of the mitochondrial respiratory chain. The components of the NADH/NAD+ isopotential group are: OF, flavin site of 2-oxoglutarate dehydrogenase; BF, flavin site of branched-chain 2-oxoacid dehydrogenase; PF, flavin site of pyruvate dehydrogenase; IF, flavin site of complex I. The ubiquinone binding site of complex I (site IQ) is between isopotential groups. The components of the QH2/Q isopotential group are: IIF, flavin site of complex II; GQ, quinone site of mitochondrial glycerol-3-phosphate dehydrogenase; EF, flavin site of the electron transferring flavoprotein/ETF:ubiquinone oxidoreductase system; IIIQo, Qo binding site of complex III. All data were mathematically corrected for matrix peroxidase activity using the 1-chloro-2,4-dinitrobenzene correction described under “Experimental Procedures.” Data for OF, BF, PF, and IF are from Figs. 5C, 7C, 9C, and 2D (plus aspartate/ATP); other sites are replotted from (16). The maximum rates from OF, BF, and PF were corrected by subtracting the rate from site IF at the same NAD(P)H reduction level. Data are the means ± S.E. (n ≥ 3).

References

    1. Hansford R. G., Hogue B. A., Mildaziene V. (1997) Dependence of H2O2 formation by rat heart mitochondria on substrate availability and donor age. J. Bioenerg. Biomembr. 29, 89–95 - PubMed
    1. Barja G., Herrero A. (1998) Localization at complex I and mechanism of the higher free radical production of brain nonsynaptic mitochondria in the short-lived rat than in the longevous pigeon. J. Bioenerg. Biomembr. 30, 235–243 - PubMed
    1. Kushnareva Y., Murphy A. N., Andreyev A. (2002) Complex I-mediated reactive oxygen species generation. Modulation by cytochrome c and NAD(P)+ oxidation-reduction state. Biochem. J. 368, 545–553 - PMC - PubMed
    1. St-Pierre J., Buckingham J. A., Roebuck S. J., Brand M. D. (2002) Topology of superoxide production from different sites in the mitochondrial electron transport chain. J. Biol. Chem. 277, 44784–44790 - PubMed
    1. Andreyev A. Y., Kushnareva Y. E., Starkov A. A. (2005) Mitochondrial metabolism of reactive oxygen species. Biochemistry 70, 200–214 - PubMed

Publication types