Comparative Study
. 2014 Mar 10;32(8):774-82.
doi: 10.1200/JCO.2013.51.8886. Epub 2014 Feb 10.

Extent of resection of glioblastoma revisited: personalized survival modeling facilitates more accurate survival prediction and supports a maximum-safe-resection approach to surgery

Affiliations
Comparative Study

Extent of resection of glioblastoma revisited: personalized survival modeling facilitates more accurate survival prediction and supports a maximum-safe-resection approach to surgery

Nicholas F Marko et al. J Clin Oncol. .

Abstract

Purpose: Approximately 12,000 glioblastomas are diagnosed annually in the United States. The median survival rate for this disease is 12 months, but individual survival rates can vary with patient-specific factors, including extent of surgical resection (EOR). The goal of our investigation is to develop a reliable strategy for personalized survival prediction and for quantifying the relationship between survival, EOR, and adjuvant chemoradiotherapy.

Patients and methods: We used accelerated failure time (AFT) modeling using data from 721 newly diagnosed patients with glioblastoma (from 1993 to 2010) to model the factors affecting individualized survival after surgical resection, and we used the model to construct probabilistic, patient-specific tools for survival prediction. We validated this model with independent data from 109 patients from a second institution.

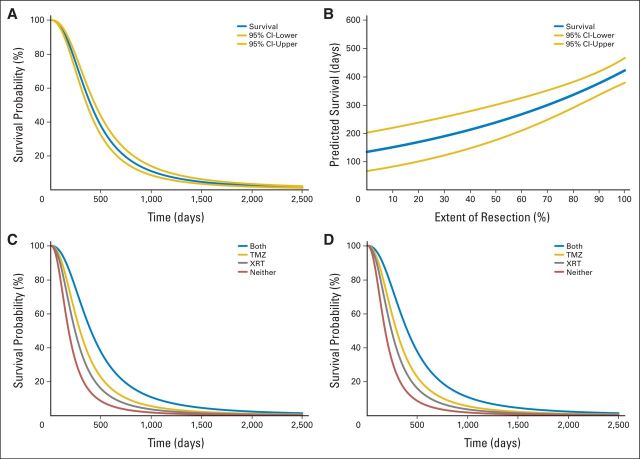
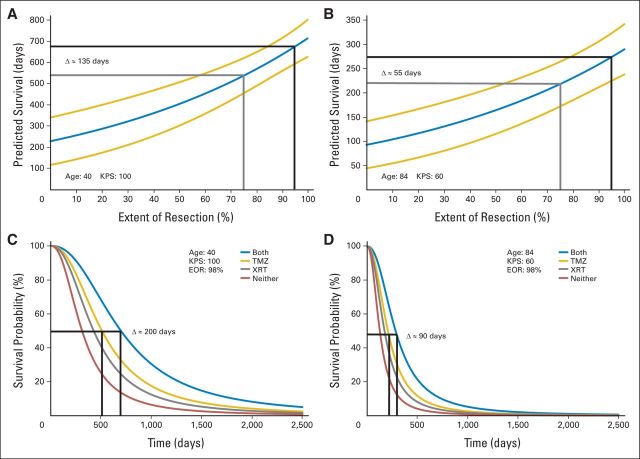
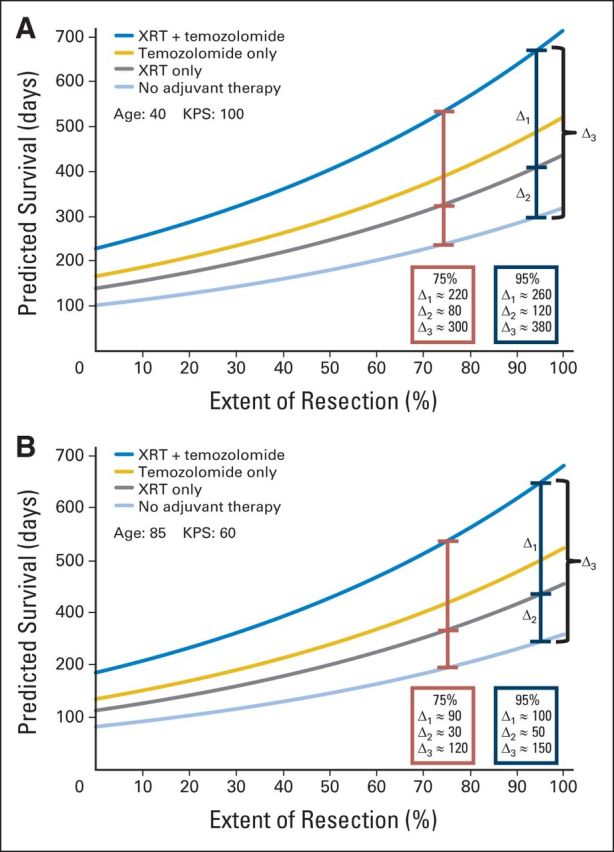
Results: AFT modeling using age, Karnofsky performance score, EOR, and adjuvant chemoradiotherapy produced a continuous, nonlinear, multivariable survival model for glioblastoma. The median personalized predictive error was 4.37 months, representing a more than 20% improvement over current methods. Subsequent model-based calculations yield patient-specific predictions of the incremental effects of EOR and adjuvant therapy on survival.

Conclusion: Nonlinear, multivariable AFT modeling outperforms current methods for estimating individual survival after glioblastoma resection. The model produces personalized survival curves and quantifies the relationship between variables modulating patient-specific survival. This approach provides comprehensive, personalized, probabilistic, and clinically relevant information regarding the anticipated course of disease, the overall prognosis, and the patient-specific influence of EOR and adjuvant chemoradiotherapy. The continuous, nonlinear relationship identified between expected median survival and EOR argues against a surgical management strategy based on rigid EOR thresholds and instead provides the first explicit evidence supporting a maximum safe resection approach to glioblastoma surgery.


Conflict of interest statement

Authors' disclosures of potential conflicts of interest and author contributions are found at the end of this article.

Figures

Fig 1.
Fig 1.
Personalized survival profile for a hypothetical patient. This figure depicts the four primary curve sets that comprise a patient-specific survival profile constructed using this model. The specific curves used in this example are for a hypothetical 72-year-old patient with a Karnofsky performance score (KPS) of 80. (A) Survival curve. This curve depicts a patient's estimated probability of survival at any time in days (gold lines, 95% CIs). It can be used to calculate the estimated survival for any percentile (including the median, where p(x) = 0.5. It presents the most comprehensive survival information but requires that all covariates in the model be known. Here, extent of resection (EOR) of gadolinium-enhancing (T1) tumor is 98%, cranial radiotherapy (XRT) is positive, and temozolomide-based chemotherapy (TMZ) is positive. This curve is useful to determine survival rates either preoperatively (when the plan for adjuvant therapy is known and the surgeon can estimate the anticipated extent of resection) or postoperatively (when all values are known explicitly). (B) Survival versus EOR curve. This curve presents estimated median survival as a function of EOR (gold lines, 95% CIs). This curve is particularly useful preoperatively to a surgeon attempting to determine the incremental survival advantages associated with increases in EOR (Fig 2, application details). Here, XRT is positive and TMZ is positive. (C) Survival versus adjuvant therapy curves. This is the family of survival curves (similar to A) generated when all possible combinations of XRT and TMZ variables are simulated. It can be used to calculate the estimated survival for any percentile [including the median, where p(x) = 0.5] when various adjuvant therapy strategies are applied. Although adjuvant chemoradiotherapy is currently considered standard of care, individual circumstances or patient preferences may require assessment of the individualized survival advantages of alternate adjuvant strategies. This curve is useful for investigating these relationships and informing individualized treatment plans. Here EOR is 98%. (D) Survival, EOR, and adjuvant therapy curve. Combining the simulations used for (B) and (C) produces a family of curves stratified by adjuvant therapy strategy for which the survival estimate is a function of EOR. This family of curves provides a considerable amount of clinically relevant information using relatively little specified data; only the values of the invariant parameters in the model (age and KPS) are required and the rest are simulated using the model for all possible covariate values. This representation, which simulates and then summarizes the effects of all of the modifiable factors in the survival equation, is useful preoperatively to inform survival implications of various combinations of surgical resection strategies and adjuvant therapy modalities.
Fig 2.
Fig 2.
Personalized survival effects of extent of resection (EOR) of gadolinium-enhancing (T1) tumor or adjuvant therapy as individual covariates. These figures illustrate how to use survival versus EOR curves (Fig 1B) or survival versus adjuvant therapy curves (Fig 1C) to estimate the personalized survival effects of changes in these modifiable covariates. (A and B) Survival implications of 75% (gray) versus 95% (black) EOR in two different patients. (A) The estimated incremental survival benefit of a more aggressive resection in a hypothetical young (age, 40 years), high-functioning (Karnofsky performance score [KPS], 100) patient is calculated at 135 days. (B) In contrast, a similar calculation in a hypothetical patient who is elderly (age 84 years) and debilitated (KPS, 60) has the same incremental survival benefit at only 55 days. These curves illustrate the importance of patient-specific covariates in the relationship between survival and EOR, and they can inform surgeons of the potential advantages of a more aggressive resection. This, in turn, provides better information on which patient-specific decisions regarding the risk/benefit balance of more aggressive surgical resections can be based. (C and D) Survival implications of alternative adjuvant therapy strategies in two different patients. (C) The estimated incremental survival benefit of adjuvant temozolomide alone (TMZ) versus adjuvant temozolomide plus radiotherapy (XRT) in a hypothetical young (age, 40 years), high-functioning (KPS, 100) patient is calculated at 200 days. (D) In contrast, a similar calculation in a hypothetical patient who is elderly (age 84 years) and debilitated (KPS, 60) results in an incremental survival benefit of only 90 days. These curves illustrate the importance of patient-specific covariates in the survival advantages of adjuvant therapy, and they can inform oncologists of the potential advantages of more aggressive adjuvant therapy. This, in turn, provides better information on which patient-specific decisions regarding the risk/benefit balance of the ideal, patient-specific adjuvant therapy strategy can be based. These curves also show that the survival effects of both EOR and adjuvant therapy vary with patient-specific covariates. This may have implications for the design, analysis, and interpretation of future trials that incorporate surgery, TMZ, or XRT as part of the glioblastoma management strategy being studied.
Fig 3.
Fig 3.
Personalized survival effects of extent of resection (EOR) of gadolinium enhancing (T1) tumor and adjuvant therapy as simultaneous covariates and how to use an integrated EOR and adjuvant therapy survival curve (Fig 1D) to estimate the personalized survival effects of simultaneous changes in these modifiable covariates. (A) The combined effects of EOR and adjuvant therapy on estimated survival in a hypothetical young (age 40 years), high-functioning (Karnofsky performance score [KPS], 100) patient is examined. When 95% resection is achieved (blue intervals), cranial radiotherapy (XRT) alone adds an estimated 120 days of survival (Δ2) and concomitant temozolomide-based chemotherapy (TMZ) adds an additional 260 days (Δ1) for a total of 380 days of estimated survival advantage versus no adjuvant therapy (680 days v 300 days total, Δ3). When EOR is decreased from 95% to 75%, the absolute values of the intervals decrease, and the absolute survival advantage is reduced (relative to the estimated survival for 95% EOR) from 680 to 540 days. (B) The combined effects of EOR and adjuvant therapy on estimated survival in a hypothetical patient who is elderly (age 84 years) and debilitated (KPS, 60) is examined. When 95% resection is achieved (blue intervals), XRT alone adds an estimated 50 days of survival (Δ2) and concomitant TMZ adds an additional 100 days (Δ1) for a total of 150 days of estimated survival advantage versus no adjuvant therapy (270 days v 120 days total, Δ3). When EOR is reduced from 95% to 75%, the absolute values of the intervals decrease and the absolute survival advantage is reduced (relative to the estimated survival for 95% EOR) from 270 to 220 days. Together, these observations may have implications for the interpretation of the incremental advantages of adjuvant therapy as well as for the design, analysis, and interpretation of future trials that incorporate surgery, TMZ, or XRT.

Comment in

References

    1. Dolecek TA, Propp JM, Stroup NE, et al. CBTRUS statistical report: Primary brain and central nervous system tumors diagnosed in the United States in 2005-2009. Neuro Oncol. 2012;14(suppl 5):v1–v49. - PMC - PubMed
    1. Stupp R, Mason WP, van den Bent MJ, et al. Radiotherapy plus concomitant and adjuvant temozolomide for glioblastoma. N Engl J Med. 2005;352:987–996. - PubMed
    1. Mirimanoff RO, Gorlia T, Mason W, et al. Radiotherapy and temozolomide for newly diagnosed glioblastoma: Recursive partitioning analysis of the EORTC 26981/22981-NCIC CE3 phase III randomized trial. J Clin Oncol. 2006;24:2563–2569. - PubMed
    1. Sanai N, Polley MY, McDermott MW, et al. An extent of resection threshold for newly diagnosed glioblastomas. J Neurosurg. 2011;115:3–8. - PubMed
    1. Sanai N, Berger MS. Extent of resection influences outcomes for patients with gliomas. Rev Neurol (Paris) 2011;167:648–654. - PubMed

MeSH terms