. 2014 Mar 10;211(3):563-77.
doi: 10.1084/jem.20131560. Epub 2014 Feb 10.

T-bet and Eomes instruct the development of two distinct natural killer cell lineages in the liver and in the bone marrow

Affiliations

T-bet and Eomes instruct the development of two distinct natural killer cell lineages in the liver and in the bone marrow

Cécile Daussy et al. J Exp Med. .

Abstract

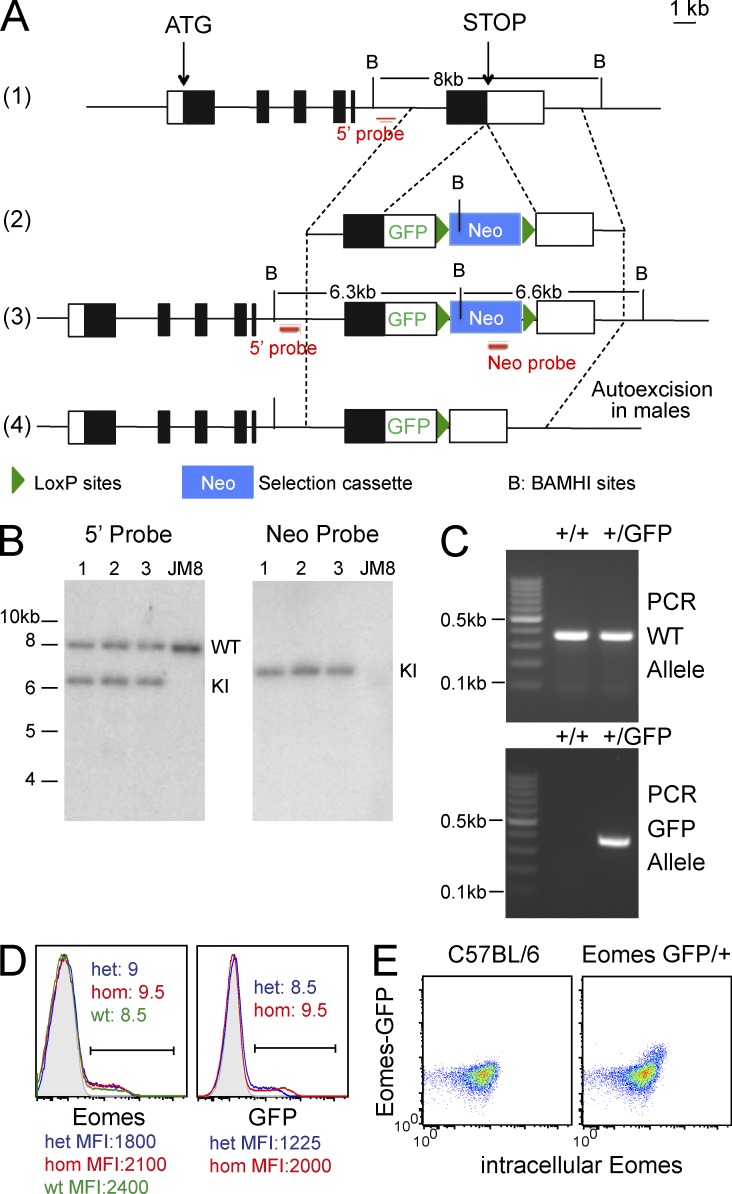
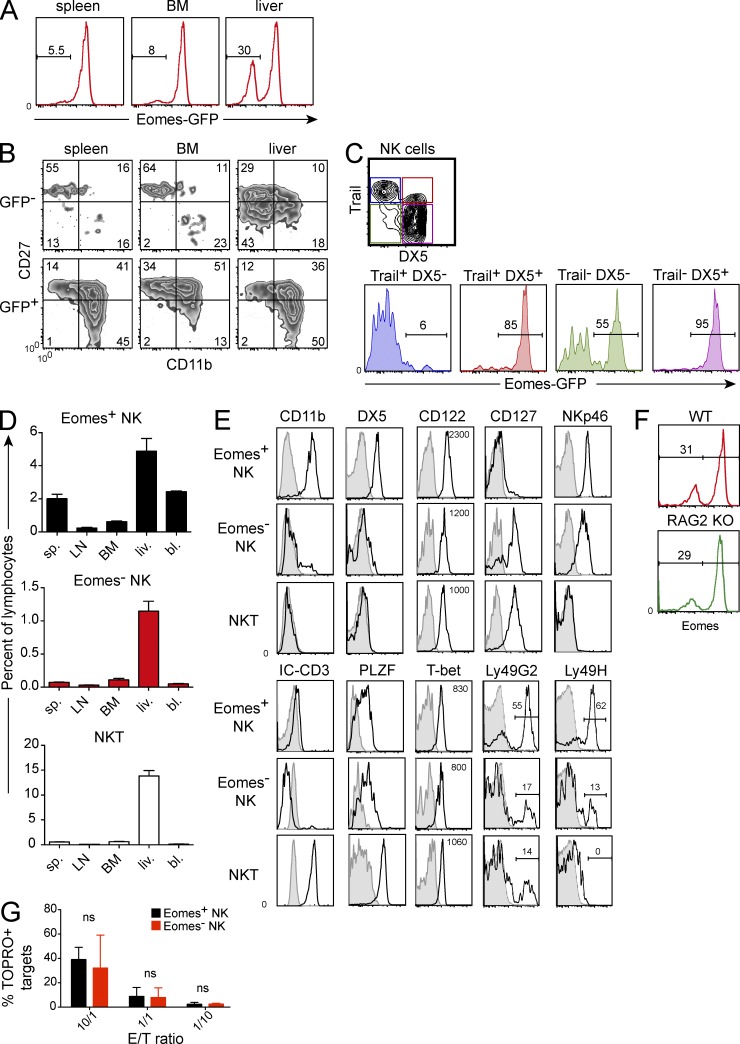
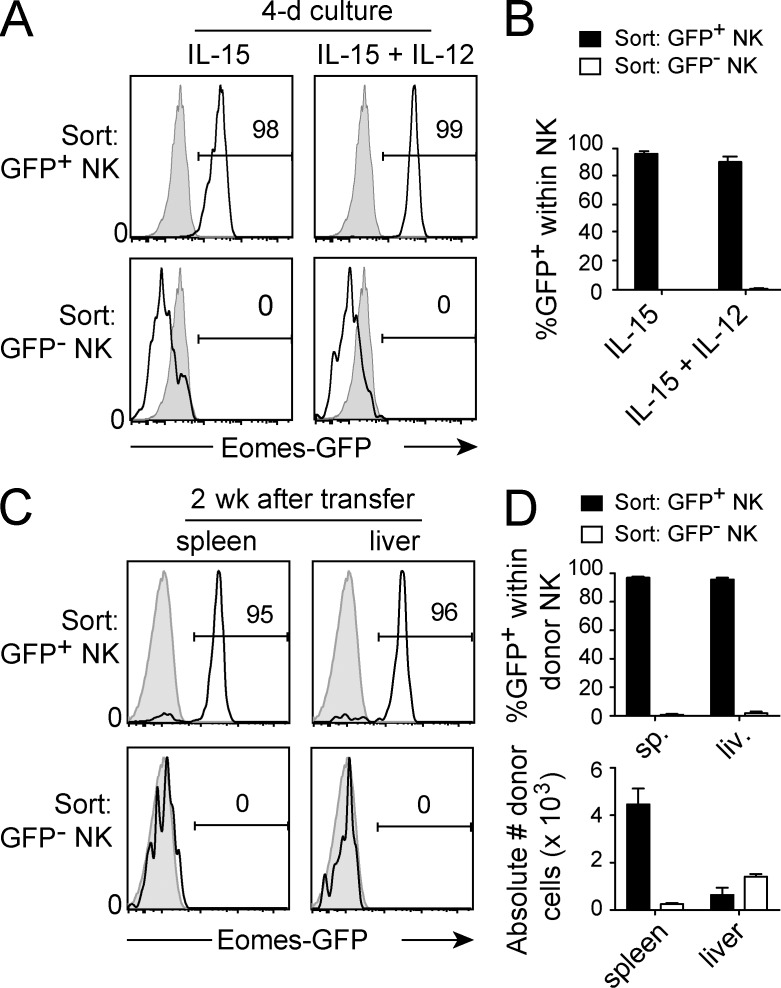
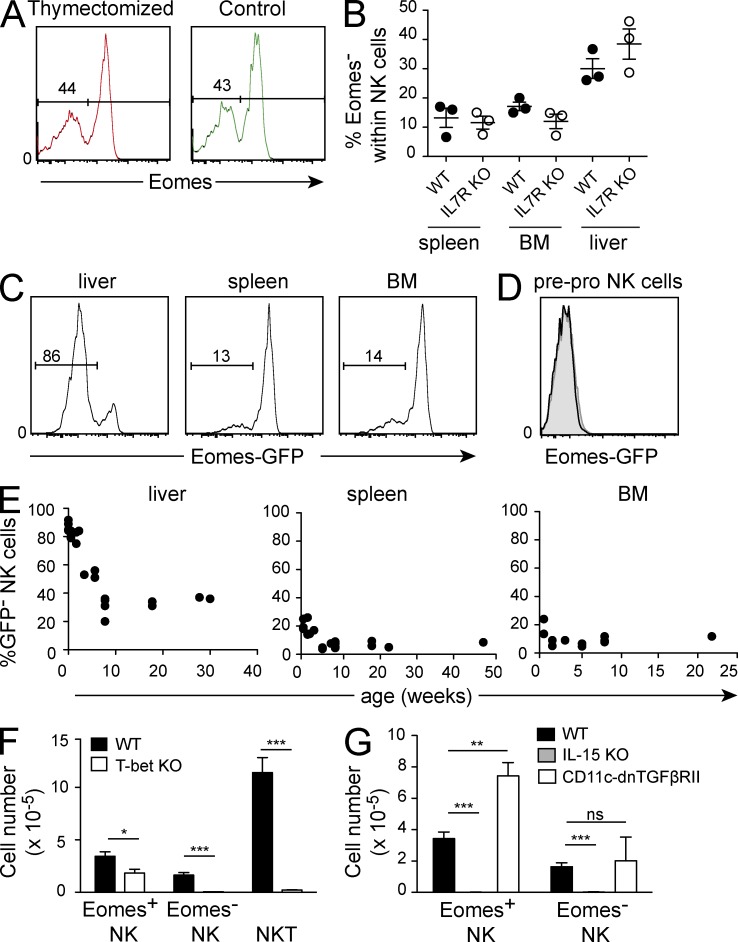
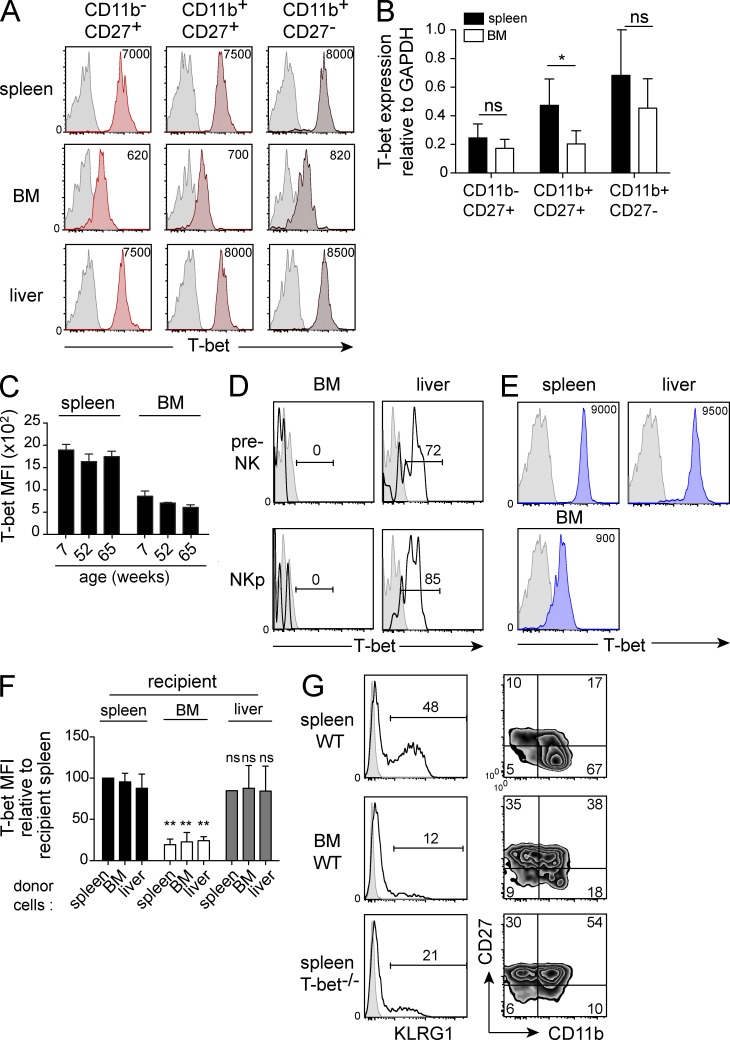
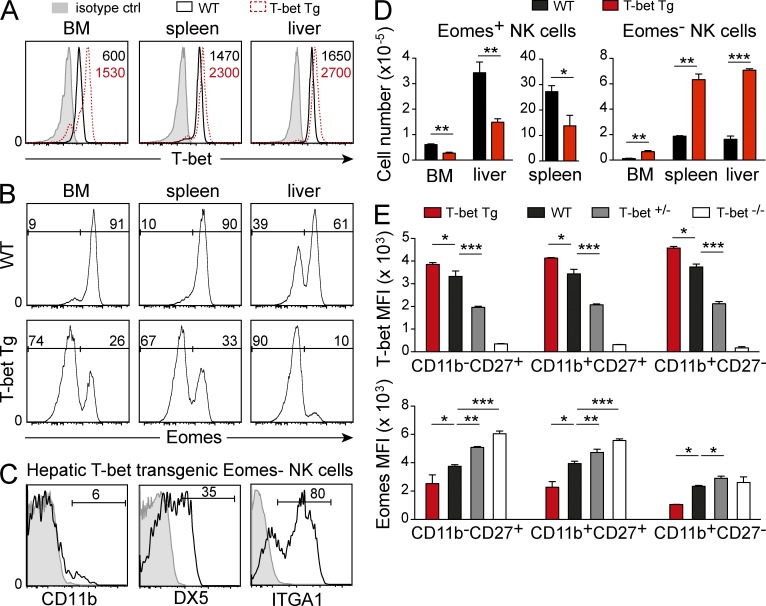
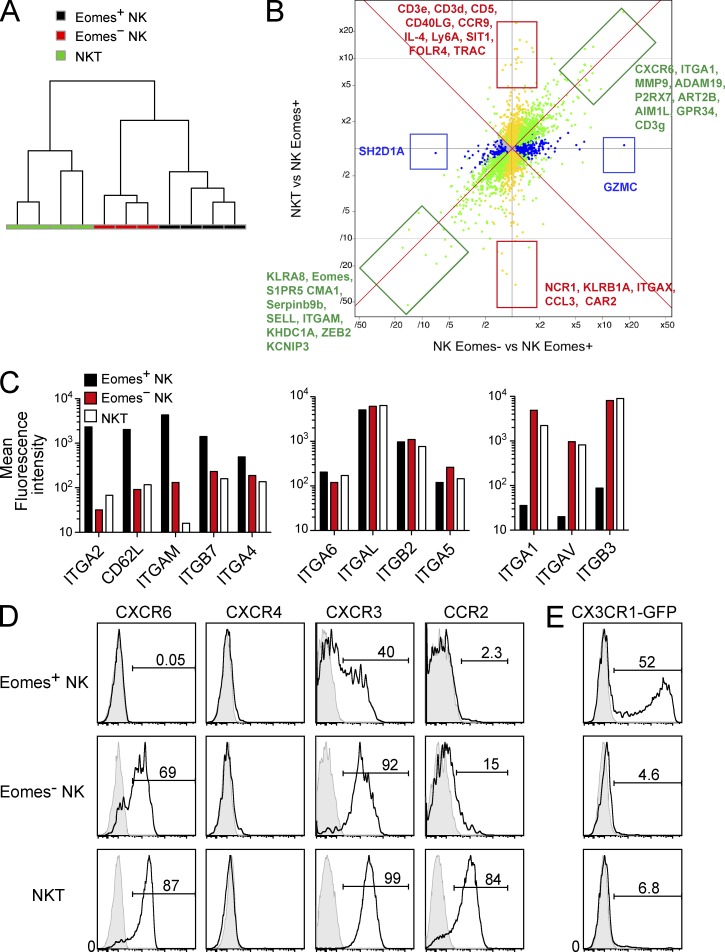
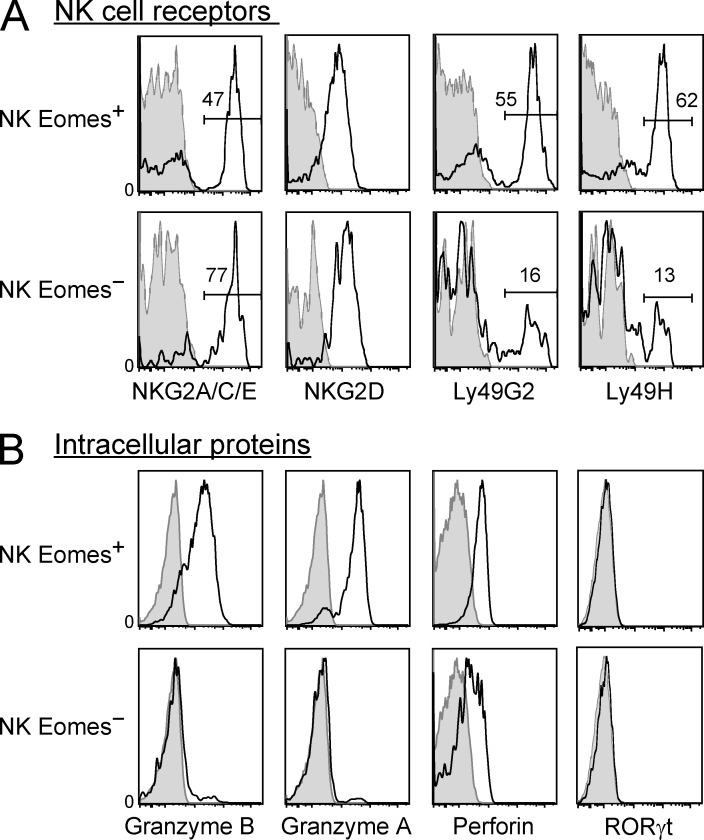
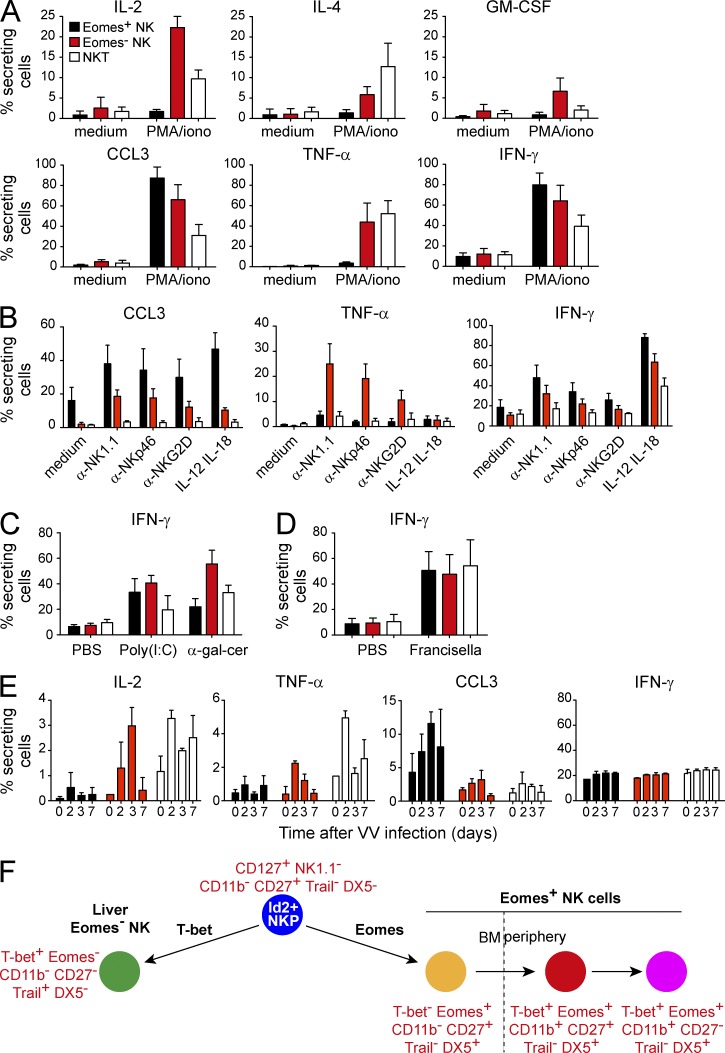
Trail(+)DX5(-)Eomes(-) natural killer (NK) cells arise in the mouse fetal liver and persist in the adult liver. Their relationships with Trail(-)DX5(+) NK cells remain controversial. We generated a novel Eomes-GFP reporter murine model to address this question. We found that Eomes(-) NK cells are not precursors of classical Eomes(+) NK cells but rather constitute a distinct lineage of innate lymphoid cells. Eomes(-) NK cells are strictly dependent on both T-bet and IL-15, similarly to NKT cells. We observed that, in the liver, expression of T-bet in progenitors represses Eomes expression and the development of Eomes(+) NK cells. Reciprocally, the bone marrow (BM) microenvironment restricts T-bet expression in developing NK cells. Ectopic expression of T-bet forces the development of Eomes(-) NK cells, demonstrating that repression of T-bet is essential for the development of Eomes(+) NK cells. Gene profile analyses show that Eomes(-) NK cells share part of their transcriptional program with NKT cells, including genes involved in liver homing and NK cell receptors. Moreover, Eomes(-) NK cells produce a broad range of cytokines, including IL-2 and TNF in vitro and in vivo, during immune responses against vaccinia virus. Thus, mutually exclusive expression of T-bet and Eomes drives the development of different NK cell lineages with complementary functions.


Figures

Figure 1.
Figure 1.
Generation and analysis of Eomes-GFP knockin reporter mice. (A) Outline of the Eomes-locus (1) and of the insertion. A modifying vector (2) was used to insert an ires-GFP cassette, followed by a Neo selection loxP-flanked cassette auto-excisable in males downstream the Eomes STOP codon (3). After Cre-induced recombination, the Neo cassette is removed, leaving only the ires-GFP (4). Different DNA probes (shown in red) were used to check for correct recombination in ES cells by Southern blotting after BAMHI (B) digestion. (B) Southern blots of control and recombined ES cells DNA digested with BAM HI and hybridized with the indicated probes. The bands corresponding to WT and KI Eomes alleles are indicated. (C) Screening of mice bearing the Eomes-GFP allele. PCR of tail DNA with WT or knockin-specific PCR primers is shown. (D) Flow cytometric analysis expression of intracellular Eomes (left) and GFP (right) in spleen lymphocytes of C57BL/6, EomesGFP/+, and EomesGFP/GFP mice as indicated. Numbers within histograms correspond to percentages of Eomes or GFP-positive cells in the indicated mouse genotypes. Data are representative of 20 mice in 10 experiments. (E) Co-expression of Eomes and GFP in EomesGFP/+ mice. Data are representative of two independent experiments.
Figure 2.
Figure 2.
Eomes NK cells are enriched in the liver and are similar to NKT cells. (A) Flow cytometric analysis of Eomes-GFP expression in NK cells (NK1.1+ CD3) isolated from different organs of EomesGFP/+ mice as indicated. Data are representative of 20 mice in 10 experiments. (B) Flow cytometric analysis of CD11b and CD27 expression in gated Eomes-GFP and Eomes-GFP+ NK cells as indicated. Data are representative of 10 mice in 5 experiments. (C) Flow cytometric analysis of Trail, DX5, and GFP expression in NK cells (NK1.1+ CD3) of Eomes-GFP mice. Bottom histograms show the frequency of Eomes-GFP+ cells (numbers) within the colored gates indicated on the top. Data are representative of 6 mice in 3 experiments. (D) Flow cytometry analysis of Eomes, Eomes+, and NKT cells (identified using α-GalCer loaded CD1d tetramers) in different organs of Eomes-GFP+ mice. Results show the mean frequency of the indicated cell types ± SD. Two experiments and n = 3 mice are shown. (E) Expression of various cell surface or intracellular proteins by gated hepatic Eomes, Eomes+, and NKT cells as indicated. Numbers indicate mean fluorescence intensities. Data are representative of 6 mice in 3 experiments. (F) Flow cytometric analysis of intracellular Eomes expression in gated NK cells of WT versus RAG2 KO mice. Data are representative of two experiments with two mice per group in each experiment. (G) Hepatic lymphocytes were isolated from Eomes-GFP mice and cultured overnight with IL-15. The next day, Eomes and Eomes+ NK cells were sorted by flow cytometry and cultured for 4 h with CFSE-labeled YAC1 cells. The percentage of TOPRO3+ YAC1 cells is shown. Data are mean ± SD results of 4 mice in 2 experiments.
Figure 3.
Figure 3.
Eomes NK cells are not precursors of Eomes+ NK cells. (A and B) Eomes and Eomes+ NK cells were sorted from EomesGFP/+ mice as detailed in the Materials and methods. They were cultured in vitro in the indicated conditions and their GFP expression was measured 4 d later. (A) Representative FACS analysis of GFP expression in live 7AAD NK cells after culture. (B) Mean ± SD percentage of GFP expression after culture (4 mice in 2 experiments). (C and D) Sorted Eomes-GFP and Eomes-GFP+ NK cells were adoptively transferred to congenic CD45.1 C57BL/6 mice. 2 wk later, transferred NK cells were identified as CD45.2+ CD45.1, they were counted, and their GFP expression was measured in the spleen and liver. (C) Representative FACS analysis of GFP expression after transfer. (D, Top) Mean ± SD percentage of GFP expression in donor NK cells after transfer for 9 mice in 3 experiments. (D, Bottom) Mean ± SD number of recovered cells after transfer for 9 mice in 3 experiments.
Figure 4.
Figure 4.
Eomes NK cells develop in the liver and are dependent on T-bet and IL-15 but not TGF-β and IL-7. (A) Flow cytometric analysis of intracellular Eomes expression in liver NK cells isolated from control or thymectomized mice. Numbers show the frequency of Eomes cells within NK cells. Data are representative of 6 mice in 3 experiments. (B) Mixed WT CD45.1:IL7R−/− CD45.2 BM chimeric mice were generated and analyzed by flow cytometry 6 wk after reconstitution for Eomes expression in liver NK cells originating from each donor marrow. (C) FACS analysis of GFP expression in NK cells from the indicated organ of newborn Eomes-GFP mice. Data are representative of n = 3 mice in two experiments. (D) GFP expression was measured by flow cytometry in pre-pro NK cells gated as CD3CD19Ly6DCD11bNK1.1CD135CD122CD244+CD127+. Data are representative of 6 mice in 3 experiments. (E) Percentage of GFP cells in NK cells from BM, spleen, and liver of Eomes-GFP mice of the indicated age as determined by flow cytometry. Each dot represents one mouse. (F and G) Cell number of Eomes, Eomes+, NK cells, and NKT cells in the liver of the indicated mouse strains. Bar graphs represent the mean ± SD of 3–5 mice in each group in two independent experiments. *, P < 0.05; **, P < 0.01; ***, P < 0.001, paired Student’s t test.
Figure 5.
Figure 5.
T-bet expression is actively repressed in the BM. (A) Flow cytometric analysis of intracellular T-bet expression in WT NK cells of the indicated subset and isolated from the indicated organs. Numbers indicate mean fluorescence intensity of T-bet staining. Data are representative of 20 mice in 10 experiments. (B) NK cells of the indicated phenotype were sorted from the spleen or the BM and the amount of T-bet mRNA was quantified by quantitative RT-PCR, relative to GAPDH mRNA. Data are mean ± SD of three independent experiments. *, P < 0.05, paired Student’s t test. (C) T-bet expression in spleen or BM NK cells of WT mice of the indicated age. n = 3 mice in each group in two independent experiments. (D) Flow cytometric analysis of intracellular T-bet expression in pre-pro NK cells and NK precursors identified as shown in Fig. S1. Data are representative of 6 mice in 3 experiments. (E) FACS measurement of T-bet expression in NK1.1+ T cells isolated from the BM, spleen, or liver as indicated. Numbers in FACS plots indicate T-bet MFI. Data are representative of 10 mice in 5 experiments. (F) Spleen, liver, or BM cells from CD45.1 C57BL/6 mice were adoptively transferred into C57BL/6 mice. 3 d later, transferred cells were identified as CD45.1+ CD45.2 in the spleen, liver, and BM of recipient mice and their intracellular T-bet expression was measured. Results show T-bet MFI relative to recipient spleen NK cells. Bar graphs show mean ± SD of 4 mice in 4 experiments. Statistics were calculated to compare migration to the BM or liver versus migration to the spleen. **, P < 0.01, paired Student’s t test. (G) Flow cytometric analysis of the indicated surface markers on gated NK cells from the spleen or the BM of WT and T-bet KO mice as indicated. Data are representative of 6 mice in 3 experiments.
Figure 6.
Figure 6.
Overexpression of T-bet induces the neo development of Eomes NK cells at the expense of the Eomes+ NK cell population. (A) Flow cytometric analysis of intracellular T-bet expression in WT or T-bet transgenic NK cells compared with isotype control in different organs. Numbers indicate mean fluorescence intensity of T-bet staining. Data are representative of 5 mice per group. (B) Flow cytometric analysis of intracellular Eomes expression in NK cells from the indicated organs of WT and T-bet transgenic mice. Numbers indicate percentages of Eomes and Eomes+ cells among NK cells. Data are representative of 5 mice per group. (C) Expression of CD11b, DX5, and ITGA1 by liver Eomes NK cells of T-bet transgenic mice. Data are representative of 4 mice in 2 experiments. (D) The number of Eomes and Eomes+ NK cells in different organs of WT and T-bet transgenic mice was determined by flow cytometry. Bar graphs represent mean ± SD. n = 3 in each group. (E) Flow cytometric analysis of T-bet (top) and Eomes (bottom) expression in spleen NK cells of the indicated mouse strains. Results show the mean ± SD florescence intensity for at least 3 mice in each group. *, P < 0.05; **, P < 0.01; ***, P < 0.001, paired Student’s t test.
Figure 7.
Figure 7.
Gene profiling analysis of Eomes and Eomes+ NK cells. (A) Hierarchical clustering with Ward’s agglomeration method of microarray data for the indicated populations (three to four samples in each group). (B) Comparison of differential gene expression between NKT versus Eomes+ NK cells (y axis) and Eomes versus Eomes+ NK cells (x axis). Orange dots correspond to genes differentially expressed, at a multiple testing adjusted value of 0.05, between NKT and Eomes+ NK cells, blue dots to genes differentially expressed between Eomes and Eomes+ NK cells, and green dots to genes differentially expressed in both conditions. The names of some of the most informative genes (boxes) are indicated. (C and D) Flow cytometric analysis of indicated receptors involved in cell trafficking in Eomes, Eomes+ NK cells, and NKT cells. In C, mean fluorescence intensities of stainings for each molecule are shown, whereas in D, FACS histograms are displayed. (E) Flow cytometry analysis of GFP expression in NK and NKT cell subsets from CX3CR1-GFP reporter mice. Data are representative of 6 mice in 3 experiments.
Figure 8.
Figure 8.
Expression of NK cell receptors and intracellular proteins by Eomes versus Eomes+ NK cells. Flow cytometric analysis of surface NKG2A/C/E, NKG2D, Ly49C/I, Ly49G2, and Ly49H (A) and intracellular perforin, granzyme A and B, and RORγt expression (B) in spleen NK cells of the indicated subsets. Data are representative of 6 mice in 3 experiments.
Figure 9.
Figure 9.
Eomes NK cells secrete a broad range of cytokines upon in vivo or ex vivo stimulation. (A) Hepatic lymphocytes from WT mice were cultured in medium supplemented or not with PMA and ionomycin for 6 h in the presence of Golgi traffic inhibitors. Expression of the indicated cytokines by gated Eomes NK cells, Eomes+ NK cells, and NKT cells was then measured by flow cytometry after intracellular stainings. Results show the mean ± SD percentage of cytokine-expressing cells calculated from n = 6 mice in three experiments. (B) Cytokine secretion was measured as in A, but cells were cultured with IL-12 + IL-18, cross-linking anti-NKp46, anti-NK1.1, or anti-NKG2D antibody. n = 4 mice in two experiments. Bar graphs show the mean ± SD. (C–E) WT mice were injected with PBS, poly(I:C), α-GalCer, F. tularensis, or Vaccinia virus as indicated. 3 h later (C), 48 h later (D), or at different time points as indicated (E), hepatic lymphocytes were cultured in medium for 6 h in the presence of Golgi traffic inhibitors and cytokine secretion was measured after intracellular staining. Data show the mean ± SD of two independent experiments with at least 4 mice per group. (F) Model of development and maturation of NK cells. In this model, Id2+ pre-pro NK cells differentiate into T-bet+ Eomes NK cells in the liver and T-bet Eomes+ in the BM. T-bet expression is repressed in the BM by factors that remain to be identified and this phenomenon allows Eomes expression. Once in the periphery, Eomes+ NK cells acquire expression of T-bet, which induces their terminal maturation. Liver-derived NK cells express high levels of Trail and CD127, and low levels of DX5, CD11b, and CD27. BM-derived NK cells express high levels of CD27 and CD127 at early steps of development and progressively acquire CD11b before losing CD27 expression.

References

    1. Aliahmad P., de la Torre B., Kaye J. 2010. Shared dependence on the DNA-binding factor TOX for the development of lymphoid tissue-inducer cell and NK cell lineages. Nat. Immunol. 11:945–952 10.1038/ni.1930 - DOI - PMC - PubMed
    1. Arbonés M.L., Ord D.C., Ley K., Ratech H., Maynard-Curry C., Otten G., Capon D.J., Tedder T.F. 1994. Lymphocyte homing and leukocyte rolling and migration are impaired in L-selectin-deficient mice. Immunity. 1:247–260 10.1016/1074-7613(94)90076-0 - DOI - PubMed
    1. Arnold S.J., Sugnaseelan J., Groszer M., Srinivas S., Robertson E.J. 2009. Generation and analysis of a mouse line harboring GFP in the Eomes/Tbr2 locus. Genesis. 47:775–781 10.1002/dvg.20562 - DOI - PMC - PubMed
    1. Bolstad B.M., Irizarry R.A., Astrand M., Speed T.P. 2003. A comparison of normalization methods for high density oligonucleotide array data based on variance and bias. Bioinformatics. 19:185–193 10.1093/bioinformatics/19.2.185 - DOI - PubMed
    1. Carlson C.M., Endrizzi B.T., Wu J., Ding X., Weinreich M.A., Walsh E.R., Wani M.A., Lingrel J.B., Hogquist K.A., Jameson S.C. 2006. Kruppel-like factor 2 regulates thymocyte and T-cell migration. Nature. 442:299–302 10.1038/nature04882 - DOI - PubMed

Publication types

MeSH terms