. 2014 Feb 25;111(8):2903-8.
doi: 10.1073/pnas.1319238111. Epub 2014 Feb 10.

A 3,500-year tree-ring record of annual precipitation on the northeastern Tibetan Plateau

Affiliations

A 3,500-year tree-ring record of annual precipitation on the northeastern Tibetan Plateau

Bao Yang et al. Proc Natl Acad Sci U S A. .

Abstract

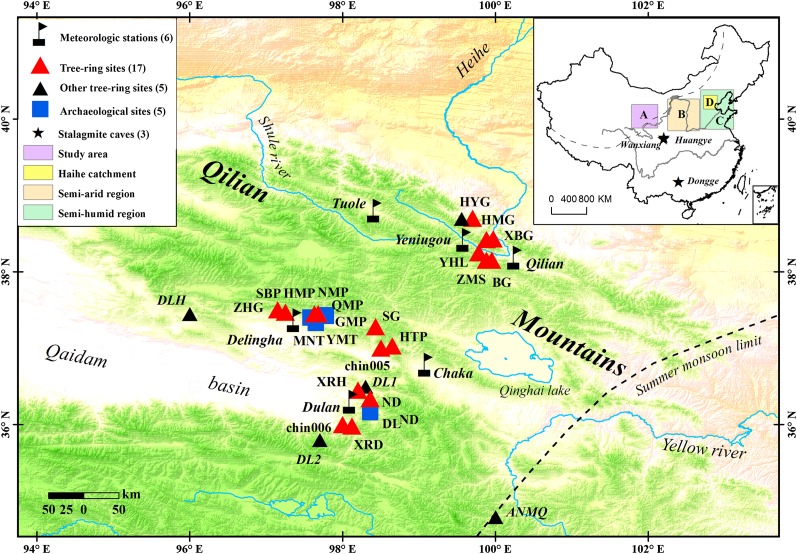
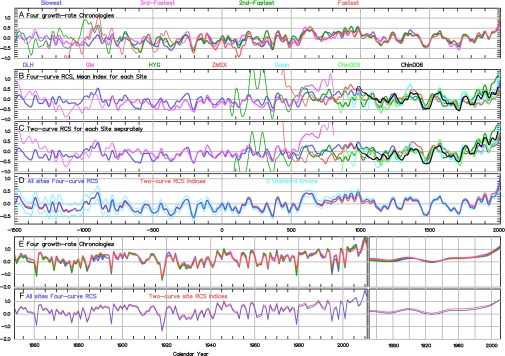
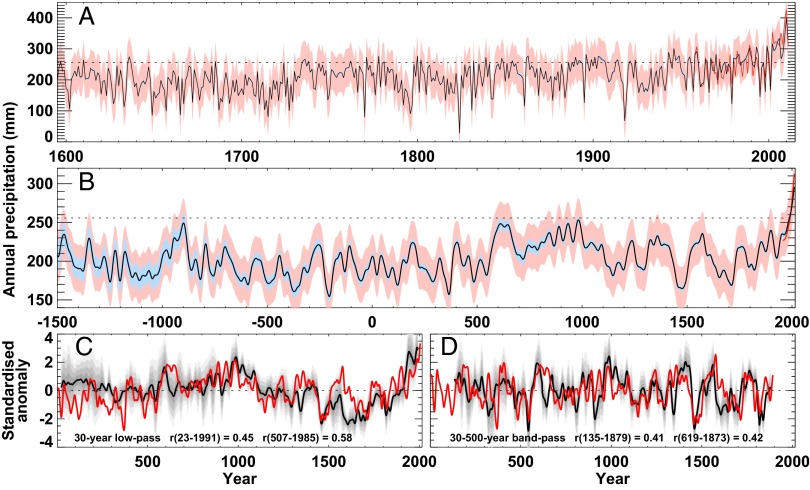
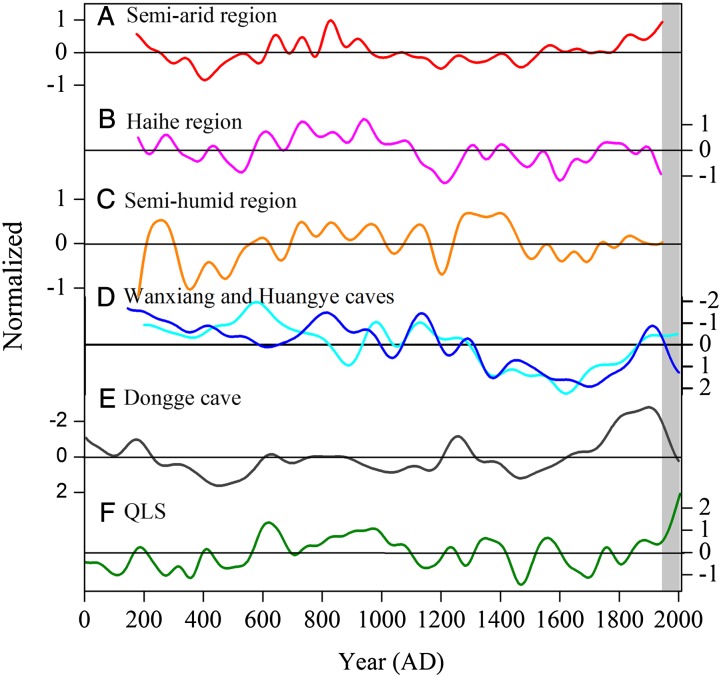
An annually resolved and absolutely dated ring-width chronology spanning 4,500 y has been constructed using subfossil, archaeological, and living-tree juniper samples from the northeastern Tibetan Plateau. The chronology represents changing mean annual precipitation and is most reliable after 1500 B.C. Reconstructed precipitation for this period displays a trend toward more moist conditions: the last 10-, 25-, and 50-y periods all appear to be the wettest in at least three and a half millennia. Notable historical dry periods occurred in the 4th century BCE and in the second half of the 15th century CE. The driest individual year reconstructed (since 1500 B.C.) is 1048 B.C., whereas the wettest is 2010. Precipitation variability in this region appears not to be associated with inferred changes in Asian monsoon intensity during recent millennia. The chronology displays a statistical association with the multidecadal and longer-term variability of reconstructed mean Northern Hemisphere temperatures over the last two millennia. This suggests that any further large-scale warming might be associated with even greater moisture supply in this region.


Conflict of interest statement

The authors declare no conflict of interest.

Figures

Fig. 1.
Fig. 1.
Map of the study region. Locations of tree-ring and weather station sites (refer to the key; metadata provided in SI Appendix). (Inset) Study location (A) within China in relation to the locations of other paleoclimate records considered here and to the approximate limit of the direct summer monsoon (dashed line in the main map and Inset).
Fig. 2.
Fig. 2.
Consistency between subsets of tree-ring data. Chronologies formed by averaging tree indices (i.e., standardized tree-ring width) across different subsets of trees and using different SF-RCS standardization approaches. (A) Four growth-rate chronologies (an equal number of trees are assigned to each set, grouped according to their mean growth rate), each standardized with a separate SF-RCS curve. (B) Seven site chronologies, each the average of indices obtained using the four overall growth-rate SF-RCS curves. (C) Seven site chronologies, where each site dataset was standardized using two growth-rate SF-RCS curves. (D) Overall QLS chronologies formed from either the four growth-rate chronologies (blue, with ±2 chronology SEs in light blue) or the seven site chronologies (red). All chronologies are smoothed with a 50-y spline (end values are more uncertain), and sections comprising less than six trees are shown as thinner lines. Chronology values after 1850 are repeated with (Right) and without (Left) smoothing for the (E) four growth-rate chronologies and (F) two overall QLS chronologies.
Fig. 3.
Fig. 3.
Reconstructed annual precipitation for the northeastern Tibetan Plateau and comparison with a composite NH temperature reconstruction. (A) Estimates of annual precipitation from the calibrated QLS chronology, showing yearly values since 1595, together with the total uncertainty (pale red) and the part of the uncertainty arising from chronology uncertainty (pale blue), and the observed regional precipitation since 1957 (red). The horizontal dotted line indicates the mean precipitation over the calibration period (1957–2011). Note that the calibration residuals show that the estimated values somewhat exaggerate the dryness in some dry years (e.g., 1978 and 1998), and this should be borne in mind when interpreting extremely dry years in the reconstruction. (B) As A, except the data are shown for the period since –1500 with 50-y smoothing (smoothed values will be more uncertain near the end of the time series). (C) Comparison of the precipitation reconstruction (red) with a composite of NH temperature reconstructions (black line, composite mean; four levels of gray shading, composite mean ± 0.5, 1.0, 1.5, and 2.0 composite SDs). All series have been normalized to have zero mean and unit SD over the common overlap period (Methods) and smoothed with a 30-y low-pass Gaussian-weighted filter, truncated seven values from each end to reduce the influence of filter end effects. Correlations between the precipitation and composite-mean temperature reconstructions are indicated on the panel for the full overlap period and the shorter period when at least six NH temperature reconstructions are available. (D) As C, except that all series have been band-pass–filtered to retain variance on timescales between 30 and 500 y, and the truncation is extended to 119 values from each end because the end effects of a 500-y filter are much greater (SI Appendix, Fig. SG1).
Fig. 4.
Fig. 4.
Multiple records of moisture variability in central and western China. A comparison of the last 2,000 y of the QLS precipitation reconstruction (F) with six relatively well-dated, published records indicative of moisture variability in western China. All records are normalized to have zero mean and unit SD and are smoothed to emphasize their multidecadal to centennial timescale variability. The first three series are independent reconstructions based on documentary records of the frequency of floods and droughts for (A) the semiarid area of the Great Bend of the Yellow River (26), (B) the Haihe River Basin (27), and (C) the semihumid lower reaches of the Yellow River Basin (26). The three “cave” records are oxygen isotope series (δ18O) derived from cave speleothems in (D) Wanxiang (28) (cyan) and Huangye (29) (blue) Caves, located very close to each other in southern Gansu some 700 km to the southeast of Dulan and (E) Dongge Cave (30), situated much further south (25°17'N, 108°5′E) in northern Guizhou some 1500 km from the region of the tree-ring data (Fig. 1 gives all locations). The Dongge Cave record has been widely interpreted as a proxy for summer monsoon intensity throughout the Holocene and has been linked with changes in Total Solar Irradiance (ref. and SI Appendix).

References

    1. Hegerl GC, et al. Understanding and attributing climate change. In: Solomon S, et al., editors. IPCC Climate Change 2007: The Physical Science Basis. Cambridge, UK: Cambridge Univ Press; 2007. pp. 663–745.
    1. Hegerl GC, et al. Detection of human influence on a new, validated 1500-year temperature reconstruction. J Clim. 2007;20(4):650–666.
    1. Collins M, Osborn TJ, Tett SFB, Briffa KR, Schweingruber FH. A comparison of the variability of a climate model with palaeo-temperature estimates from a network of tree-ring densities. J Clim. 2002;15:1497–1515.
    1. Jansen EJ, et al. Palaeoclimate. In: Solomon S, et al., editors. IPCC Climate Change 2007: The Physical Science Basis. Cambridge, UK: Cambridge Univ Press; 2007.
    1. D'Arrigo R, Wilson R, Jacoby G. On the long-term context for late twentieth century warming. J Geophys Res. 2006;111:D03103. doi: 10.1029/2005JD006352. - DOI

Publication types

LinkOut - more resources