

Very early warning of next El Niño
- PMID: 24516172
- PMCID: PMC3926055
- DOI: 10.1073/pnas.1323058111
Very early warning of next El Niño
Abstract
The most important driver of climate variability is the El Niño Southern Oscillation, which can trigger disasters in various parts of the globe. Despite its importance, conventional forecasting is still limited to 6 mo ahead. Recently, we developed an approach based on network analysis, which allows projection of an El Niño event about 1 y ahead. Here we show that our method correctly predicted the absence of El Niño events in 2012 and 2013 and now announce that our approach indicated (in September 2013 already) the return of El Niño in late 2014 with a 3-in-4 likelihood. We also discuss the relevance of the next El Niño to the question of global warming and the present hiatus in the global mean surface temperature.
Keywords: ENSO; dynamic networks; spring barrier.
Conflict of interest statement
The authors declare no conflict of interest.
Figures

 in the climate network (red curve) with a decision threshold Θ (horizontal line, here
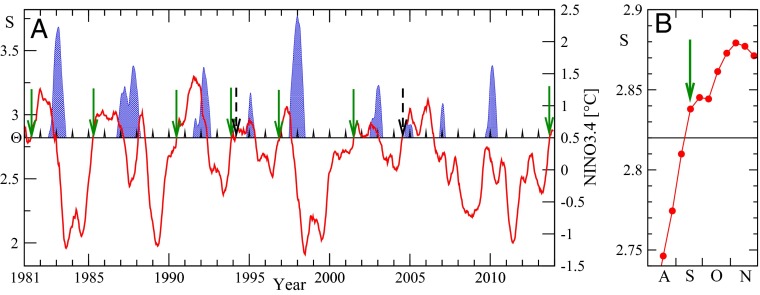
  ; left scale) and the standard NINO3.4 index (right scale) between January 1981 and November 2013. When the link strength crosses the threshold from below, outside an El Niño episode, we give an alarm and predict that an El Niño episode will start in the following calendar year. The El Niño episodes (when the NINO3.4 index is above 0.5 °C for at least 5 mo) are shown by the solid blue areas. Correct predictions are marked by green arrows and false alarms by dashed arrows. (B) Magnification of A for August (A), September (S), October (O), and November (N) 2013. The figure shows that by September 17 (green arrow), the optimal decision thresholds have been crossed, forecasting an El Nino event in 2014. In A, the learning phase (1950–1980) where the optimal thresholds have been learned has been omitted (31).
References
-
- Clarke AJ. An Introduction to the Dynamics of El Niño the Southern Oscillation. London: Elsevier Academic Press; 2008.
-
- Sarachik ES, Cane MA. The El Niño-Southern Oscillation Phenomenon. Cambridge, UK: Cambridge Univ Press; 2010.
-
- Power S, Delage F, Chung C, Kociuba G, Keay K. Robust twenty-first-century projections of El Niño and related precipitation variability. Nature. 2013;502(7472):541–545. - PubMed
-
- Dijkstra HA. Nonlinear Physical Oceanography: A Dynamical Systems Approach to the Large-Scale Ocean Circulation and El Niño. New York: Springer; 2005.
-
- Wang C, et al. Coral Reefs of the Eastern Pacific. Berlin: Springer; 2012. El Niño and Southern Oscillation (ENSO): A review; pp. 3–19.
LinkOut - more resources
Full Text Sources
Other Literature Sources
