

A unified view of "how allostery works"
- PMID: 24516370
- PMCID: PMC3916236
- DOI: 10.1371/journal.pcbi.1003394
A unified view of "how allostery works"
Abstract
The question of how allostery works was posed almost 50 years ago. Since then it has been the focus of much effort. This is for two reasons: first, the intellectual curiosity of basic science and the desire to understand fundamental phenomena, and second, its vast practical importance. Allostery is at play in all processes in the living cell, and increasingly in drug discovery. Many models have been successfully formulated, and are able to describe allostery even in the absence of a detailed structural mechanism. However, conceptual schemes designed to qualitatively explain allosteric mechanisms usually lack a quantitative mathematical model, and are unable to link its thermodynamic and structural foundations. This hampers insight into oncogenic mutations in cancer progression and biased agonists' actions. Here, we describe how allostery works from three different standpoints: thermodynamics, free energy landscape of population shift, and structure; all with exactly the same allosteric descriptors. This results in a unified view which not only clarifies the elusive allosteric mechanism but also provides structural grasp of agonist-mediated signaling pathways, and guides allosteric drug discovery. Of note, the unified view reasons that allosteric coupling (or communication) does not determine the allosteric efficacy; however, a communication channel is what makes potential binding sites allosteric.
Conflict of interest statement
The authors have declared that no competing interests exist.
Figures
 and
and  , with the relative population defined by the equilibrium constant,
  , and their binding to an allosteric ligand,
  . For the inactive state, the binding equilibrium constant is given by
  , and for the active state, by
  . Due to the complete circle of equilibrium, the equilibrium constant between
  and
and  is automatically deduced as
  with the previous three mass equations. Also, the forward reaction
  with
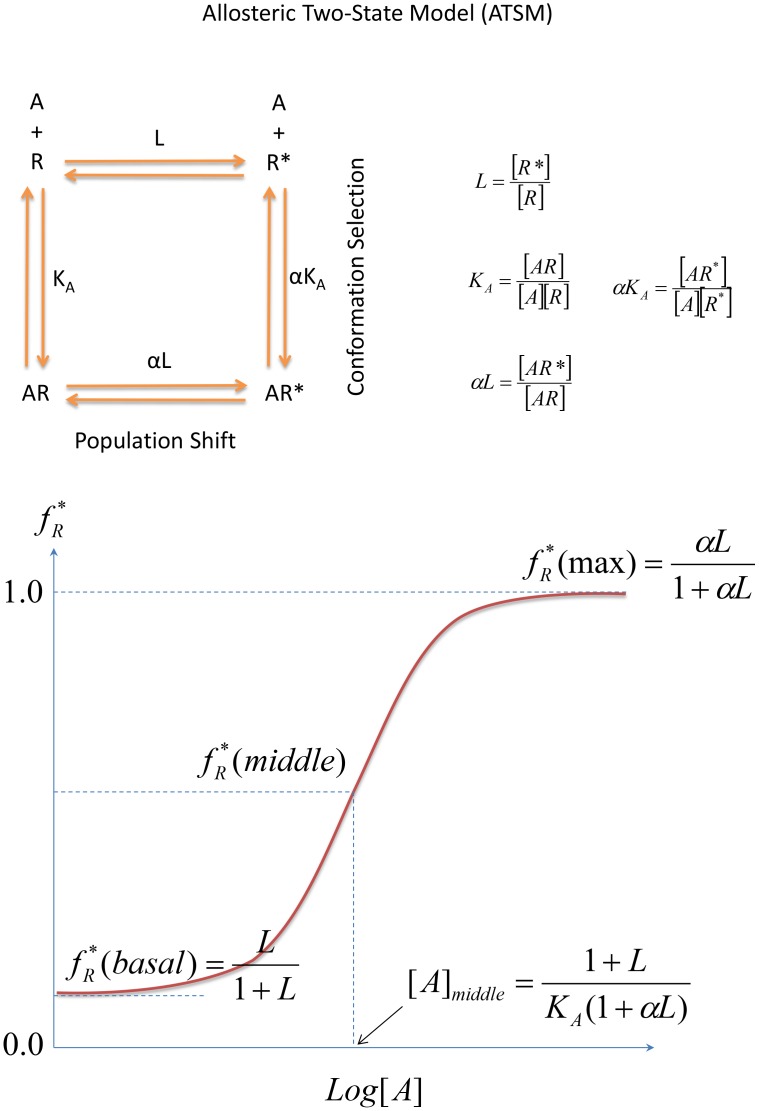
with  implies a population shift due to the allosteric binding event. In this schematic allostery description, the conformation selection scheme emphasizes that the microscopic path of
  dominates the equilibrium process in contrast to the induced-fit scheme which implies the
  path prevails. (B) A typical sigmoid response-concentration curve in the allosteric two-state model. If we accept the assumption that a measured biological response is proportional to the fraction of receptors in the activated state,
  as defined in the ATSM, manipulation of the three equilibrium equations in ATSM (Figure 2A) deduces the response,
  , as a function of ligand concentration with three independent parameters,
  ,
,  , and
, and  . The sigmoid response-concentration curve of ATSM is established by three quantities, the basal activity as
  ,
,  , the maximum activity
  ,
,  , and the activity at the middle point of the transition,
  which corresponds to ligand concentration at
  .
.
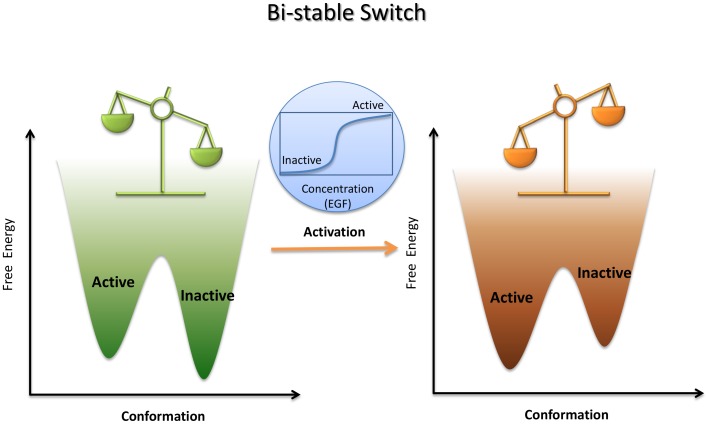
 (inactive) and
  (active), with each basin representing an ensemble of conformations and their relative populations as determined by the relative depth of the local basins. Allostery is clearly seen by a population shift from the inactive state dominated by apo (light green) to the active state prevailing in the complex (pale orange) through allosteric ligand binding.
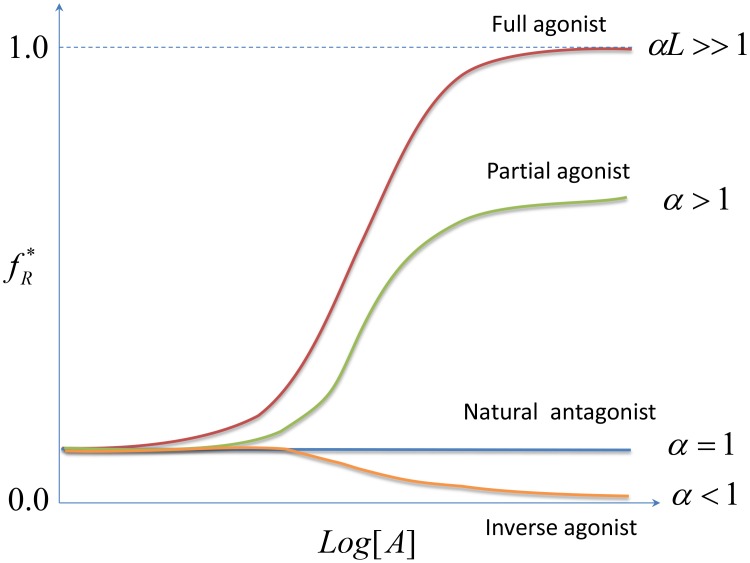
 ,
,  , and
, and  in ATSM. Full agonist, corresponding to
  , produces a full biological response. Partial agonist even at saturating concentration can only produce a partial biological response with
  . Inverse agonist suppresses basal activity with
  . Neutral antagonist with
  does not impose any biological response.
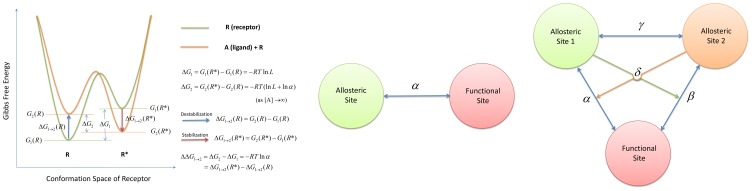
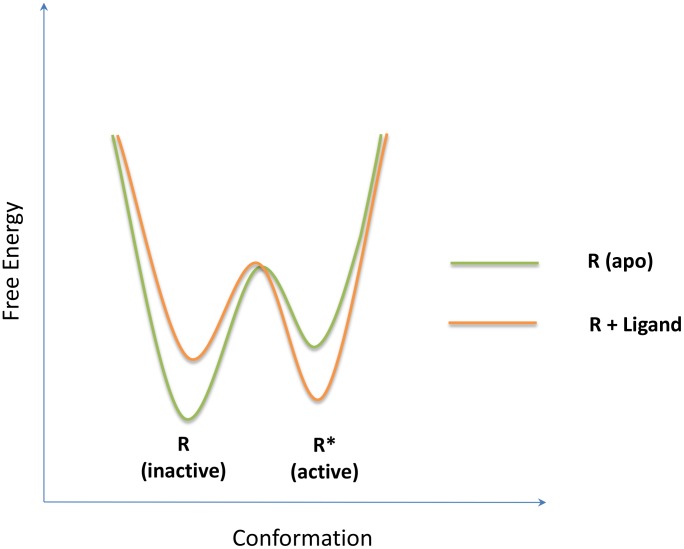
 ) and active (
 ) states is given by
  , which is
  according to the ATSM as depicted by the light green curve. After binding, the relative free energy between
  and
and  is given by
  , which under a saturating ligand concentration becomes
  , as drawn by the orange curve. The extent of population shift as measured by the free energy change due to binding,
  , is equal to
  . This result implies that the allosteric effect is solely determined by the allosteric efficacy, α, but not the absolute ligand affinity.
  can also be expressed by the difference between the active conformation stabilization energy,
  (red arrow), and inactive conformation destabilization energy,
  (blue arrow). (B) The structural view of allostery according to the ATSM. The allosteric communication between the allosteric and functional sites is indicated by the arrow with the coupling specified by the allosteric efficacy
  . Unlike the thermodynamic view, the structural view emphasizes that the conformations of two sites breathe dynamically in a concerted motion through a set of mutually interacting residues. Without such a propagation channel between sites,
  is always the case, no matter the changes at the allosteric site. Thus, while a preexisting channel (or allosteric networks of correlated residues) is a required condition, by itself the communication through the channel does not determine the allosteric efficacy. (C) The structural view of allostery according to the extended ATSM. In the drawing, the two allosteric communication channels between the two allosteric sites and the functional site are indicated by the blue double arrows with the coupling specified by the allosteric efficacy
  ,
,  from the extended ATSM. The communication between the two allosteric sites is linked with a coupling specified by the binding cooperativity,
  , which is shown not to affect the allosteric efficacy directly. The activation cooperativity
  is the sum of the allosteric effect of site 1 toward coupling
  (pale green arrow) plus allosteric site 2 toward allosteric coupling α (orange arrow). As in the simplest ATSM, it is the ligand binding itself that puts forth the allosteric communications through existing propagation channels and determines the allosteric efficacy and the activation cooperativity either positively or negatively.
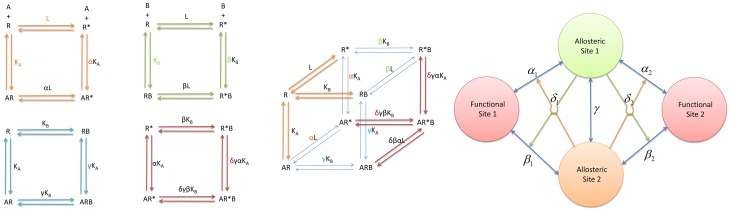
 ,
,  , and
, and  is exactly the same as in the simplest ATSM (Figure 2A), giving
  the equilibrium constant between the two states,
  the binding affinity of ligand
  bound to inactive
  , and
, and  the allosteric intrinsic efficacy of ligand
  . The second equilibrium cycle
  (pale green) describes the second ligand binding similar to the first ligand binding, assigning
  and
and  respectively as the binding affinity and the allosteric intrinsic efficacy of ligand
  . In the third equilibrium cycle
  (cyan), the sixth parameter
  administers the binding cooperativity between ligand
  and
and  upon the formation of the ternary complex
  . Similarly, the seventh parameter
  governs the activation cooperativity between ligand
  and
and  through the formation of
  in the fourth equilibrium cycle
  (red). (B) The complete equilibrium cycles of the extended ATSM. The four essential equilibrium cycles of the extended ATSM in (A) are combined into a cubic shape of a complete cycle. To guide the visualization, the two corners of the complete cycle are highlighted by colored equilibrium arrows for species
  and
and  and colored parameters for referencing back to the individual essential equilibrium cycle. (C) The structural view of allostery with two allosteric site and two (independent) functional sites. The drawing is based on two assumptions. First, the populations of the two functional sites are regulated independently by two distinct allosteric sites. Second, the two functional conformations coexist. The allosteric coupling set (
 ,
,  , and
, and  ) for functional site 1 and a duplicated set of independent allosteric efficacies (
 ,
,  , and
, and  ) for functional site 2 are similar to the description in Figure 6B. These two sets of coupling are linked by a shared binding cooperativity γ, coupling the two allosteric sites.
References
-
- Nussinov R, Tsai C-J (2013) Allostery in disease and in drug discovery. Cell 153: 293–305. - PubMed
-
- Jeffrey PD, Ruso AA, Polyak K, Gibbs E, Hurwitz J, et al. (1995) Mechanism of CDK activation revealed by the structure of a cyclinA-CDK2 complex. Nature 376: 313–320. - PubMed
-
- Blackmore NJ, Reichau S, Jiao W, Hutton RD, Baker EN, et al. (2013) Three sites and you are out: ternary synergistic allostery controls aromatic amino acid biosynthesis in mycobacterium tuberculosis. J Mol Biol 425: 1582–1592. - PubMed
Publication types
MeSH terms
Substances
Grants and funding
LinkOut - more resources
Full Text Sources
Other Literature Sources
