. 2014 Feb 6;10(2):e1004111.
doi: 10.1371/journal.pgen.1004111. eCollection 2014 Feb.

Mechanistically distinct mouse models for CRX-associated retinopathy

Affiliations

Mechanistically distinct mouse models for CRX-associated retinopathy

Nicholas M Tran et al. PLoS Genet. .

Abstract

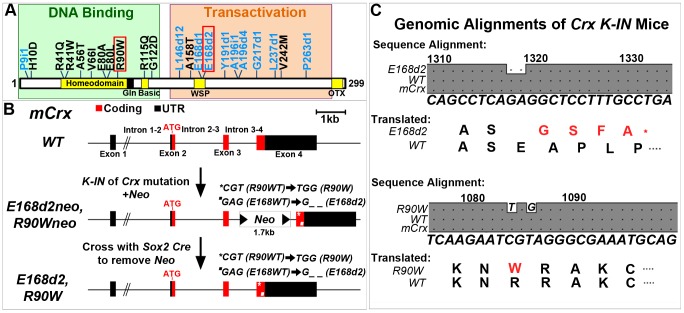
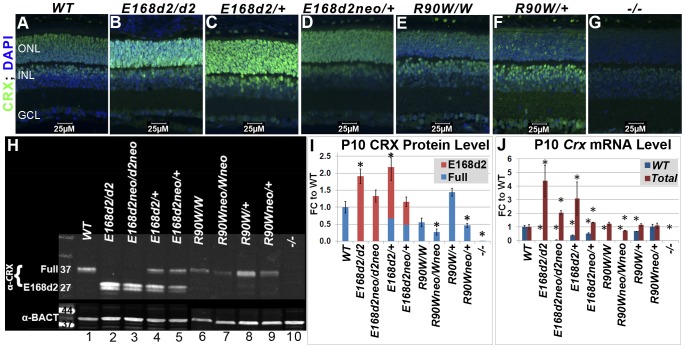
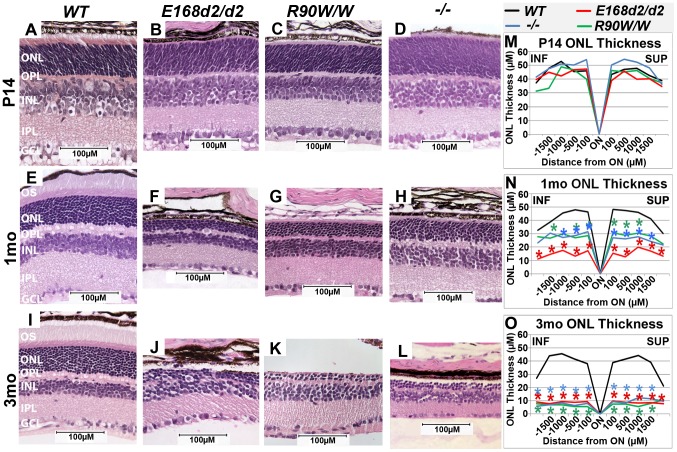
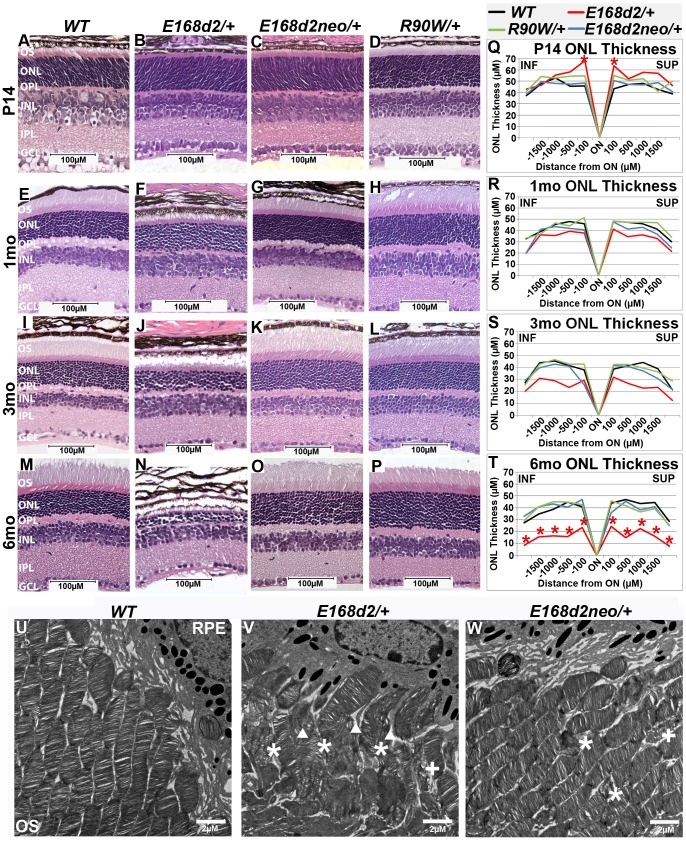
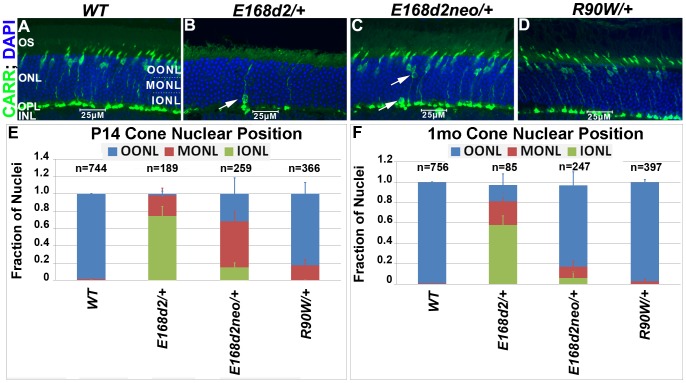
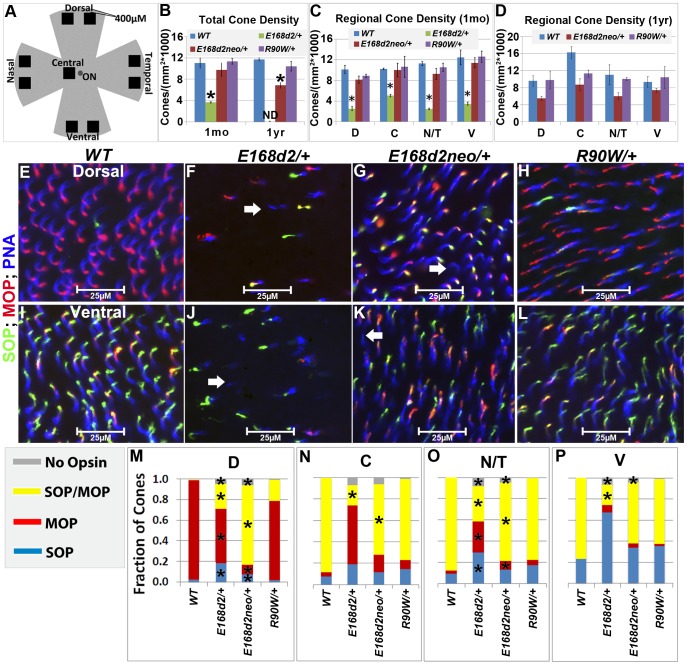
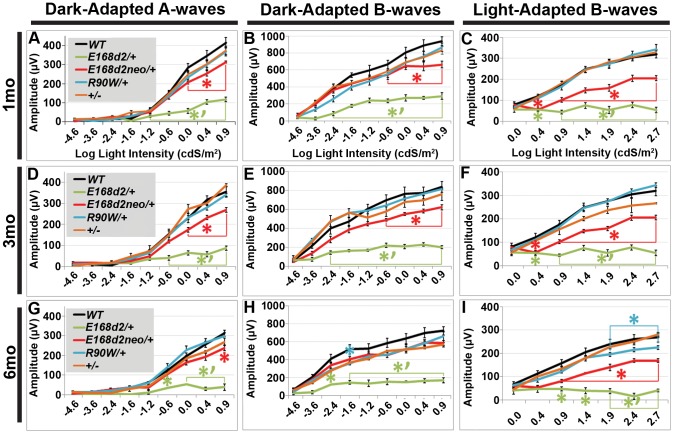
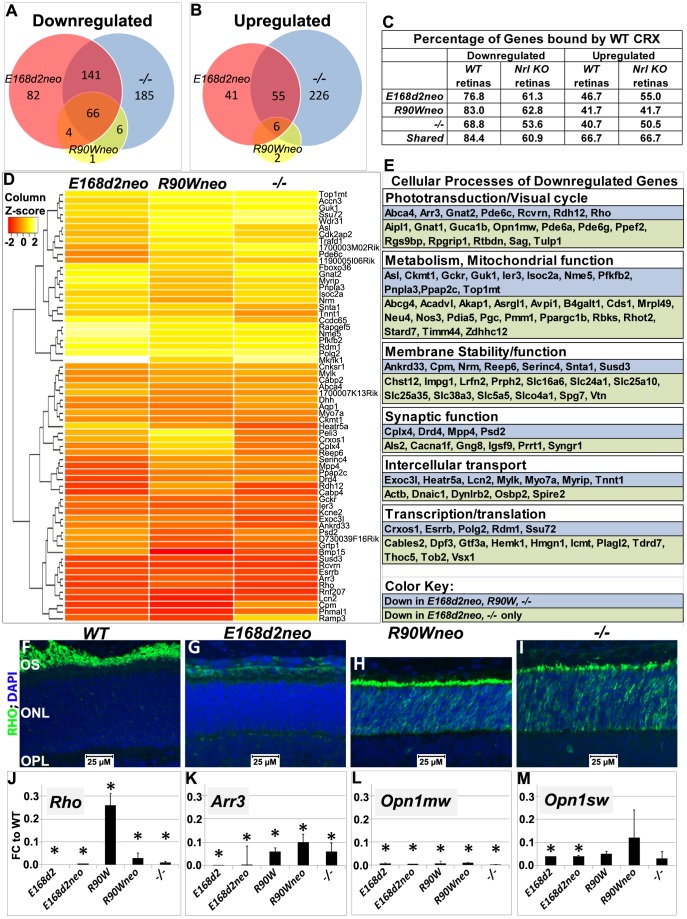
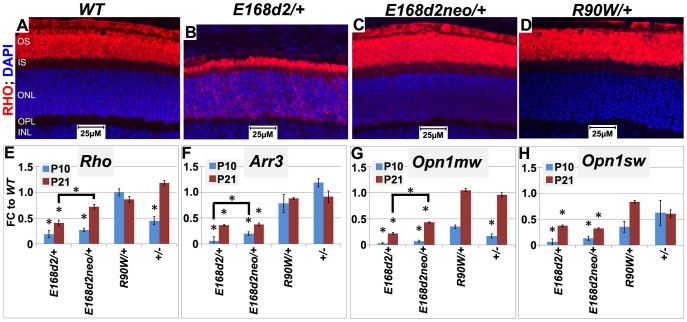
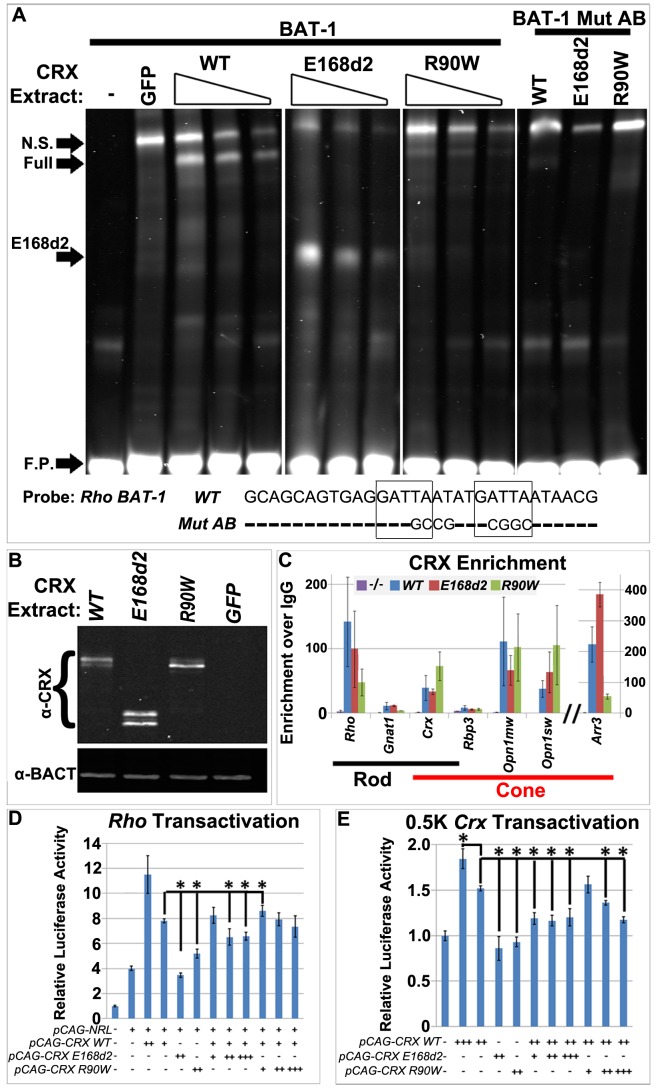
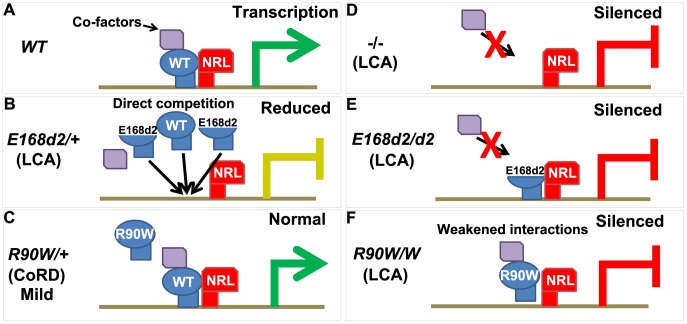
Cone-rod homeobox (CRX) protein is a "paired-like" homeodomain transcription factor that is essential for regulating rod and cone photoreceptor transcription. Mutations in human CRX are associated with the dominant retinopathies Retinitis Pigmentosa (RP), Cone-Rod Dystrophy (CoRD) and Leber Congenital Amaurosis (LCA), with variable severity. Heterozygous Crx Knock-Out (KO) mice ("+/-") have normal vision as adults and fail to model the dominant human disease. To investigate how different mutant CRX proteins produce distinct disease pathologies, we generated two Crx Knock-IN (K-IN) mouse models: Crx(E168d2) ("E168d2") and Crx(R90W) ("R90W"). E168d2 mice carry a frameshift mutation in the CRX activation domain, Glu168del2, which is associated with severe dominant CoRD or LCA in humans. R90W mice carry a substitution mutation in the CRX homeodomain, Arg90Trp, which is associated with dominant mild late-onset CoRD and recessive LCA. As seen in human patients, heterozygous E168d2 ("E168d2/+") but not R90W ("R90W/+") mice show severely impaired retinal function, while mice homozygous for either mutation are blind and undergo rapid photoreceptor degeneration. E168d2/+ mice also display abnormal rod/cone morphology, greater impairment of CRX target gene expression than R90W/+ or +/- mice, and undergo progressive photoreceptor degeneration. Surprisingly, E168d2/+ mice express more mutant CRX protein than wild-type CRX. E168d2neo/+, a subline of E168d2 with reduced mutant allele expression, displays a much milder retinal phenotype, demonstrating the impact of Crx expression level on disease severity. Both CRX([E168d2]) and CRX([R90W]) proteins fail to activate transcription in vitro, but CRX([E168d2]) interferes more strongly with the function of wild type (WT) CRX, supporting an antimorphic mechanism. E168d2 and R90W are mechanistically distinct mouse models for CRX-associated disease that will allow the elucidation of molecular mechanisms and testing of novel therapeutic approaches for different forms of CRX-associated disease.


Conflict of interest statement

The authors have declared that no competing interests exist.

Figures

Figure 1
Figure 1. Generation of mechanistically distinct Knock-IN (K-IN) mouse lines for CRX-associated disease: E168d2, E168d2neo, R90W and R90Wneo.
A. Diagram of CRX protein showing regions associated with DNA binding (green box) and transactivation (orange box) and mutations associated with human retinopathies. These mutations mainly fall into two classes: frameshift deletions and insertions in the transactivation region (blue text) and amino acid substitutions within the DNA binding region (black text). Two mutations (marked by red box) were selected for generating knock-in mouse models: E168d2 was predicted to generate a truncated protein that interferes with wild-type CRX function; R90W was predicted to generate a protein with reduced ability to bind DNA. B. Diagram of mouse Crx locus showing gene structure and strategy for generating Crx E168d2 and R90W K-IN lines. E168d2neo and R90Wneo each carry the indicated targeting construct containing loxP-flanked Neo cassette in Intron 3–4 as a selection marker. The final E168d2 and R90W lines were generated from the respective ‘Neo+’ sublines by Sox2-Cre-mediated excision in germline. C. Germline transmission of K-IN constructs was confirmed by Sanger sequencing of genomic DNA from homozygous E168d2/d2, R90W/W and WT mice and aligned to genomic mCrx. Shaded ‘’ in the grey boxes indicate fully conserved sequences, unshaded ‘’ denote deletions, and letters indicate base pair substitutions. Gene position (above alignment), consensus sequence (below alignment) and translated amino acid sequence are shown. Amino acid changes in E168d2 and R90W are shown in red text with ‘*’ indicating the novel stop codon in E168d2. Further generations of E168d2 and R90W mice were genotyped by allele specific PCR amplification of genomic DNA (Figure S1).
Figure 2
Figure 2. Differential expression of mutant CRX protein/RNA in K-IN mouse retinas.
A–G. Paraffin embedded sagittal sections of P10 mouse retinas were stained with the mouse monoclonal CRX M02 antibody (Abnova) and imaged by fluorescent microscopy. ONL-outer nuclear layer, INL-inner nuclear layer, GCL-ganglion cell layer. H. SDS-PAGE and Western blot analyses of CRX proteins made by the indicated mouse strains at P10, using the rabbit polyclonal CRX 119b-1 (α-CRX) antibody and mouse monoclonal anti-β-ACTIN (α-BACT, Sigma-Aldrich). Positive bands correlating with the ∼37 kD full-length CRX and ∼27 kD truncated CRX[E168d2] are visible. Lanes are numbered for reference (below). I. CRX protein levels were quantified by measuring the intensities of the CRX[E168d2] and full-length bands normalized to the β-ACTIN control using LI-COR Odyssey Image Studio software. The results are presented as fold changes (FC) relative to full-length CRX level in WT retina. (*p≤0.05) J. Crx mRNA levels were determined by quantitative real-time PCR using allele specific PCR primer pairs. Separate primer pairs were used to amplify WT Crx alone and total Crx (WT+mutant) in E168d2 and R90W mice (see Materials and Methods). The results are presented as FC relative to WT retina. (*p≤0.05).
Figure 3
Figure 3. Homozygous E168d2/d2 and R90W/W mice develop ‘LCA’-like retinopathy.
A–L. H&E staining of paraffin embedded sagittal retinal sections for E168d2/d2, R90W/W and −/− mice at P14, 1 mo and 3 mo and imaged by light microscopy, showing the lack of photoreceptor outer segments (OS) and loss of ONL cells with age. M–O. Reduction of ONL thickness in mutant retina at each age was quantified using ‘spider graph’ morphometry. Significant differences in overall ONL thickness were determined by testing genotype*distance interactions (by two-way ANOVA) at 1 mo (p = 0.002) and 3 mo (p = 0.0001), followed by individual comparisons to WT: *p<0.05. INF-inferior retina, SUP-superior retina.
Figure 4
Figure 4. Heterozygous E168d2/+ mice, but not R90W/+, develop dominant retinopathy.
A–P. Retinal morphology of the indicated heterozygous mutant mice was assessed by H&E staining of paraffin embedded sagittal sections at P14, 1 mo, 3 mo, and 6 mo. Shortened photoreceptor outer segments and ONL cell loss are apparent in E168d2/+ retina only. Q–T. ONL thickness was assessed by spider graph morphometry at the indicated ages. E168d2/+ (red line) shows progressive thinning of the ONL through 6 mo, while it's low expression subline, E168d2neo/+ (blue line), and R90W/+ (green line) do not. Significant differences in overall ONL thickness were determined by testing genotype*distance interactions (by two-way ANOVA). Significant interactions were observed at P14 (p = 0.03) and 6 mo (p = 0.03), followed by testing individual comparisons to WT: *p<0.05. INF-inferior retina, SUP-superior retina. U–W. The ultra structure of rod outer segment (OS) and nuclear morphology was assessed by transmission electron microscopy. Micrographs of rod outer segments proximal to RPE from WT control (U), E168d2/+ (V) and E168d2neo/+ mice (W). E168d2/+ OS's are highly disorganized showing ‘wave-like’ OS membrane stacks (asterisks), vesiculated membranes ‘+’ and vertically oriented OS membranes (triangles). E168d2neo/+ OS's only show minor ‘wave-like’ patterns and vesiculated membranes.
Figure 5
Figure 5. Heterozygous E168d2/+, E168d2neo/+ and R90W/+ mice display abnormal cone nuclear localization in developing and adult retina.
A–D. Sagittal retinal sections from the indicated mice at 1 mo, stained for cone arrestin (CARR) (green) and nuclear marker DAPI (blue). To assess cone nuclear location, the ONL was arbitrarily divided into three zones, outer ONL (OONL), mid ONL (MONL) and inner ONL (IONL). A. WT cone nuclei were found only in the OONL, while E168d2/+, E168d2neo/+ and R90W/+ had varying numbers of cones localized to IONL or MONL (B&C white arrows). E, F. Cone nuclear position was quantified by counting the fraction of CARR+ nuclei in each ONL zone of sagittal retinal sections from P14 or 1 mo mice of the indicated genotype (*p<0.05).
Figure 6
Figure 6. Heterozygous E168d2/+, E168d2neo/+ and R90W/+ mice display distinct changes in cone density and M/S opsin gradient formation.
A. Diagram showing regions of flat-mounted retina selected for cone density image analyses. B–D. Cone density of 1 mo and 1 yr old mice was determined by counting PNA+ cells on flat-mounted retinas in the dorsal (D), central (C), nasal/temporal (N/T) and ventral (V) regions. B. Total cone density over all regions (*p<0.05). C–D. Cone density in each region in1 mo (C, *p<0.05) and 1 yr old (D) mice. ND-not determined. Error bars: SEM. Note that genotype*retinal region interaction (by two-way ANOVA) was significant at 1 mo (p = 0.04) but not 1 yr (p = 0.11). E–L. Flat-mounted retinas from 1 mo mice of the indicated genotype were stained for OPN1SW (SOP, green), red/green opsin (MOP, red) and the pan cone marker peanut agglutinin (PNA, blue), showing sample images from the dorsal (E–H) and ventral (I–L) regions. Image scale bars: 25 µM. Unlike WT samples (E&I), E168d2/+, (F&J) and E168d2neo/+ (G&K) samples show a small number of PNA+ cones that did not express either cone opsin (white arrows). M–P. Fraction of cones in each region expressing SOP, MOP, both SOP/MOP or no opsin (*p<0.05).
Figure 7
Figure 7. Heterozygous E168d2/+, E168d2neo/+ and R90W/+ mice have graded deficits in retinal function.
A–I. Retinal function of E168d2/+, E168d2neo/+ and R90W/+ and +/− mice was assessed by electroretinography at 1 mo (A–C), 3 mo (D–F) and 6 mo (G–I). Average peak amplitude responses for dark-adapted A-waves and B-waves and light-adapted B-waves are plotted against the log of the flash intensity (Log [cd*s/m2]). Genotype*flash intensity interactions for peak amplitude (by two-way ANOVA) were significant (p<0.05) at all ages for each wave form tested. E168d2/+ mice show severe deficits in all wave responses at each age compared to responses from either WT or E168d2neo/+ mice (green vs. black and red line, respectively). Peak responses in E168d2neo/+ mice are higher than E168d2/+ (red vs. green line), but remain significantly decreased compared to WT (red vs. black line) with exceptions for 6 mo dark-adapted B-waves (H). R90W/+ and +/− mice have mostly normal retinal function (blue or orange vs. black line) but R90W/+ have subtle significant deficits in light-adapted B-waves at 6 mo (I, blue vs. black line). (Relative to WT: *p<0.05; relative to E168d2neo/+: *‘p<0.05, brackets indicate all enclosed data points are significant). Error bars: SEM.
Figure 8
Figure 8. Homozygous E168d2, R90W and −/− mice show graded changes in retinal gene expression.
A–B. Venn diagram showing overlap of genes that are differentially expressed at P10, as identified by Illumina gene expression mouseRef6 microarray. The number of genes in each group is indicated. E168d2neo/d2neo, R90Wneo/Wneo and −/− mice show a high degree of overlap in differentially expressed genes. C. Percentage of differentially expressed genes for each genotype that are directly bound by WT CRX protein in WT and Nrl KO retinas (based on the published ChIP-Seq datasets [21]). For all mutant genotypes, differentially expressed genes are enriched for direct CRX targets. D. Heat map of commonly downregulated genes in E168d2neo/d2neo, R90Wneo/Wneo and −/− mice show graded changes in gene expression of commonly downregulated genes. E. Cellular processes associated with commonly downregulated genes, based on gene ontology provided by Mouse Genome Informatics, showing a widespread effect of Crx mutations on visual and cellular pathways. F–I. P14 paraffin embedded sagittal retinal sections of WT, E168d2neo/d2neo, R90Wneo/Wneo and −/− mice were stained with Rhodopsin (RHO, green) and DAPI (blue), and imaged by wide field fluorescence at 40×. Note that RHO is absent in E168d2neo/d2neo, while mislocalized to ONL in R90Wneo/Wneo and −/−. J–M. Validation of microarray results by qRT-PCR analyses on selected CRX target genes, Rho, Arr3, Opn1mw and Opn1sw in retinas of P10 homozygous mice from the indicated strains, shown as FC relative to WT. (*p<0.05; Error bars: STDEV).
Figure 9
Figure 9. Graded changes in CRX target gene expression in heterozygous E168d2/+, E168d2neo/+ and R90W/+ mice.
A–D. Paraffin embedded sagittal retinal sections of 1 mo WT and the indicated heterozygous mutant mice were stained with mouse monoclonal anti-Rhodopsin RetP-1 antibody (Chemicon) (RHO, red) and DAPI nuclear conterstaining (blue), and imaged by widefield fluorescence at 40×. E168d2/+ shows reduced rod OS length and mislocalized RHO in ONL. E–H. qRT-PCR analysis of four CRX target genes, Rho, Arr3, Opn1mw, Opn1sw in the indicated heterozygous mice at P10 and P21 (*p<0.05; bracketed *FDR p<0.09; Error bars: SEM). Note at P10, the expression of Opn1mw and Opn1sw CRX target genes are reduced in all mutant models. However, at P21, expression recovers in R90W/+ and +/− mice, while remaining reduced in E168d2/+ and E168d2neo/+ mice.
Figure 10
Figure 10. CRX[E168d2] and CRX[R90W] affect target gene transcription through distinct molecular mechanisms.
A. Electrophoresis mobility shift assays (EMSA) to measure the DNA binding activity of HEK293-expressed CRX[E168d2] and CRX[R90W] protein to the Rho BAT-1 DNA fragment. CRX mammalian expression vectors pCAGIG-CRX WT, E168d2 or R90W and their negative control vector pCAG-Gfp (−) were individually transfected into HEK293 cells. A 2-fold dilution series of nuclear protein extract made from each transfection was incubated with 700IRdye-labeled DNA probes, either BAT-1 or mutated BAT-1 lacking CRX-binding sites (BAT-1 Mut AB) (sequence below EMSA) . The resulting protein/DNA complexes were resolved on 5% non-denaturing PAGE gels and imaged on the LI-COR Odyssey system. Novel bands corresponding to protein/DNA complexes containing full-length CRXs (FULL, either WT or R90W), truncated CRX (E168d2) and non-specific (N.S.) protein(s), as well as free probe (F.P.) are indicated. B. Western blot for the amount of CRX protein (antibody 119b-1) present in each nuclear extract. To compare binding activity, CRX protein levels from different nuclear extracts were normalized to the WT level and equal ratios were used for EMSA reactions. C. Quantitative chromatin immunoprecipitation assays for promoter occupancy of CRX in P14 WT and E168d2/d2, R90W/W and −/− mutant retinas. The indicated target gene promoters were used in qPCR assays on CRX-immunoprecipitated chromatin and the results are presented as enrichment of CRX over IgG control. Like WT protein, both CRX[E168d2] and CRX[R90W] are enriched on the promoters analyzed. D–E. Dual-luciferase assays showing combined transactivation activity of NRL, CRX, CRX[E168d2] and CRX[R90W] in transfected HEK293 cells on two promoter-luciferase reporters, Rhodopsin (Rho, BR-130 [47]) (D) or Crx (0.5K mouse Crx) (E). Comparing to pcDNA3.1/HisC control, for Rho: all test plasmid combinations were significantly different; for 0.5K Crx: only pCAG-E168d2 and pCAG-R90W were not significantly different. Significant differences of post hoc comparisons are indicated by bracketed ‘*’ (FDR p<0.09; comparisons were made to the left most bracket; Error bars: STDEV).
Figure 11
Figure 11. Models for CRX[E168d2] and CRX[R90W] mechanisms of pathogenesis in K-IN mice.
A. In WT mice, CRX binds to DNA, recruits and synergizes with co-factors including NRL and chromatin modulators to promote target gene transcription. B. In E168d2/+ mice, the antimorphic CRX[E168d2] protein directly competes with CRX WT to act on target gene promoters. Since CRX[E168d2] protein is overexpressed compared to WT, its antimorphic effect is amplified and results in severe reductions in target gene transcription and retinopathy resembling LCA. C. In R90W/+ mice, CRX[R90W] protein does not impair the function of CRX WT and transcription in adult mice is largely normal. R90W/+ mice have only a mild retinal phenotype similar to a late-onset CoRD. D. In −/− mice, the loss of CRX leads to the failure to recruit co-factors to target gene promoters and expression is silenced . E. In E168d2/d2 mice, CRX[E168d2] protein binds to the promoters of target genes, which interferes with the activity of other transcription factors, resulting in early-onset LCA with a faster course of retinal degeneration than in −/− mice. F. In R90W/W mice, CRX[R90W] protein still associates with target gene promoters despite having reduced DNA binding in vitro. However, this confers only modest gains in target gene transcription over −/−, insufficient to establish normal retinal function. Thus, CRX[R90W] protein is a functionally impaired protein but retains some residual transactivation activity. R90W/W mice most closely model LCA.

Similar articles

Cited by

References

    1. Chen S, Wang QL, Nie Z, Sun H, Lennon G, et al. (1997) Crx, a novel Otx-like paired-homeodomain protein, binds to and transactivates photoreceptor cell-specific genes. Neuron 19(5): 1017–30. - PubMed
    1. Furukawa T, Morrow EM, Cepko CL (1997) Crx, a novel otx-like homeobox gene, shows photoreceptor-specific expression and regulates photoreceptor differentiation. Cell 91: 531–541. - PubMed
    1. Furukawa T, Morrow EM, Li T, Davis FC, Cepko CL (1999) Retinopathy and attenuated circadian entrainment in Crx-deficient mice. Nat Genet 23 4: 466–470. - PubMed
    1. Chau KY, Chen S, Zack DJ, Ono SJ (2000) Functional domains of the cone-rod homeobox (CRX) transcription factor. The Journal of biological chemistry 275 47: 37264–70. - PubMed
    1. Kimura A, Singh D, Wawrousek E, Kikuchi M, Nakamura M, et al. (2000) Both PCE-1/RX and OTX/CRX Interactions Are Necessary for Photoreceptor-specific Gene Expression. J Biol Chem 275: 1152–1160. - PubMed

Publication types