

Effect of the one-child policy on influenza transmission in China: a stochastic transmission model
- PMID: 24516519
- PMCID: PMC3916292
- DOI: 10.1371/journal.pone.0084961
Effect of the one-child policy on influenza transmission in China: a stochastic transmission model
Abstract
Background: China's one-child-per-couple policy, introduced in 1979, led to profound demographic changes for nearly a quarter of the world's population. Several decades later, the consequences include decreased fertility rates, population aging, decreased household sizes, changes in family structure, and imbalanced sex ratios. The epidemiology of communicable diseases may have been affected by these changes since the transmission dynamics of infectious diseases depend on demographic characteristics of the population. Of particular interest is influenza because China and Southeast Asia lie at the center of a global transmission network of influenza. Moreover, changes in household structure may affect influenza transmission. Is it possible that the pronounced demographic changes that have occurred in China have affected influenza transmission?
Methods and findings: To address this question, we developed a continuous-time, stochastic, individual-based simulation model for influenza transmission. With this model, we simulated 30 years of influenza transmission and compared influenza transmission rates in populations with and without the one-child policy control. We found that the average annual attack rate is reduced by 6.08% (SD 2.21%) in the presence of the one-child policy compared to a population in which no demographic changes occurred. There was no discernible difference in the secondary attack rate, -0.15% (SD 1.85%), between the populations with and without a one-child policy. We also forecasted influenza transmission over a ten-year time period in a population with a two-child policy under a hypothesis that a two-child-per-couple policy will be carried out in 2015, and found a negligible difference in the average annual attack rate compared to the population with the one-child policy.
Conclusions: This study found that the average annual attack rate is slightly lowered in a population with a one-child policy, which may have resulted from a decrease in household size and the proportion of children in the population.
Conflict of interest statement
Figures
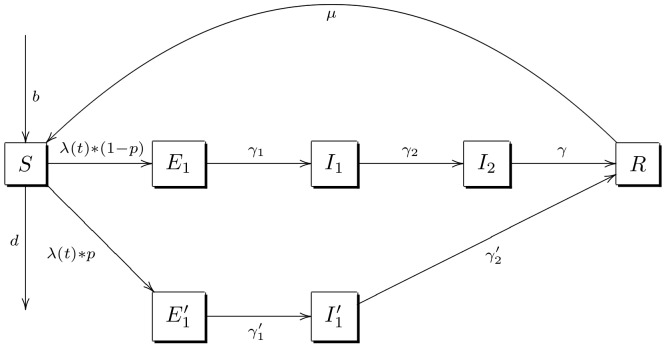
 (susceptible),
  (mild exposure),
  (not mild exposure),
  (mild asymptomatic infectiousness),
  (not mild asymptomatic infectiousness),
  (symptomatic infectiousness) and
  (recovered with immunity), and the population's inflow and outflow are represented by each individual's age-specific death rate d and age-specific fertility rate b.


References
-
- Hvistendahl M (2010) Has China Outgrown The One-Child Policy? Science 329: 1458–1461. - PubMed
-
- Hvistendahl M (2010) Demography. Of population projections and projectiles. Science 329: 1460. - PubMed
-
- Hesketh T, Lu L, Xing ZW (2005) The effect of China's one-child family policy after 25 years. N Engl J Med 353: 1171–1176. - PubMed
Publication types
MeSH terms
Grants and funding
LinkOut - more resources
Full Text Sources
Other Literature Sources
Medical
