. 2014 Feb 6;9(2):e86025.
doi: 10.1371/journal.pone.0086025. eCollection 2014.

Neural crest-derived mesenchymal cells require Wnt signaling for their development and drive invagination of the telencephalic midline

Affiliations

Neural crest-derived mesenchymal cells require Wnt signaling for their development and drive invagination of the telencephalic midline

Youngshik Choe et al. PLoS One. .

Abstract

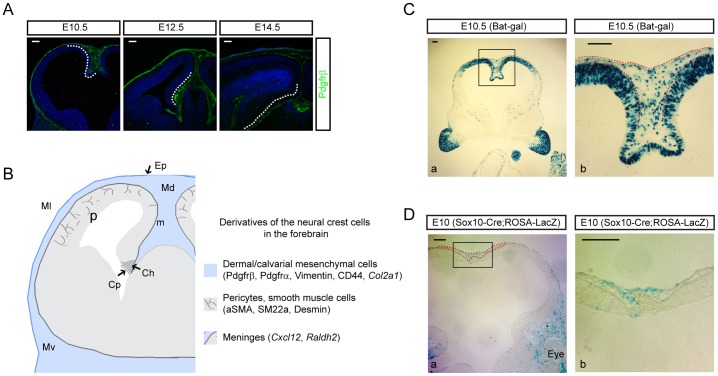
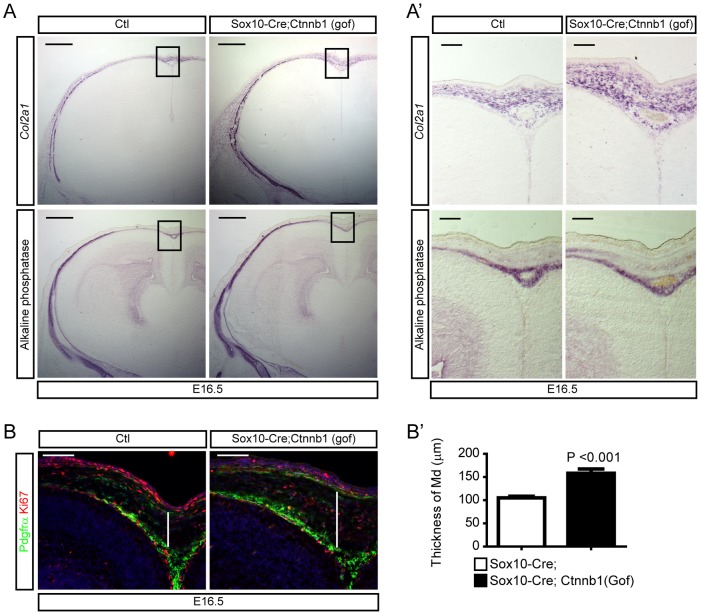
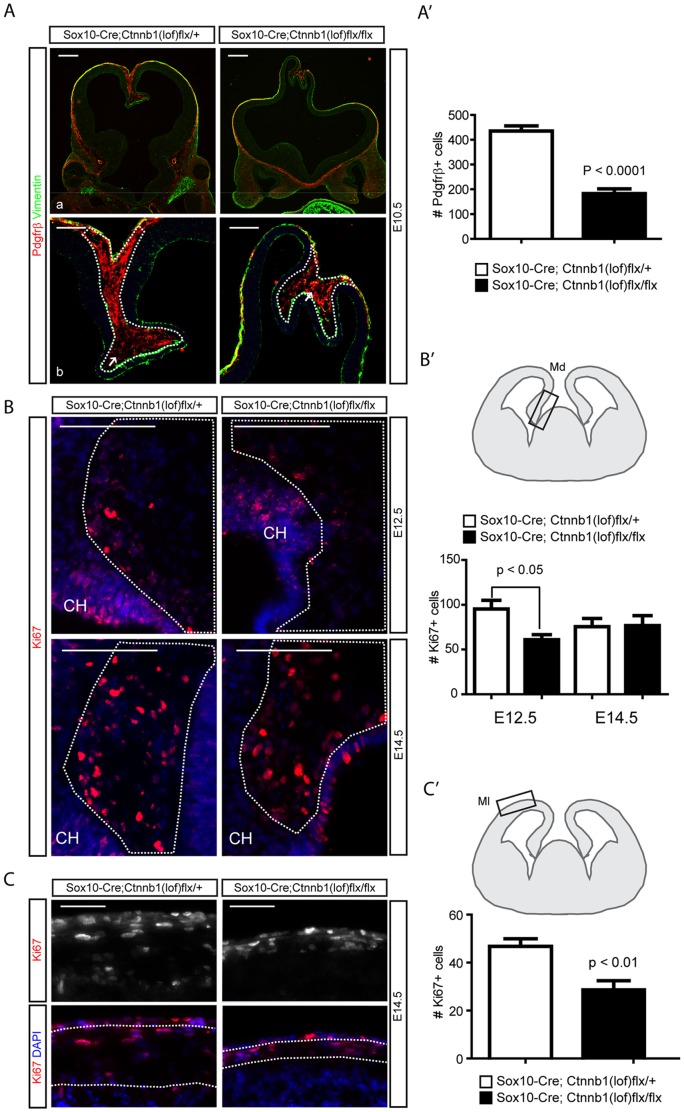
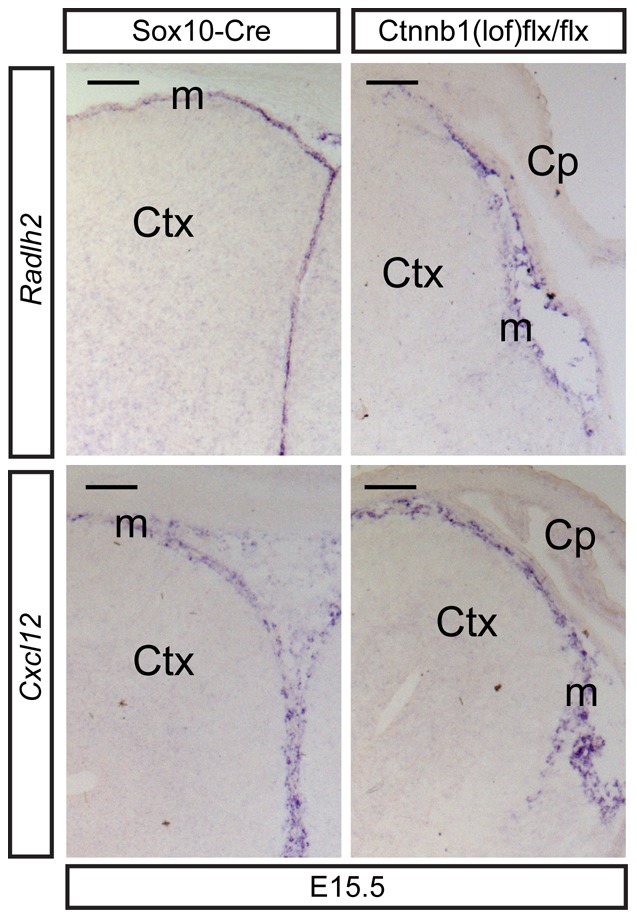
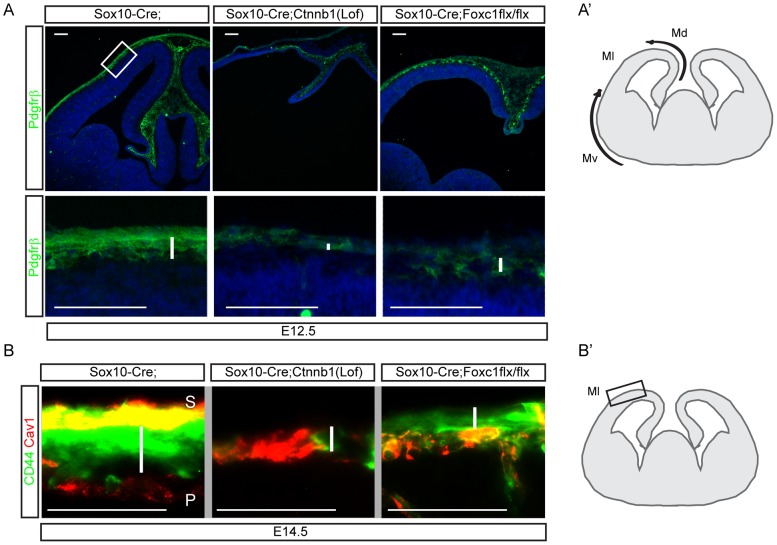
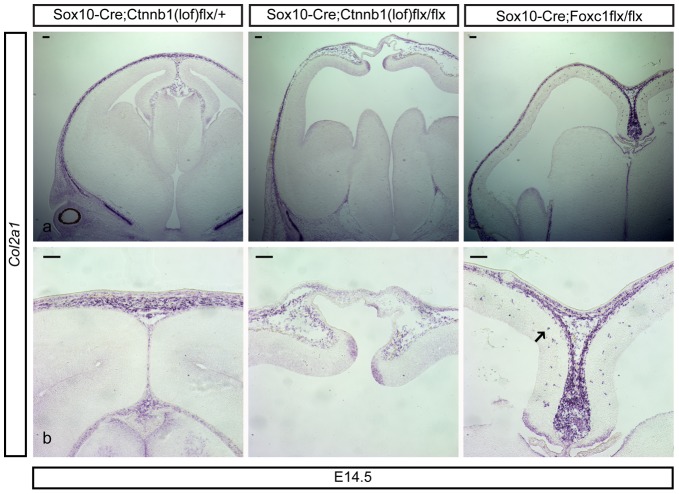
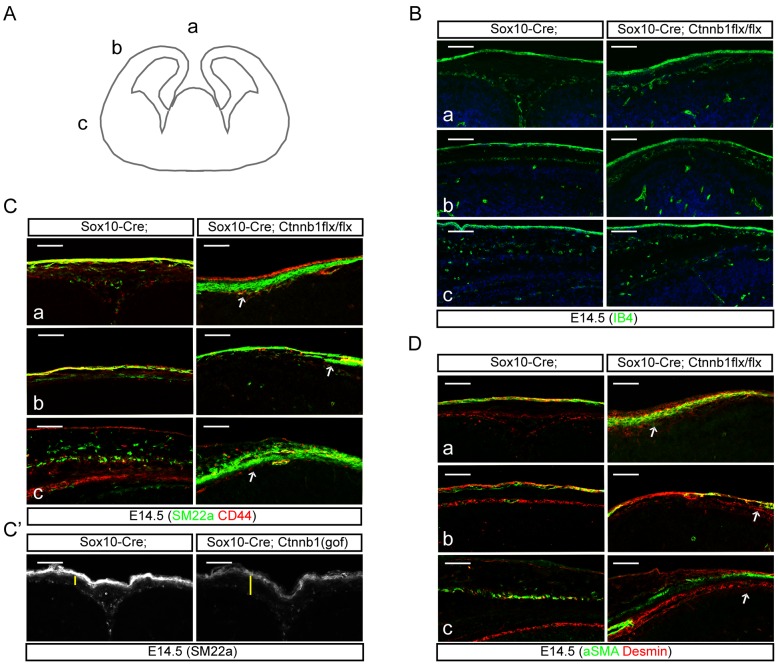
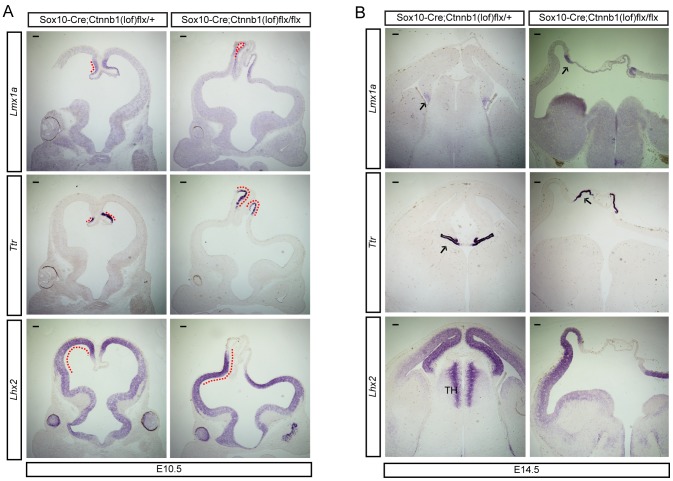
Embryonic neural crest cells contribute to the development of the craniofacial mesenchyme, forebrain meninges and perivascular cells. In this study, we investigated the function of ß-catenin signaling in neural crest cells abutting the dorsal forebrain during development. In the absence of ß-catenin signaling, neural crest cells failed to expand in the interhemispheric region and produced ectopic smooth muscle cells instead of generating dermal and calvarial mesenchyme. In contrast, constitutive expression of stabilized ß-catenin in neural crest cells increased the number of mesenchymal lineage precursors suggesting that ß-catenin signaling is necessary for the expansion of neural crest-derived mesenchymal cells. Interestingly, the loss of neural crest-derived mesenchymal stem cells (MSCs) leads to failure of telencephalic midline invagination and causes ventricular system defects. This study shows that ß-catenin signaling is required for the switch of neural crest cells to MSCs and mediates the expansion of MSCs to drive the formation of mesenchymal structures of the head. Furthermore, loss of these structures causes striking defects in forebrain morphogenesis.


Conflict of interest statement

Competing Interests: The authors have declared that no competing interests exist.

Figures

Figure 1
Figure 1. Wnt-responding mesenchymal cells expand in the dorsal interhemispheric region.
A) Staining of Pdgfrß+ neural crest-derived mesenchymal cells from E10 to E14. Dashed lines highlight the dorsomedial mesenchymal cells, which expand at E10 and spread laterally at later ages. At E14, perivascular cells strongly express Pdgfrß. B) A diagram showing mesenchymal cells at the level of dorsoventral axis in the forebrain; the dorsal (Md), lateral (Ml), and ventral (Mv) mesenchymal cells. The derivatives of the neural crest cells are listed with markers used in this study. Ep = epidermis, Ch = cortical hem, Cp = choroid plexus, P = pericytes, m = meninges. C) X-gal staining of E10.5 Bat-gal transgenic embryos. A high power image of the boxed area of C-a is presented in C-b. X-gal+ mesenchymal cells are localized in the interhemispheric region (red dashed lines). D) X-gal staining of E10 ROSA-lacZ Cre reporter mice crossed with Sox10-Cre, a neural crest driver. A high magnification image of the boxed area in D-a is shown in D-b. Red dashed lines mark the area with mesenchymal cells. Scale bars = 100 µm.
Figure 2
Figure 2. Expansion of mesenchymal cells by activation of β-catenin in neural crest cells.
A) Mesenchymal cells of Sox10-Cre;Ctnnb1(gof) mutant at E16.5 marked by Col2a1 expression (top) and alkaline phosphatase activities (bottom, osteoblasts) obtained from adjacent sections. Higher magnification images of the boxed areas are shown in A′. B) Mesenchymal cells were labeled for Pdgfrα and Ki67 to show the proliferating mesenchymal cells. B′) A graph shows thickness of dermal mesenchymal cells in the midline at E16.5 (white lines of B, n = 3). Error bar indicates SEM. Scale bars = 100 µm.
Figure 3
Figure 3. Normal expansion of neural crest-derived mesenchymal cells is affected by the loss of ß-catenin signaling.
A) Immunofluorescence for mesenchymal cell markers Pdgfrß and Vimentin in Sox10-Cre;Ctnnb1(lof)flx/+ and Sox10-Cre;Ctnnb1(lof)flx/flx embryos at E10.5. Higher magnification images of A-a are shown in A-b. Arrows in A-b indicate mesenchymal cells in the dorsal midline bordered by the dashed lines. A′) Quantification of Pdgfrß+ mesenchymal cells in the interhemispheric region (n = 3). B) Ki67+ proliferating cells were counted from a region adjacent to the cortical hem (CH) at E12.5 (top) and E14.6 (bottom). B′) The drawing shows the area used to count Ki67+ cells in the dashed line and a graph represents quantification of Ki67+ cells (n = 3). C) Ki67+ cells were counted from mesenchymal tissues adjacent to the neocortex at E14.5. C′) The drawing shows the area used to count Ki67+ cells in the dashed line and a graph represents quantification of Ki67+ cells from the area (n = 3). Error bars indicate SEM. Md = dorsal mesenchyme, Ml = lateral mesenchyme. Scale bars = 100 µm.
Figure 4
Figure 4. Conservation of the meninges in neural crest cells lacking β-catenin.
Expression of meningeal markers, Raldh2 and Cxcl12, in the embryonic midline at E15.5. Raldh2 was also expressed in the choroid plexus. Ctx = cortex, Cp = choroid plexus, m = meninges. Scale bars = 100 µm.
Figure 5
Figure 5. Failure of mesenchymal coverage of the neocortex after loss of ß-catenin signaling in neural crest.
A) Sections of E12.5 embryos were stained for Pdgfrß. Dorsomedial Pdgfrß+ mesenchymal cells are shown in the top panel. Higher magnification images of neocortical mesenchymes are presented in the lower panel (corresponding to the boxed region). White bars indicate the distribution of Pdgfrß+ mesenchymal cells. A′) A schematic drawing shows two sources of migrating neural crest cells to the neocortex. Md = dorsal mesenchyme, Ml = lateral mesenchyme, Mv = ventral mesenchyme. B) Sections from E14.5 embryo heads were stained for CD44 and Cav1 to show MSCs and meningeal blood vessels, respectively. Thickness of the CD44 domain is reduced in both Sox10-Cre;Ctnnb1(lof)flx/flx and Sox10-Cre;Foxc1flx/flx mutants than the control (as marked by white bars). B′) A schematic drawing shows the region where images were taken (Ml). Scale bars = 100 µm.
Figure 6
Figure 6. Defective development of calvarial mesenchymal cells by loss of β-catenin in neural crest cells.
In situ hybridization of Col2a1 was conducted to show the condensing calvarial mesenchymal cells at E14.5 (a). Bottom panels show mediodorsal Col2a1 + mesenchymal cells (b). An arrow indicates infiltrating Col2a1 + cells in the Sox10-Cre;Foxc1flx/flx mutants. Scale bars = 100 µm.
Figure 7
Figure 7. Ectopic generation of smooth muscle cells by loss of β-catenin in neural crest cells.
A) A schematic drawing shows the three regions (a, b, and c) used to stain markers for smooth muscle cells. B) Isolectin IB4 staining shows distribution of blood vessels in the epidermis and meninges. Fewer mesenchymal cells were seen in the space between the blood vessels of Sox10-Cre;Ctnnb1(lof)flx/flx mutant embryos. C) SM22a, a marker for the smooth muscle cells, and CD44, a marker for MSCs, were used to characterize the mesenchymal cells in the regions a–c. C′) Sox10-Cre;Ctnnb1(gof) mutant embryos double-stained for SM22a and CD44. Yellow bars indicate the thickness of the mesenchyme. D) aSMA, a marker for smooth muscle cells, and Desmin, a marker for pericytes, were used to reveal the ectopic generation of smooth muscle cells from neural crest cells of Sox10-Cre;Ctnnb1(lof)flx/flx mutant embryos at E14.5. Arrows indicate the incompetent spreading of mesenchymal cells into the ‘b’ region of Sox10-Cre;Ctnnb1(lof)flx/flx mutants. Scale bars = 100 µm.
Figure 8
Figure 8. Failure of telencephalic midline invagination after loss of β-catenin in neural crest cells.
A) In situ hybridization of midline markers. E10.5 embryos from Sox10-Cre;Ctnnb1(lof)flx/+ and Sox10-Cre;Ctnnb1(lof)flx/flx were used to show expression of Lmx1a, Ttr, and Lhx2. The dashed red lines highlight gene expression domains and the inverted dorsomedial telencephalon in Sox10-Cre;Ctnnb1(lof)flx/flx mutants. B) E14.5 embryos from Sox10-Cre;Ctnnb1(lof)flx/+ and Sox10-Cre;Ctnnb1(lof)flx/flx were used to examine the expression of midline markers, Lmx1a, Ttr, Lhx2. Arrows indicate the area of gene expression and highlight the failure of dorsal midline invagination in Sox10-Cre;Ctnnb1(lof)flx/flx mutants. Scale bars = 100 µm.

References

    1. Trainor PA (2005) Specification of neural crest cell formation and migration in mouse embryos. Semin Cell Dev Biol 16: 683–693. - PubMed
    1. Currle DS, Cheng X, Hsu CM, Monuki ES (2005) Direct and indirect roles of CNS dorsal midline cells in choroid plexus epithelia formation. Development 132: 3549–3559. - PubMed
    1. Grove EA, Tole S, Limon J, Yip L, Ragsdale CW (1998) The hem of the embryonic cerebral cortex is defined by the expression of multiple Wnt genes and is compromised in Gli3-deficient mice. Development 125: 2315–2325. - PubMed
    1. Miller JR, Moon RT (1996) Signal transduction through beta-catenin and specification of cell fate during embryogenesis. Genes Dev 10: 2527–2539. - PubMed
    1. Tamada M, Farrell DL, Zallen JA (2012) Abl regulates planar polarized junctional dynamics through beta-catenin tyrosine phosphorylation. Dev Cell 22: 309–319. - PMC - PubMed

Publication types

LinkOut - more resources