. 2014 Feb 6;9(2):e87329.
doi: 10.1371/journal.pone.0087329. eCollection 2014.

Non-replicating Mycobacterium tuberculosis elicits a reduced infectivity profile with corresponding modifications to the cell wall and extracellular matrix

Affiliations

Non-replicating Mycobacterium tuberculosis elicits a reduced infectivity profile with corresponding modifications to the cell wall and extracellular matrix

Joanna Bacon et al. PLoS One. .

Abstract

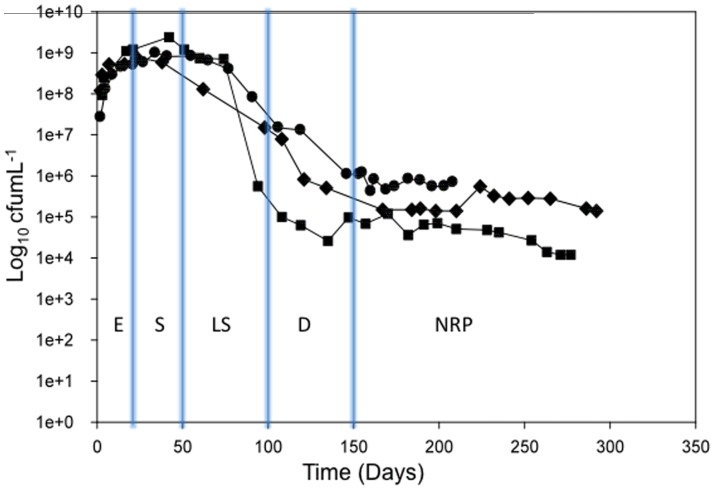
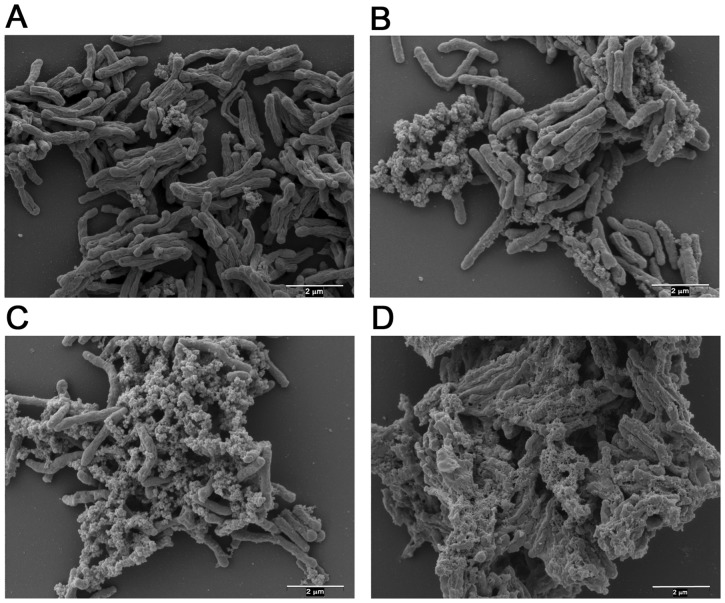
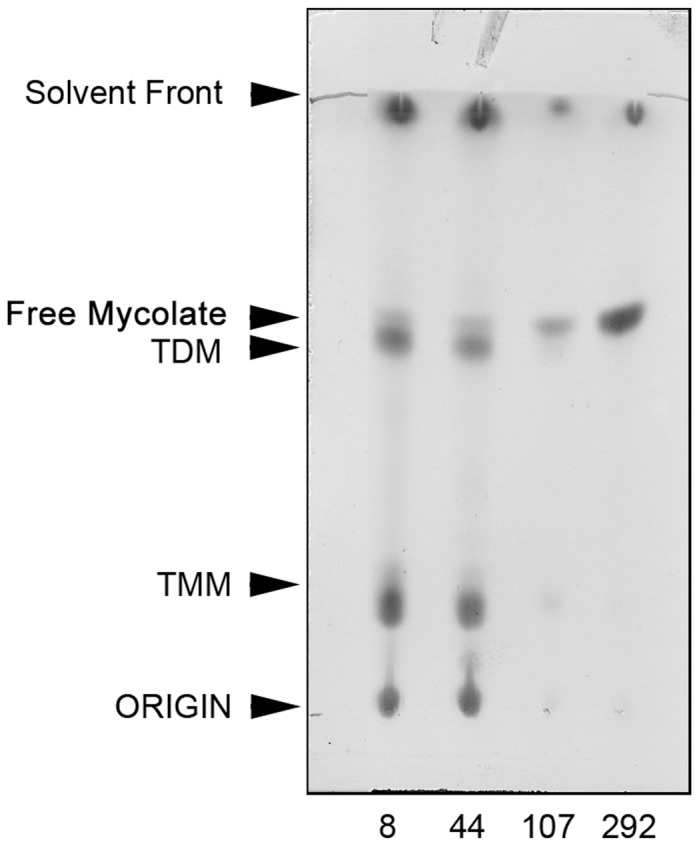
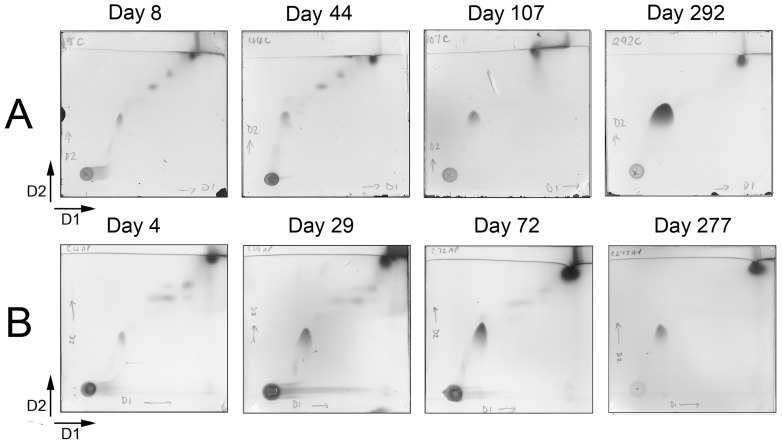
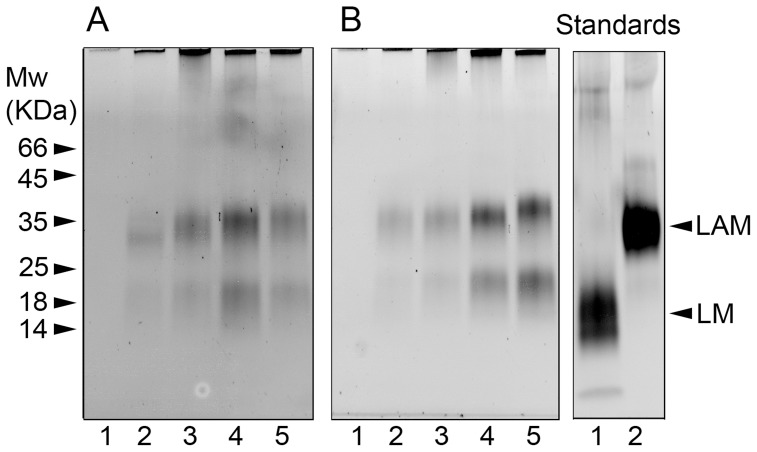
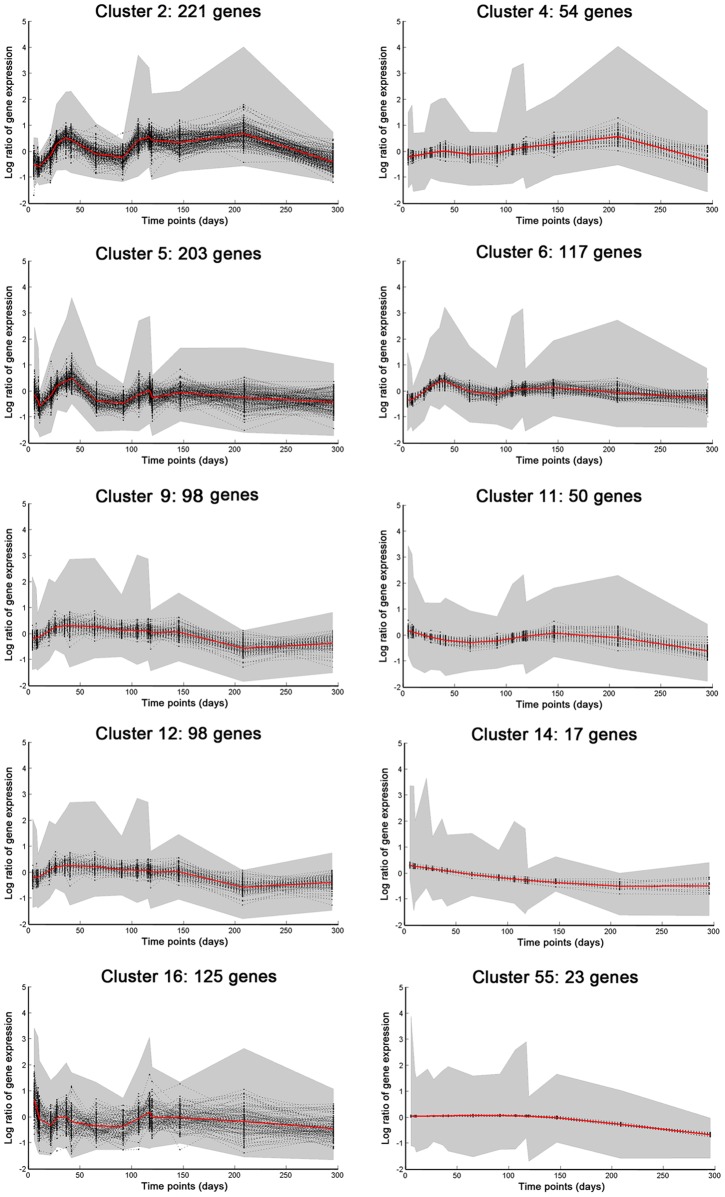
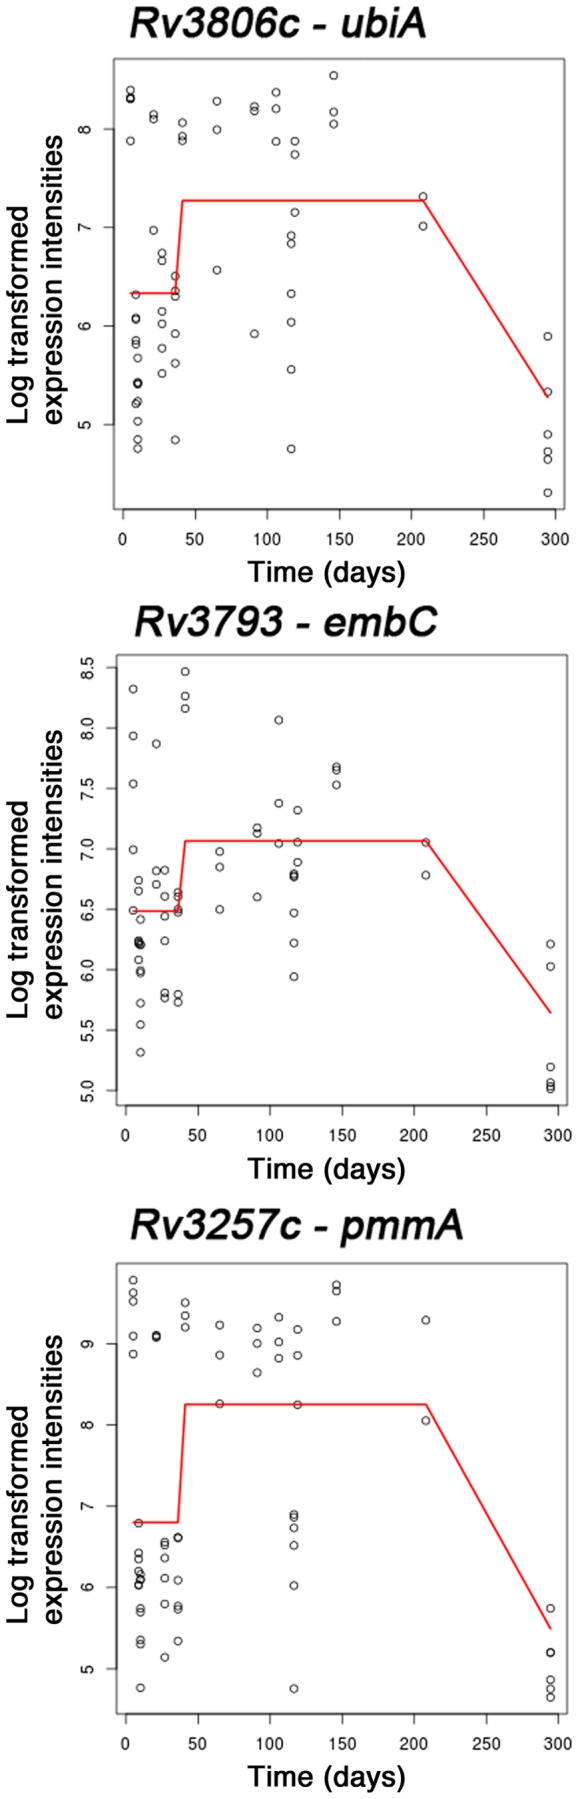
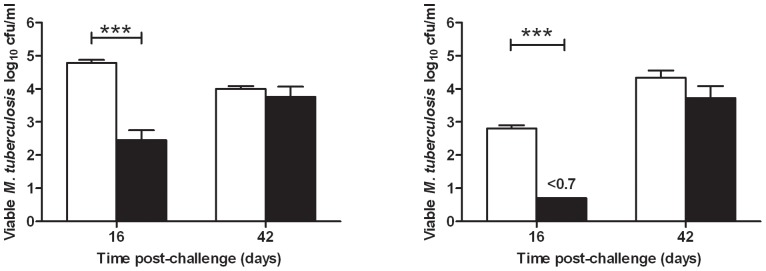
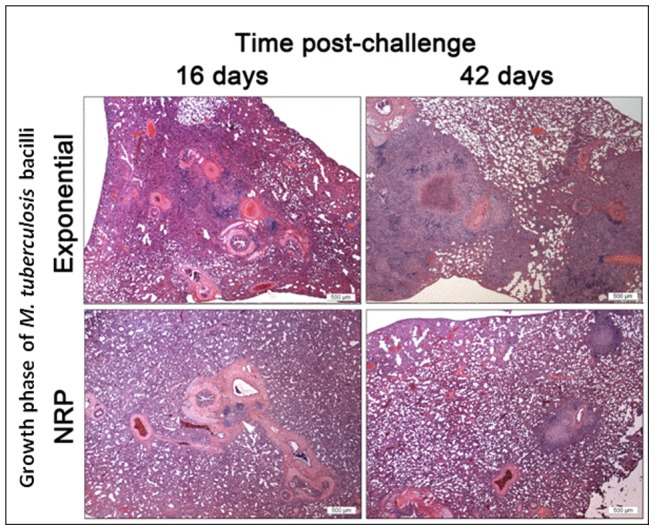
A key feature of Mycobacterium tuberculosis is its ability to become dormant in the host. Little is known of the mechanisms by which these bacilli are able to persist in this state. Therefore, the focus of this study was to emulate environmental conditions encountered by M. tuberculosis in the granuloma, and determine the effect of such conditions on the physiology and infectivity of the organism. Non-replicating persistent (NRP) M. tuberculosis was established by the gradual depletion of nutrients in an oxygen-replete and controlled environment. In contrast to rapidly dividing bacilli, NRP bacteria exhibited a distinct phenotype by accumulating an extracellular matrix rich in free mycolate and lipoglycans, with increased arabinosylation. Microarray studies demonstrated a substantial down-regulation of genes involved in energy metabolism in NRP bacteria. Despite this reduction in metabolic activity, cells were still able to infect guinea pigs, but with a delay in the development of disease when compared to exponential phase bacilli. Using these approaches to investigate the interplay between the changing environment of the host and altered physiology of NRP bacteria, this study sheds new light on the conditions that are pertinent to M. tuberculosis dormancy and how this organism could be establishing latent disease.


Conflict of interest statement

Competing Interests: Ann Williams is an editor for PLOS one. This does not alter the authors' adherence to all the PLOS ONE policies on sharing data and materials. There are no competing interests.

Figures

Figure 1
Figure 1. Growth curves for M. tuberculosis grown in medium containing Tween 80 as the primary carbon source.
Total viable counts for Culture 1 (circles), Culture 2 (diamonds), and Culture 3 (squares), were measured over an extended period of at least 200 days. An estimation of each growth phase is indicated on the graph: exponential phase (E), stationary phase (S), late stationary phase (LS), death phase (D), and non-replicating persistent phase (NRP).
Figure 2
Figure 2. Scanning electron micrograph images of formaldehyde-fixed cells sampled from Culture 2.
Panel A) exponential phase at day 8; Panel B) stationary phase at day 44; Panel C) late stationary phase at day 107; and Panel D) NRP at day 292.
Figure 3
Figure 3. Cells sampled during late stationary phase. Bacilli stained with Ziehl Neelson and the surrounding extracellular material was stained with Alcian Blue, pH×100.
Figure 4
Figure 4. 1D TLC of freely extractable lipids from Culture 2.
Cell biomass was sampled during exponential phase (day 8), stationary phase (day 44), late stationary phase (day 107) and non-replicating persistent phase (day 292). Lipids migrating on the TLC were visualised by staining with MPA and compared to known standards .
Figure 5
Figure 5. 2D TLC analyses of apolar lipids extracted from Culture 2 and Culture 3.
Panel A, cell biomass was sampled from culture 2 during exponential phase (day 8), stationary phase (day 44), late stationary phase (day 107), non-replicating persistent phase (day 292). Panel B, cell biomass was sampled from culture 3 during exponential phase (day 4), stationary phase (day 29), late stationary phase (day 72), NRP phase (day 277). Lipids migrating on the TLC (using solvent system C) were visualised by staining with MPA and compared to known standards .
Figure 6
Figure 6. SDS-PAGE analysis of polysaccharide material isolated from the culture medium during the four phases of growth in culture 2 and culture 3.
Culture 2 in Panel A; polysaccharide material was purified from liquid medium prior to inoculation in lane 1, exponential phase growth (day 8) in lane 2, stationary phase growth (day 44) in lane 3, late stationary phase growth (day 107) in lane 4 and NRP phase growth (day 292) in lane 5. Culture 3 in Panel B, polysaccharide material was purified from liquid medium prior to inoculation in lane 1, exponential phase growth (day 4) in lane 2, stationary phase growth (day 29) in lane 3, late stationary phase growth (day 72) in lane 4 and NRP phase growth (day 278) lane 5. For comparison, the panel on the right shows LM (lane 1) and LAM (lane 2) previously isolated from M. tuberculosis H37Rv cultured exponentially in liquid medium.
Figure 7
Figure 7. Gene expression clusters with a marked enrichment in fatty acid metabolism, lipid degradation, and cell wall re-modeling.
Graphs show normalised log expression values (centered around a mean value of zero) over the time-courses in Cultures 1 and 2. The shaded area represents the 99% confidence interval for the curves.
Figure 8
Figure 8. Gene expression profiles for LAM biosynthetic genes, Rv3257c (pmmA), Rv3793 (embC), Rv3806c (ubiA).
The lines on the graphs show the average normalised log ratios of gene expression over the time-courses in Cultures 1 and 2.
Figure 9
Figure 9. Bacterial load at day 16 and day 42 in guinea pigs post aerosol challenge with either log phase culture or NRP culture.
Lungs in Panel A) and spleen in Panel B), challenged with either exponentially growing culture (white) or NRP culture of M. tuberculosis (black). Bars indicate group mean log10 cfu mL−1 +/− S.E.M of 8 guinea pigs. Statistical analysis was performed using paired T-tests. *** indicates P = <0.001.
Figure 10
Figure 10. Histopathological changes in guinea pig lung following aerosol challenge with M. tuberculosis cultured from different growth phases of nutrient starvation at days 16 and 42 post challenge.
H&E. Magnification bar, 500 µm.
Figure 11
Figure 11. Subjective histopathology scores of post mortem at 16 and 42 days post aerosol challenge.
Lung in Panel A) and spleen in Panel B) challenged with either exponentially growing culture (white) or NRP cultures of M. tuberculosis (black). Bars indicate group mean of 8 animals. Histopathological changes in the lung were recorded either as consolidated (no-shaded bars), necrotic (heavy-shaded bars) or calcified (light shaded bars). Spleen scores for each animal comprise number, size, and foci of necrosis and calcification.

References

    1. Russell DG, VanderVen BC, Lee W, Abramovitch RB, Kim M, et al. (2010) Mycobacterium tuberculosis wears what it eats. Cell Host and Microbe 8: 68–76. - PMC - PubMed
    1. Ulrichs T, Kaufmann SHE (2006) New insights into the function of granulomas in human tuberculosis. J Pathol 208: 261–269. - PubMed
    1. Lenaerts AJ, Hoff D, Aly S, Ehlers S, Andries K, et al. (2007) Location of persisting mycobacteria in a guinea pig model of tuberculosis revealed by r207910. Antimicrob Agents Chemother 51: 3338–3345. - PMC - PubMed
    1. Russell DG (2011) Mycobacterium tuberculosis and the intimate discourse of a chronic infection. Immunol Rev 240: 252–268. - PMC - PubMed
    1. Wayne LG, Lin KY (1982) Glyoxylate metabolism and adaptation of Mycobacterium tuberculosis to survival under anaerobic conditions. Infect Immun 37: 1042–1049. - PMC - PubMed

Publication types

MeSH terms

LinkOut - more resources