. 2014 Feb 6;9(2):e87351.
doi: 10.1371/journal.pone.0087351. eCollection 2014.

Automated detection of synapses in serial section transmission electron microscopy image stacks

Affiliations

Automated detection of synapses in serial section transmission electron microscopy image stacks

Anna Kreshuk et al. PLoS One. .

Abstract

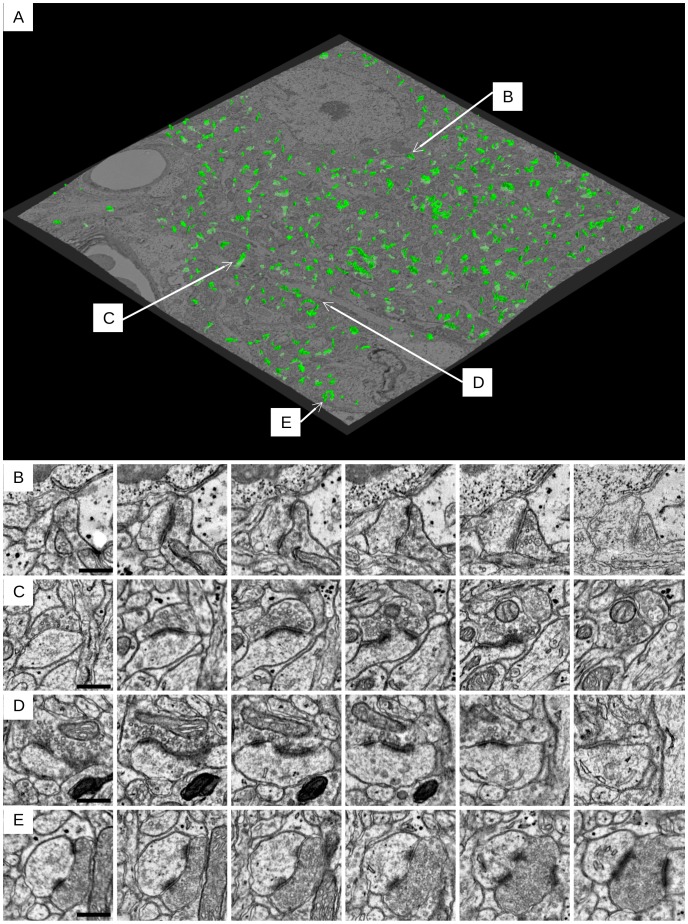
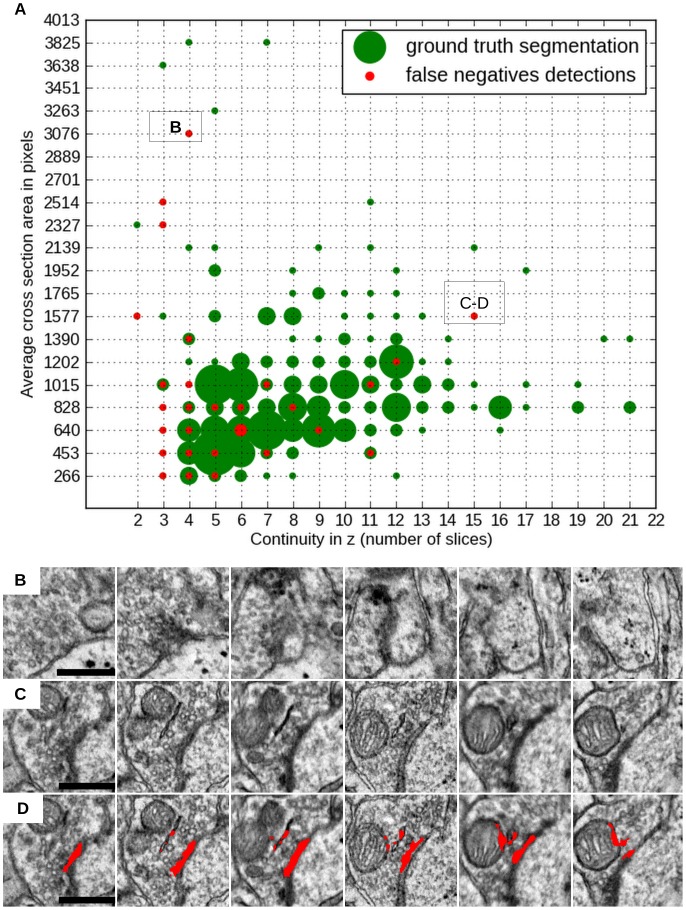
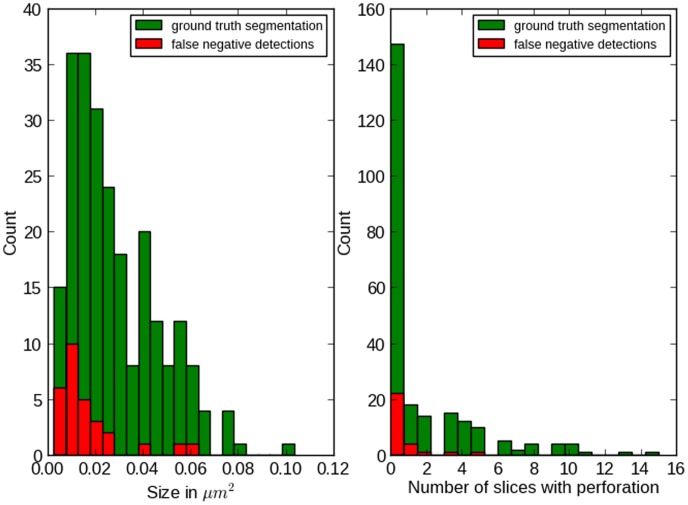
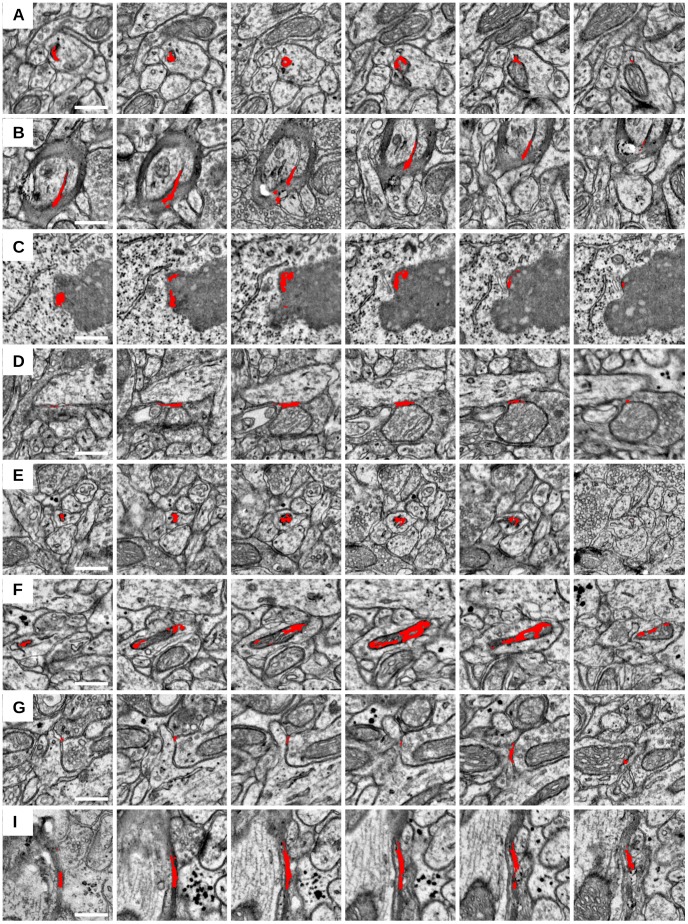
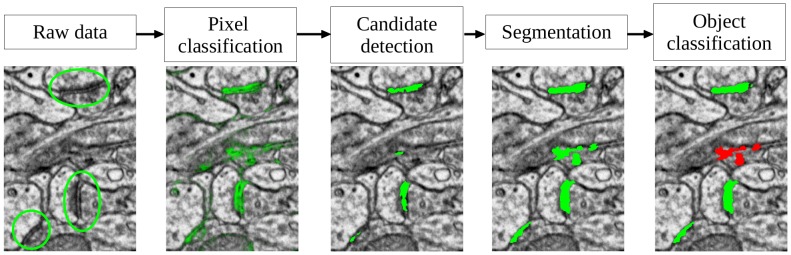
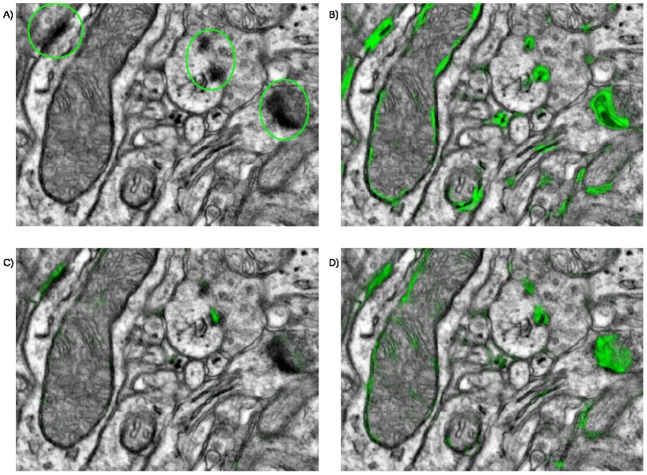
We describe a method for fully automated detection of chemical synapses in serial electron microscopy images with highly anisotropic axial and lateral resolution, such as images taken on transmission electron microscopes. Our pipeline starts from classification of the pixels based on 3D pixel features, which is followed by segmentation with an Ising model MRF and another classification step, based on object-level features. Classifiers are learned on sparse user labels; a fully annotated data subvolume is not required for training. The algorithm was validated on a set of 238 synapses in 20 serial 7197×7351 pixel images (4.5×4.5×45 nm resolution) of mouse visual cortex, manually labeled by three independent human annotators and additionally re-verified by an expert neuroscientist. The error rate of the algorithm (12% false negative, 7% false positive detections) is better than state-of-the-art, even though, unlike the state-of-the-art method, our algorithm does not require a prior segmentation of the image volume into cells. The software is based on the ilastik learning and segmentation toolkit and the vigra image processing library and is freely available on our website, along with the test data and gold standard annotations (http://www.ilastik.org/synapse-detection/sstem).


Conflict of interest statement

Competing Interests: The authors have declared that no competing interests exist.

Figures

Figure 1
Figure 1. Synapses, detected in the test dataset.
A: A 3D view of the synapses, detected in the test dataset. The detected synapses are shown in green. The central slice of the raw data is also shown for illustration (the shape distortion is caused by elastic stack registration). The data volume was downsampled by a factor of 10 in the x and y dimensions to show the full volume. B, C, D, E: More detailed synapse examples as an image series. Scale bars: 450 nm, every second slice is shown (distance between consecutive images is 90 nm).
Figure 2
Figure 2. False negative errors.
A - distribution of false negative errors as a function of the synapse average cross section area and continuity in z. For each bin of the 2D histogram its count is proportional to the radius of the displayed circle. Cross section area was measured in pixels and averaged across 5 central slices. B, C - serial sections of false negative detections. D – erroneous algorithm segmentation. All scale bars – 450 nm.
Figure 3
Figure 3. False negative errors against synapse size and perforation.
Left: distribution of false negative errors as a function of synapse size (see text for details on size estimation). Right: distribution of false negative detections as a function of the number of slices, where the synapse is perforated.
Figure 4
Figure 4. Examples of false positive detections.
All scale bars – 450 nm, every second slice is shown (distance between consecutive images is 90 nm).
Figure 5
Figure 5. The proposed synapse detection pipeline.
Left to right: raw data with 3 synapses, shown in green circles; probability map of the synapse class; detection results; graph cut segmentation results; object classification results, with positively classified objects shown in green and the negatively classified object in red.
Figure 6
Figure 6. Benefits of 3D processing with upsampling.
A: raw data, with three synapses in green circles. B: probability map of the synapse class after classification with 2D features – low precision of the prediction. C: same for classification with 3D features without upsampling – low recall. D: same for classification with 3D features and upsampling by 2 along the z axis. The remaining false positives are filtered out by the object classification step.

References

    1. Lichtman JW, Sanes JR (2008) Ome sweet ome: what can the genome tell us about the connectome? Current opinion in neurobiology 18: 346–53. - PMC - PubMed
    1. Morgan JL, Lichtman JW (2013) Why not connectomics? Nature Methods 10: 494–500. - PMC - PubMed
    1. Seung HS (2009) Reading the book of memory: sparse sampling versus dense mapping of connectomes. Neuron 62: 17–29. - PubMed
    1. Briggman KL, Helmstaedter M (2011) DenkW (2011) Wiring specificity in the direction-selectivity circuit of the retina. Nature 471: 183–8. - PubMed
    1. Bock DD, Lee WCA, Kerlin AM, Andermann ML, Hood G, et al. (2011) Network anatomy and in vivo physiology of visual cortical neurons. Nature 471: 177–82. - PMC - PubMed

Publication types