A framework including recombination for analyzing the dynamics of within-host HIV genetic diversity
- PMID: 24516557
- PMCID: PMC3917834
- DOI: 10.1371/journal.pone.0087655
A framework including recombination for analyzing the dynamics of within-host HIV genetic diversity
Abstract
This paper presents a novel population genetic model and a computationally and statistically tractable framework for analyzing within-host HIV diversity based on serial samples of HIV DNA sequences. This model considers within-host HIV evolution during the chronic phase of infection and assumes that the HIV population is homogeneous at the beginning, corresponding to the time of seroconversion, and evolves according to the Wright-Fisher reproduction model with recombination and variable mutation rate across nucleotide sites. In addition, the population size and generation time vary over time as piecewise constant functions of time. Under this model I approximate the genealogical and mutational processes for serial samples of DNA sequences by a continuous coalescent-recombination process and an inhomogeneous Poisson process, respectively. Based on these derivations, an efficient algorithm is described for generating polymorphisms in serial samples of DNA sequences under the model including various substitution models. Extensions of the algorithm are also described for other demographic scenarios that can be more suitable for analyzing the dynamics of genetic diversity of other pathogens in vitro and in vivo. For the case of the infinite-sites model, I derive analytical formulas for the expected number of polymorphic sites in sample of DNA sequences, and apply the developed simulation and analytical methods to explore the fit of the model to HIV genetic diversity based on serial samples of HIV DNA sequences from 9 HIV-infected individuals. The results particularly show that the estimates of the ratio of recombination rate over mutation rate can vary over time between very high and low values, which can be considered as a consequence of the impact of selection forces.
Conflict of interest statement
Figures

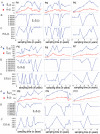
 and average numbers of pairwise differences,
  in serial samples are plotted with respect to the sampling times; the data points determined by the two statistics are connected by blue and red lines, respectively. (B) and (C) show the expected numbers of polymorphic sites in serial samples under the Wright-Fisher model with constant population size combined with the finite-sites Jukes-Cantor model, as well as with the infinite-sites model, respectively. Under these substitution models, the expected values of this statistic for sample size
  at time
  are denoted by
  and
and  respectively. The expected average numbers of pairwise differences for the serial samples in each individual's case are not shown since they are the same for the samples.
 and
and  respectively. (B) and (C) show the normalized values of the expected numbers (Figure 1) of polymorphic sites in serial samples under the finite-site Jukes-Cantor model and the infinite-sites model denoted by
  and
and  respectively. The normalized values of the expected average numbers of pairwise differences in serial samples are equal to 0 and are not plotted.
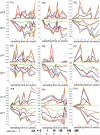
 and divergences,
  in the serial samples to their expected values, denoted by
 and
and 
 respectively. (A) shows the observed and fitted (expected) values of the numbers of polymorphic sites in serial samples. The observed and expected data points are connected by red and blue lines, respectively. (B) shows the observed and fitted (expected) values of the divergences in serial samples. Based on this fitting the vectors
  and
and  are estimated, and for the fitted model the predicted (expected) values of the average numbers of pairwise differences in serial samples are computed. (C) shows the observed and predicted values of this statistic in the serial samples, and the statistics are denoted by
  and
and 
 respectively.
 and
and  are denoted by
  The observed and expected values of this statistic under the infinite-sites model and the finite-sites model are denoted by

 and
and 
 respectively. (A) shows the observed values of
  in the serial samples for each individual's case. (B) and (C) show the predicted (expected) values of
  in the serial samples for each individual's case computed receptively under the fitted models for the cases of the infinite-sites and finite-sites models.
 and divergences,
  in the serial samples to their expected values, denoted by
 and
and 
 respectively. (A) shows the observed and fitted (expected) values of the numbers of polymorphic sites in serial samples. The observed and expected data points are connected by red and blue lines, respectively. (B) shows the observed and fitted (expected) values of the divergences in serial samples. Based on this fitting the vectors
  and
and  are estimated, and for the fitted model the predicted (expected) values of the average numbers of pairwise differences in serial samples are computed. (C) shows the observed and predicted values of this statistic in the serial samples and are denoted by
  and
and 
 respectively.
 and
and  as well as their expected values are plotted with respect to the sampling times. The observed data points are connected by red lines. For each of the values of
  equal to 0, 1, 10, 50, 100, and 200, the expected values of these two statistics are computed by using Monte Carlo approach and Algorithm 1 based on the estimated values of the vectors
  and
and  for the finite-sites case.
 and
and  at sampling time points are connected by red lines. For each of the values of
  and at each sampling time point the 95% probability interval is inferred by estimating 2.5% and 97.5% quantiles of the statistics under the estimated model in the finite-sites case. The vertical intervals at the sampling time points represent the 95% probability intervals in green, black, and orange when
  is 0, 1, or 200, respectively. In each case the same colors are respectively used to connect the expected values of the statistics.
Similar articles
-
Analytical framework for identifying and differentiating recent hitchhiking and severe bottleneck effects from multi-locus DNA sequence data.PLoS One. 2012;7(5):e37588. doi: 10.1371/journal.pone.0037588. Epub 2012 May 25. PLoS One. 2012. PMID: 22662176 Free PMC article.
-
Coalescent Inference Using Serially Sampled, High-Throughput Sequencing Data from Intrahost HIV Infection.Genetics. 2016 Apr;202(4):1449-72. doi: 10.1534/genetics.115.177931. Epub 2016 Feb 8. Genetics. 2016. PMID: 26857628 Free PMC article.
-
HIV-1 intra-subtype superinfection rates: estimates using a structured coalescent with recombination.Infect Genet Evol. 2005 Jan;5(1):85-95. doi: 10.1016/j.meegid.2004.07.001. Infect Genet Evol. 2005. PMID: 15567142
-
Modeling sequence evolution in acute HIV-1 infection.J Theor Biol. 2009 Nov 21;261(2):341-60. doi: 10.1016/j.jtbi.2009.07.038. Epub 2009 Aug 4. J Theor Biol. 2009. PMID: 19660475 Free PMC article. Review.
-
HIV evolutionary dynamics within and among hosts.AIDS Rev. 2006 Jul-Sep;8(3):125-40. AIDS Rev. 2006. PMID: 17078483 Review.
Cited by
-
Purifying selection, drift, and reversible mutation with arbitrarily high mutation rates.Genetics. 2014 Dec;198(4):1587-602. doi: 10.1534/genetics.114.167973. Epub 2014 Sep 16. Genetics. 2014. PMID: 25230951 Free PMC article.
References
Publication types
MeSH terms
Grants and funding
LinkOut - more resources
Full Text Sources
Other Literature Sources
Medical

