. 2014 Feb 6;8(2):e2682.
doi: 10.1371/journal.pntd.0002682. eCollection 2014 Feb.

Inferring Plasmodium vivax transmission networks from tempo-spatial surveillance data

Affiliations

Inferring Plasmodium vivax transmission networks from tempo-spatial surveillance data

Benyun Shi et al. PLoS Negl Trop Dis. .

Abstract

Background: The transmission networks of Plasmodium vivax characterize how the parasite transmits from one location to another, which are informative and insightful for public health policy makers to accurately predict the patterns of its geographical spread. However, such networks are not apparent from surveillance data because P. vivax transmission can be affected by many factors, such as the biological characteristics of mosquitoes and the mobility of human beings. Here, we pay special attention to the problem of how to infer the underlying transmission networks of P. vivax based on available tempo-spatial patterns of reported cases.

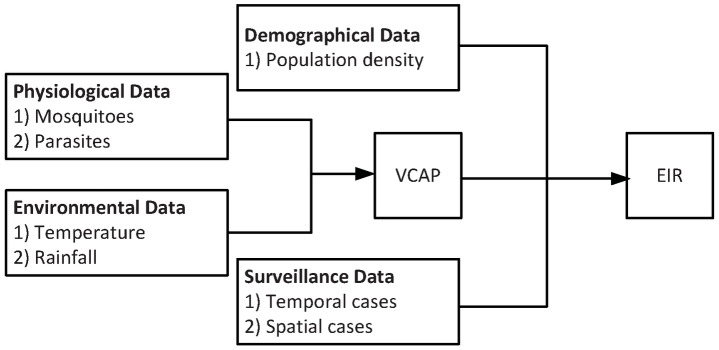
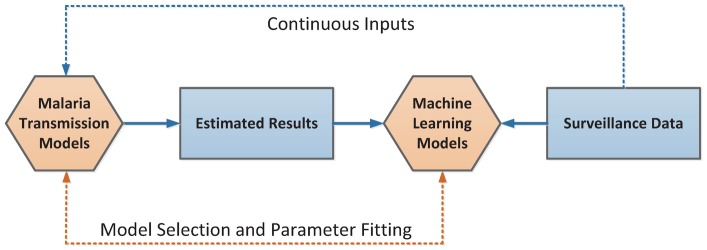
Methodology: We first define a spatial transmission model, which involves representing both the heterogeneous transmission potential of P. vivax at individual locations and the mobility of infected populations among different locations. Based on the proposed transmission model, we further introduce a recurrent neural network model to infer the transmission networks from surveillance data. Specifically, in this model, we take into account multiple real-world factors, including the length of P. vivax incubation period, the impact of malaria control at different locations, and the total number of imported cases.

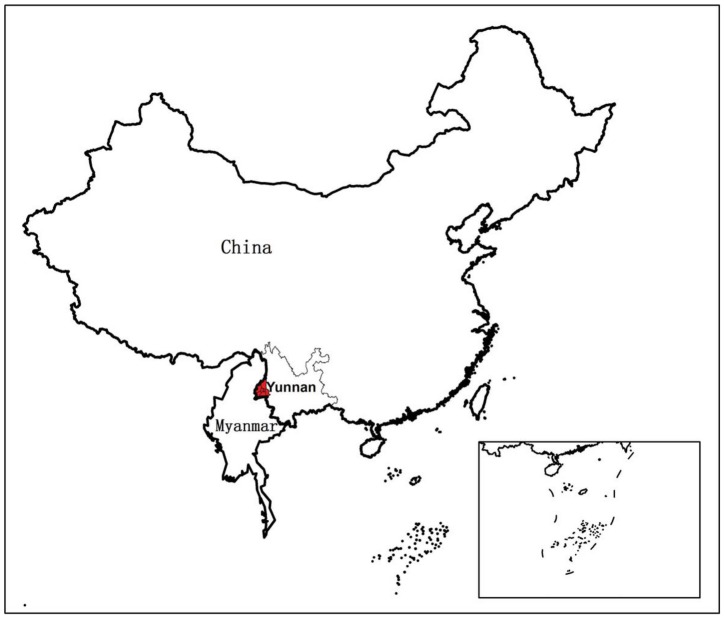
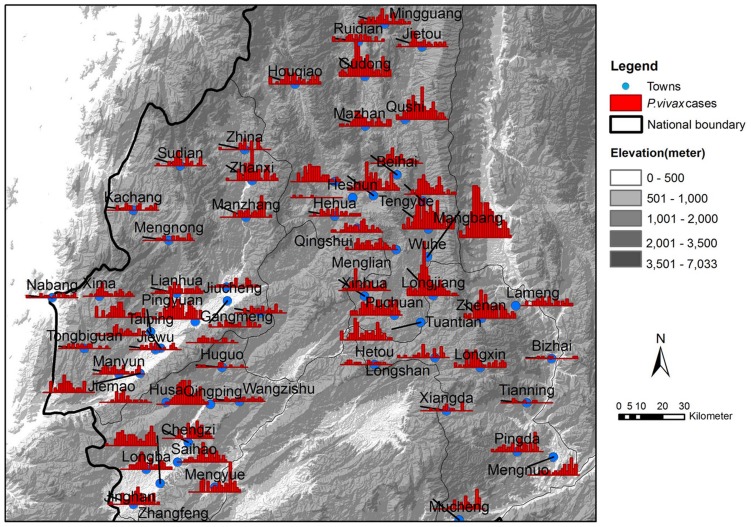
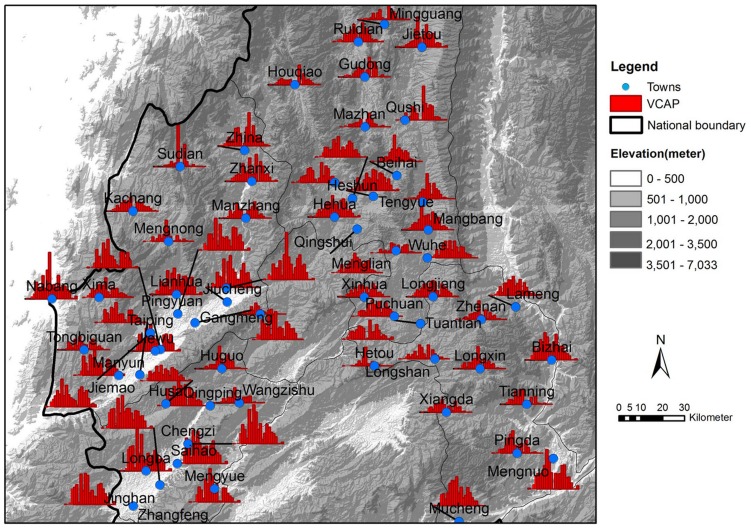
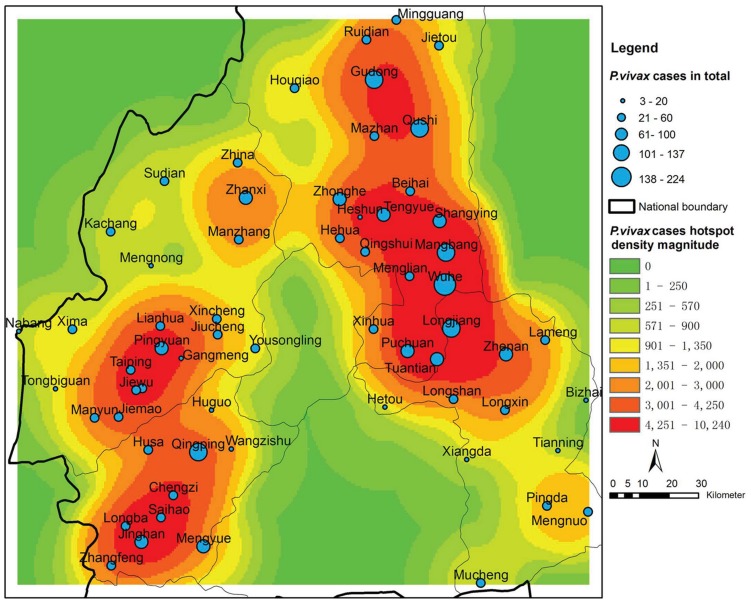
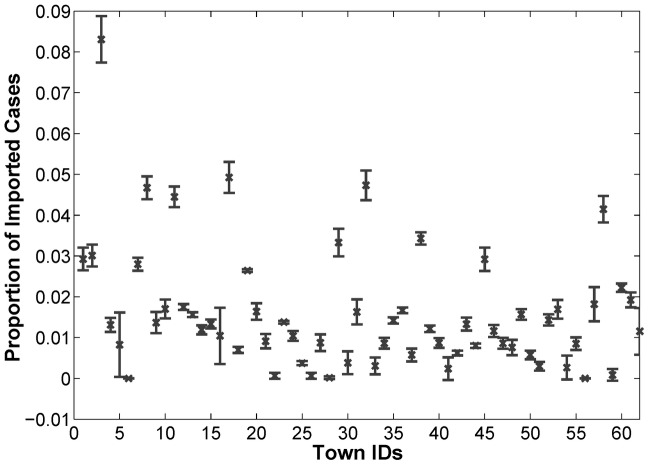
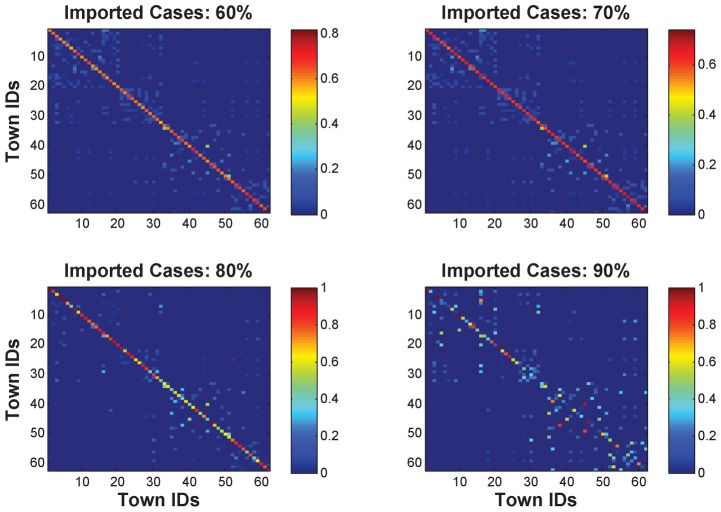
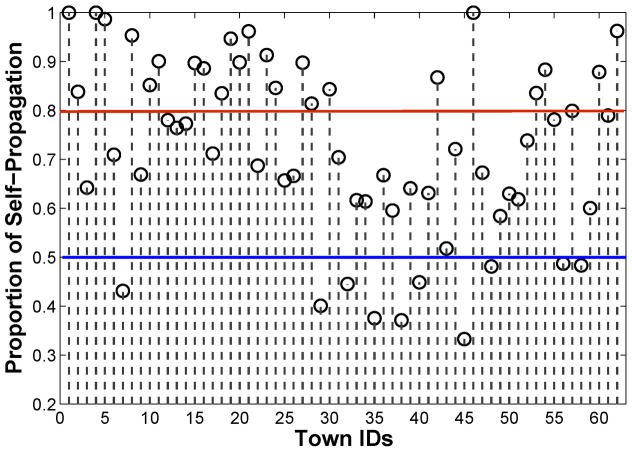
Principal findings: We implement our proposed models by focusing on the P. vivax transmission among 62 towns in Yunnan province, People's Republic China, which have been experiencing high malaria transmission in the past years. By conducting scenario analysis with respect to different numbers of imported cases, we can (i) infer the underlying P. vivax transmission networks, (ii) estimate the number of imported cases for each individual town, and (iii) quantify the roles of individual towns in the geographical spread of P. vivax.

Conclusion: The demonstrated models have presented a general means for inferring the underlying transmission networks from surveillance data. The inferred networks will offer new insights into how to improve the predictability of P. vivax transmission.


Conflict of interest statement

The authors have declared that no competing interests exist.

Figures

Figure 1
Figure 1. An illustration of the studied areas in Yunnan, P.R. China.
The areas marked in red are located near the border between China and Myanmar.
Figure 2
Figure 2. The reported P. vivax cases of the 62 towns in Yunnan, P.R. China, in 2005.
The blue points represent the 62 towns in Yunnan. The red bars refer to the numbers of P. vivax cases in the corresponding towns aggregated over a duration of 16 days.
Figure 3
Figure 3. The estimated VCAP values of the 62 towns in Yunnan, P.R. China, in 2005.
The blue points represent the 62 towns in Yunnan. The red bars refer to the estimated VCAP values based on the temperature and rainfall in corresponding towns and time steps (i.e., 16 days for each time step).
Figure 4
Figure 4. A illustration of modeling infection risks of P. vivax at each individual town.
The notion of vectorial capacity (VCAP) is defined as “the number of potentially infective contacts an individual person makes, through vector population, per unit time.” The notion of entomological incubation rate (EIR) is defined as the number of infectious bites received per day by a human being. The calculation in this paper is based on the work of Ceccato et al. and Smith and McKenzie .
Figure 5
Figure 5. An illustration of the recurrent neural network model.
There are totally formula image 
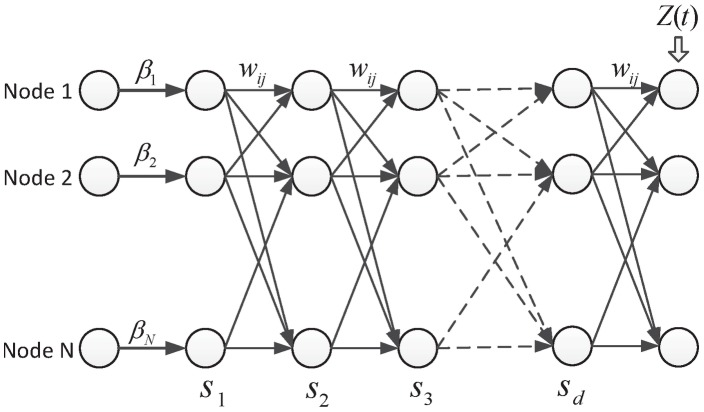
hidden layers in the neural network, each of which consists of formula image nodes representing the nodes in original formula image. formula image represents the control impact of each node, formula image is the number of imported cases, and the links between two hidden layers are determined by the transportation network structure.
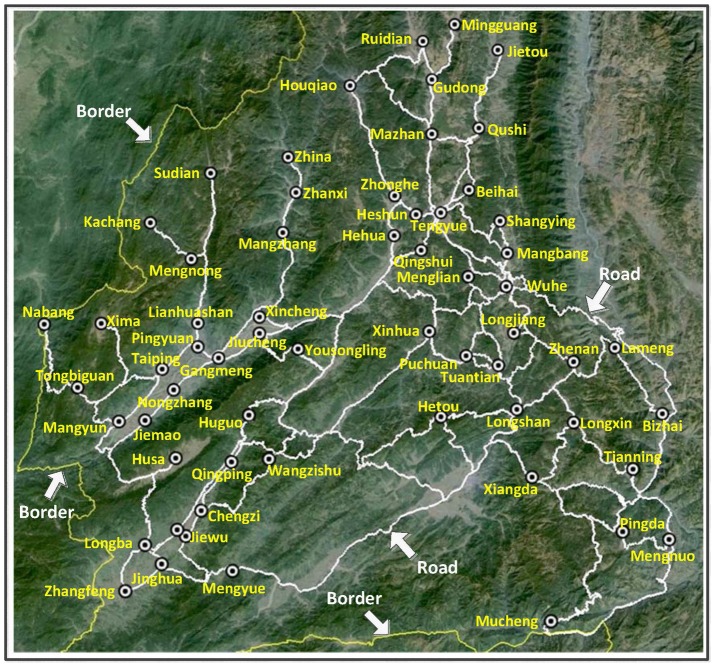
Figure 6
Figure 6. An illustration of the road transportation network among the 62 towns in Yunnan, P.R. China.
The roads are obtained using Google Maps API. A direct road between two towns without passing through other towns will be included.
Figure 7
Figure 7. A smoothed surface map with respect to the total number of P. vivax cases in each individual town.
The size of the nodes in blue represents the total number of reported cases. The colored surface represents the hotspot density magnitude of P. vivax cases after smoothing.
Figure 8
Figure 8. The estimated proportion of imported cases for each individual town in different scenarios.
The error bars represent the standard deviations of the four scenarios with 60%, 70%, 80%, and 90% imported cases in the total number of reported cases. It can be observed that for most towns, the proportion of imported cases does not vary too much.
Figure 9
Figure 9. The inferred P. vivax transmission networks for scenarios with 60%, 70%, 80%, and 90% imported cases.
The colors represent the relative strength of malaria transmission from one town to another. Note that the diagonal entries refer to the self-propagation of P. vivax within individual towns.
Figure 10
Figure 10. The estimated proportion of self-propagation for individual towns under the scenario with 80% imported cases.
The red and blue lines show the thresholds for classifying self-propagating towns and diffusive towns, respectively.
Figure 11
Figure 11. An illustration of the proposed machine learning approach to predicting the patterns of malaria transmission.
On the one hand, the surveillance data can serve as continuous inputs for a malaria transmission model, which is used to predict malaria transmission patterns. On the other hand, the surveillance data can also perform as measures of an appropriate machine learning model such that both the malaria transmission model and the parameters in the model can be adjusted accordingly.

References

    1. Gething PW, Elyazar IRF, Moyes CL, Smith DL, Battle KE, et al. (2012) A long neglected world malaria map: Plasmodium vivax endemicity in 2010. PLoS Neglected Tropical Diseases 6: e1814. - PMC - PubMed
    1. World Health Organization (2005) Malaria Control Today - Current WHO Recommendation. Geneva: WHO Working Document.
    1. Hay SI, Snow RW (2006) The malaria atlas project: developing global maps of malaria risk. PLoS Medicine 3: e473. - PMC - PubMed
    1. Cohen JM, Smith DL, Cotter C, Ward A, Yamey G, et al. (2012) Malaria resurgence: a systematic review and assessment of its causes. Malaria Journal 11: e122. - PMC - PubMed
    1. Eckhoff PA (2011) A malaria transmission-directed model of mosquito life cycle and ecology. Malaria Journal 10: e303. - PMC - PubMed

Publication types

LinkOut - more resources