Review
. 2014 Mar-Apr;30(2-3):191-201.
doi: 10.1089/jop.2013.0190. Epub 2014 Feb 11.

Tissue-based imaging model of human trabecular meshwork

Affiliations
Review

Tissue-based imaging model of human trabecular meshwork

Edward R Chu et al. J Ocul Pharmacol Ther. 2014 Mar-Apr.

Abstract

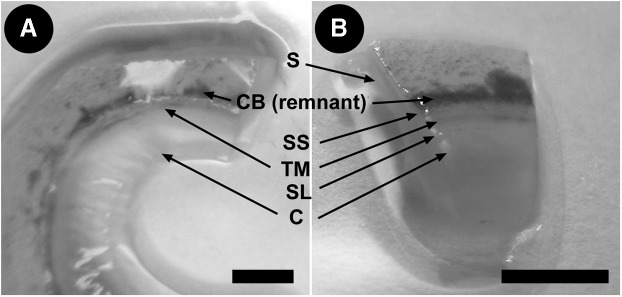
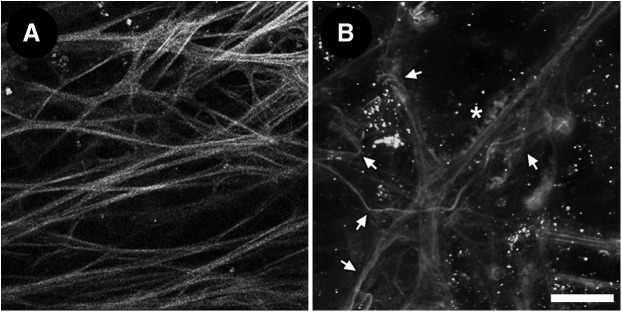
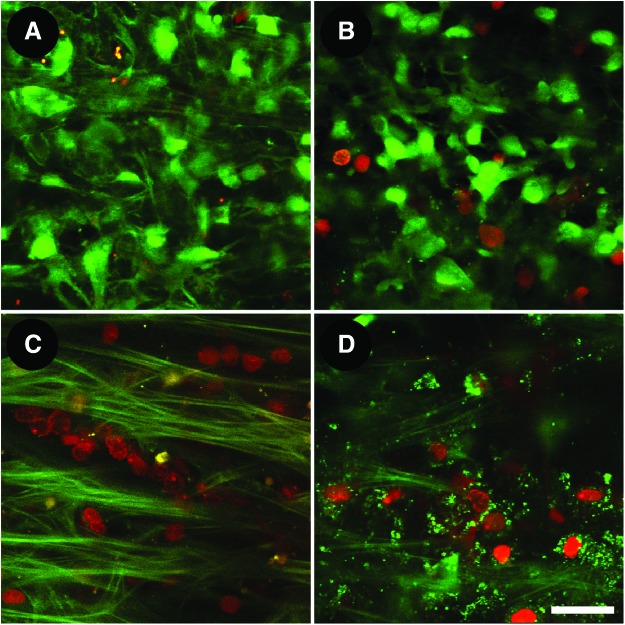
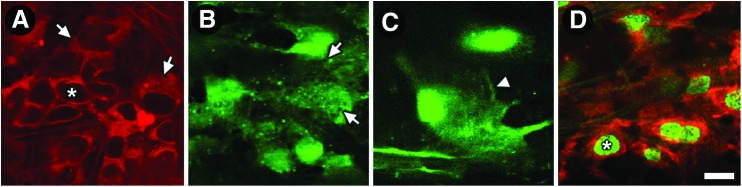
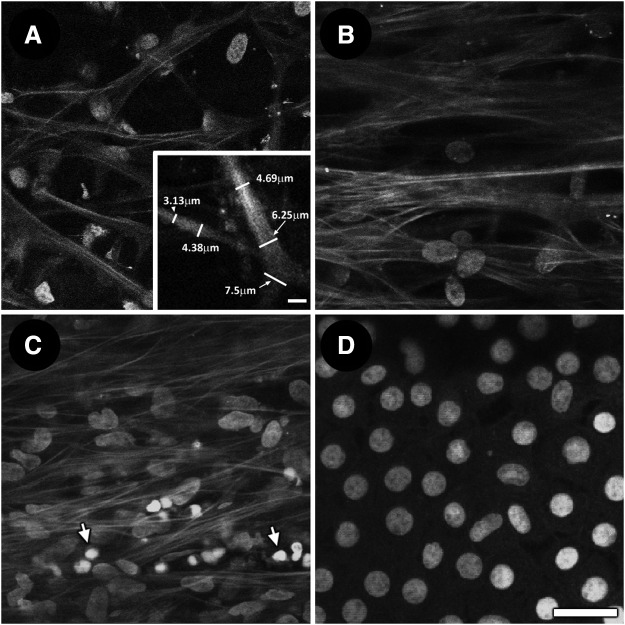
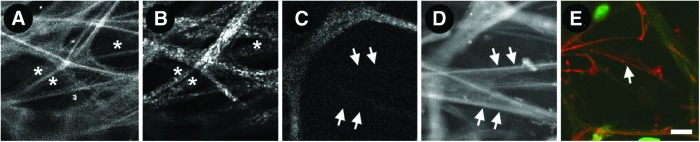
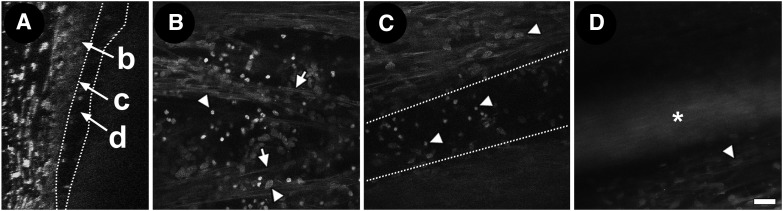
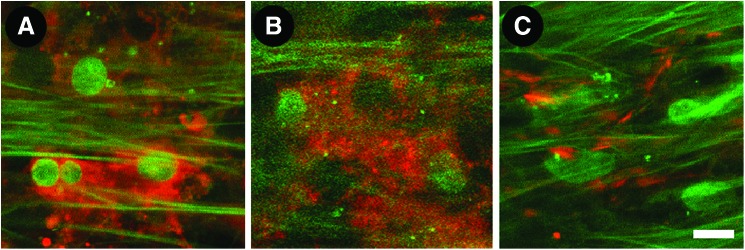
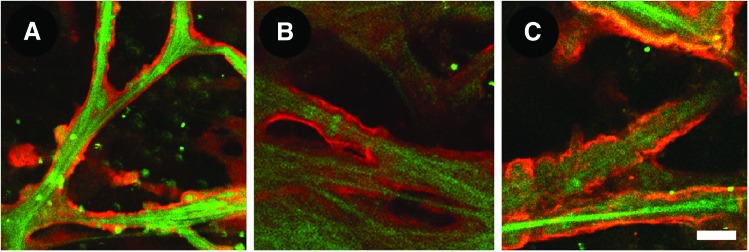
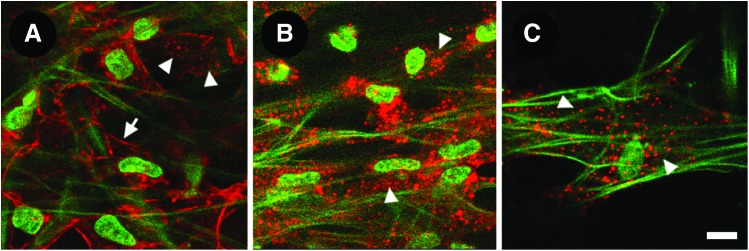
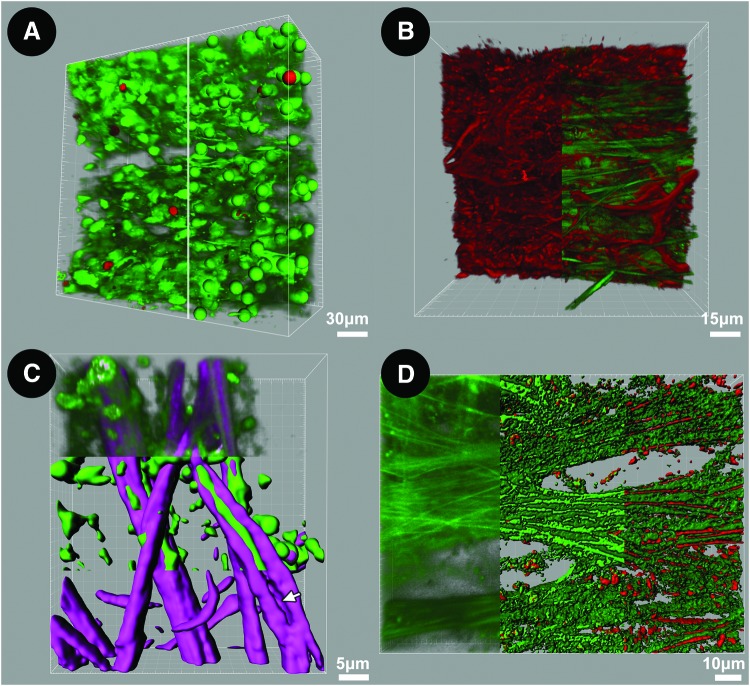
We have developed a tissue-based model of the human trabecular meshwork (TM) using viable postmortem corneoscleral donor tissue. Two-photon microscopy is used to optically section and image deep in the tissue to analyze cells and extracellular matrix (ECM) within the original three-dimensional (3D) environment of the TM. Multimodal techniques, including autofluorescence (AF), second harmonic generation (SHG), intravital dye fluorescence, and epifluorescence, are combined to provide unique views of the tissue at the cellular and subcellular level. SHG and AF imaging are non-invasive tissue imaging techniques with potential for clinical application, which can be modeled in the system. We describe the following in the tissue-based model: analysis of live cellularity to determine tissue viability; characteristics of live cells based on intravital labeling; features and composition of the TM's structural ECM; localization of specific ECM proteins to regions such as basement membrane; in situ induction and expression of tissue markers characteristic of cultured TM cells relevant to glaucoma; analysis of TM actin and pharmacological effects; in situ visualization of TM, inner wall endothelium, and Schlemm's canal; and application of 3D reconstruction, modeling, and quantitative analysis to the TM. The human model represents a cost-effective use of valuable and scarce yet available human tissue that allows unique cell biology, pharmacology, and translational studies of the TM.


Figures

<b>FIG. 1.</b>
FIG. 1.
Human donor corneoscleral rims. (A) Angle structures in tissue. (B) Location of TM and Schlemm's canal (SC) in a corneoscleral wedge. S, sclera; CB, ciliary body; SS, scleral spur; TM, trabecular meshwork; SL, Schwalbe's line; C, cornea. Scale bar=3 mm.
<b>FIG. 2.</b>
FIG. 2.
Autofluorescence clues of tissue viability. (A) Linear branching autofluorescent fibers without abnormal aggregates in viable tissue. (B) Indistinct, wavy and tangled autofluorescent fibers (arrows) with abnormal aggregates (asterisks) in non-viable tissue. Oval nuclei are labeled with Hoechst 33342. Scale bar=25 μm.
<b>FIG. 3.</b>
FIG. 3.
Live cellularity analysis by calcein AM (calcein; green) and propidium iodide (PI; red) co-labeling. (A) Freshly postmortem tissue: predominantly calcein-positive, PI-negative cellular labeling confirming viable tissue. (B) Viable postmortem tissue labeling similar to (A). (C) Dead tissue following exposure to Triton X-100 showing universally calcein-negative, PI-positive co-labeled cells among autofluorescent fibers. (D) Nonviable postmortem tissue showing similar co-labeling as (C). Scale bar=25 μm. Color images available online at www.liebertpub.com/jop
<b>FIG. 4.</b>
FIG. 4.
Live cell morphology by intravital imaging. (A) CellTracker (red) in the cytosol and perinuclear cellular regions. Asterisk: unlabeled nucleus. Arrows: tiny signal voids in cytosol likely represent unlabeled organelle compartments. (B) Calcein AM (green) in the cytosol of roundish cells. Arrows: tiny signal voids in cytosol are suggestive of organelle compartments. (C) Detail of calcein-labeled cell (green) showing lamellipodia-like configuration (arrowhead). (D) Octadecyl rhodamine B chloride (R18; red)-labeled cell membranes. Asterisk: Hoechst-labeled nucleus. Scale bar=10 μm. Color images available online at www.liebertpub.com/jop
<b>FIG. 5.</b>
FIG. 5.
Autofluorescence (AF) and Hoechst-labeled nuclei in trabecular meshwork and corneal endothelium. (A) Nuclear association with trabecular beams in uveal meshwork. Inset: software-assisted measurement to determine width of trabecular beams. (B) Nuclei among coarser beams and pores in corneoscleral meshwork. (C) Dense nuclear distribution among AF fibers in juxtacannalicular meshwork. A number of smaller nuclei with high-intensity fluorescence labeling are seen in the adjacent inner wall endothelium of Schlemm's canal (arrows). (D) Regular mosaic of corneal endothelial nuclei with minimal/no associated AF. Scale bar=25 μm.
<b>FIG. 6.</b>
FIG. 6.
Imaging of autofluorescence second harmonic generation (SHG) of collagen, and eosin-labeled fluorescence of elastin in human trabecular meshwork. (A) Low-intensity (asterisks) and high-intensity AF signals (bright fibers); (B) corresponding SHG-positive (asterisks; for collagen) and SHG-negative (linear void between SHG-positive signal indicated by asterisks) signals; and (C) SHG-signal voids (arrows). (D) Eosin-positive regions (arrows; for elastin) that co-localized with SHG signal voids of (C). (E) These fine fibers positively label with anti-tropoelastin antibody (red, arrow). Scale bar=10 μm. Color images available online at www.liebertpub.com/jop
<b>FIG. 7.</b>
FIG. 7.
Schlemm's canal (SC) and juxtacanalicular meshwork (JCT) interface. Orthogonal reconstruction (A) and tangential views (B–D) of interface region of JCT/inner wall endothelium next to SC lumen. (A) Orthogonal view through JCT/inner wall region, next to SC signal void (between dotted lines) region (b: JCT/inner wall interface; c: inner wall nuclei; d: SC lumen). (B) Fine autofluorescent fibers (arrows) are seen among Hoechst-labeled nuclei in the JCT region. Region of SC endothelium should have nuclei only without autofluorescent fibers (darker background). (C) SC signal void in a more external optical section just beyond JCT. (D) Autofluorescence signal from nylon marker (asterisk) in SC lumen showing course of SC without exogenous labeling. Arrowheads: Hoechst-labeled nuclei. Scale bar=25 μm.
<b>FIG. 8.</b>
FIG. 8.
Induction of both intra-and extracellular markers in the trabecular meshwork. (A) α-smooth muscle actin (red) is seen intracellularly after induction by transforming growth factor-β1. (B) Myocilin (red), also an intracellular marker, is observed after induction by dexamethasone; (C) Fibronectin (red), a surface marker, is in cell-cell borders. Scale bar=10 μm. Color images available online at www.liebertpub.com/jop
<b>FIG. 9.</b>
FIG. 9.
Extracellular matrix (ECM) proteins in basement membrane. ECM proteins that were not evident by autofluorescence and second harmonic generation imaging were visualized by two-photon excitation fluorescence after whole tissue immunolabeling. These ECM proteins, which included (A) Collagen type IV (red), (B) Laminin (red) and (C) Heparan sulfate (red) were observed in the basement membrane surrounding trabecular beams (green AF). Scale bar=10 μm. Color images available online at www.liebertpub.com/jop
<b>FIG. 10.</b>
FIG. 10.
Filamentous actin (F-actin) in the trabecular meshwork. (A) F-actin (red) was prominent in a cortical distribution near cell borders (arrow) and in a perinuclear punctate distribution (arrowheads). (B, C) After Latruculin-A exposure, cortical F-actin was reduced leaving only perinuclear punctate actin (arrowheads). Autofluorescence signals were unchanged. Scale bar=10 μm. Color images available online at www.liebertpub.com/jop
<b>FIG. 11.</b>
FIG. 11.
Three-dimensional (3D) reconstruction and analysis of human trabecular meshwork (TM). (A) 3D reconstruction and analysis of live/dead co-labeling by calcein AM (green) and propidium iodide (PI; red) in TM. Tangential view (246×246 μm) is shown, with uveal meshwork seen on the upper face. Left half of image: Labeled cells are predominantly alive [calcein-positive (green) and PI-negative labeling (red) is scant]. Right half of image: spot mapping of individual cells during which different spheres are assigned to live (green) and dead (red) cells to allow automated live/dead cell counting. (B) Multimodal imaging combining F-actin epifluorescence (red filaments; left half of image) and structural matrix autofluorescence (AF); green fibers; right half of image). Actin filaments form an interconnected network among autofluorescent trabecular beams. (C) Molecular dissection of structural matrix by multimodal imaging and “isosurface” modeling. Model shows collagen (second harmonic generation (SHG); purple) encasing elastic fibers (AF; green) in the uveal meshwork. Upper third: 3D reconstruction of original SHG and AF signals; middle third: isosurface mapping segregating AF and SHG; lower third: SHG isosurface map after subtraction of AF signal to show space occupied by elastin in beam (arrow). (D) Mapping of proteins corresponding to components of AF signal. Left third: 3D reconstruction of original AF signal; middle third: isosurface model segregating high- and lower-intensity AF signals; right third: co-localization of eosin fluorescence (elastin) with high-intensity AF but not lower-intensity AF. Color images available online at www.liebertpub.com/jop

Similar articles

Cited by

References

    1. Fuchshofer R., and Tamm E.R.Modulation of extracellular matrix turnover in the trabecular meshwork. Exp. Eye Res. 88:683–688, 2009 - PubMed
    1. Rhee D.J., Haddadin R.I., Kang M.H., and Oh D.J.Matricellular proteins in the trabecular meshwork. Exp. Eye Res. 88:694–703, 2009 - PubMed
    1. Keller K.E., Aga M., Bradley J.M., Kelley M.J., and Acott T.S.Extracellular matrix turnover and outflow resistance. Exp. Eye Res. 88:676–682, 2009 - PMC - PubMed
    1. Polansky J.R., Wood I.S., Maglio M.T., and Alvarado J.A.Trabecular meshwork cell culture in glaucoma research: evaluation of biological activity and structural properties of human trabecular cells in vitro. Ophthalmology. 91:580–595, 1984 - PubMed
    1. Cukierman E., Pankov R., Stevens D.R., and Yamada K.M.Taking cell-matrix adhesions to the third dimension. Science. 294:1708–1712, 2001 - PubMed

Publication types

LinkOut - more resources