

Identification of tetrapeptides from a mixture based positional scanning library that can restore nM full agonist function of the L106P, I69T, I102S, A219V, C271Y, and C271R human melanocortin-4 polymorphic receptors (hMC4Rs)
- PMID: 24517312
- PMCID: PMC4324447
- DOI: 10.1021/jm500064t
Identification of tetrapeptides from a mixture based positional scanning library that can restore nM full agonist function of the L106P, I69T, I102S, A219V, C271Y, and C271R human melanocortin-4 polymorphic receptors (hMC4Rs)
Abstract
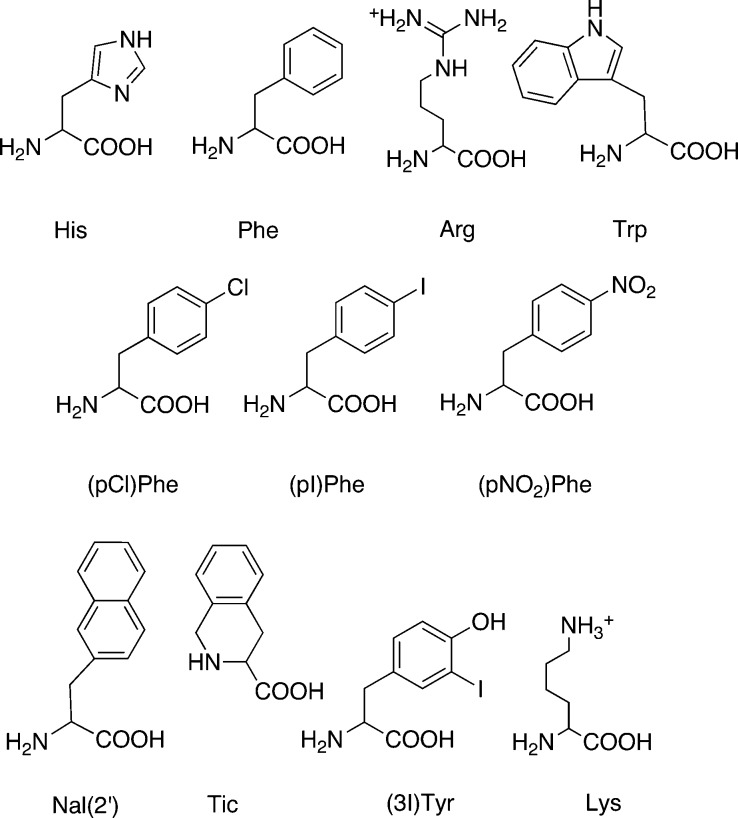
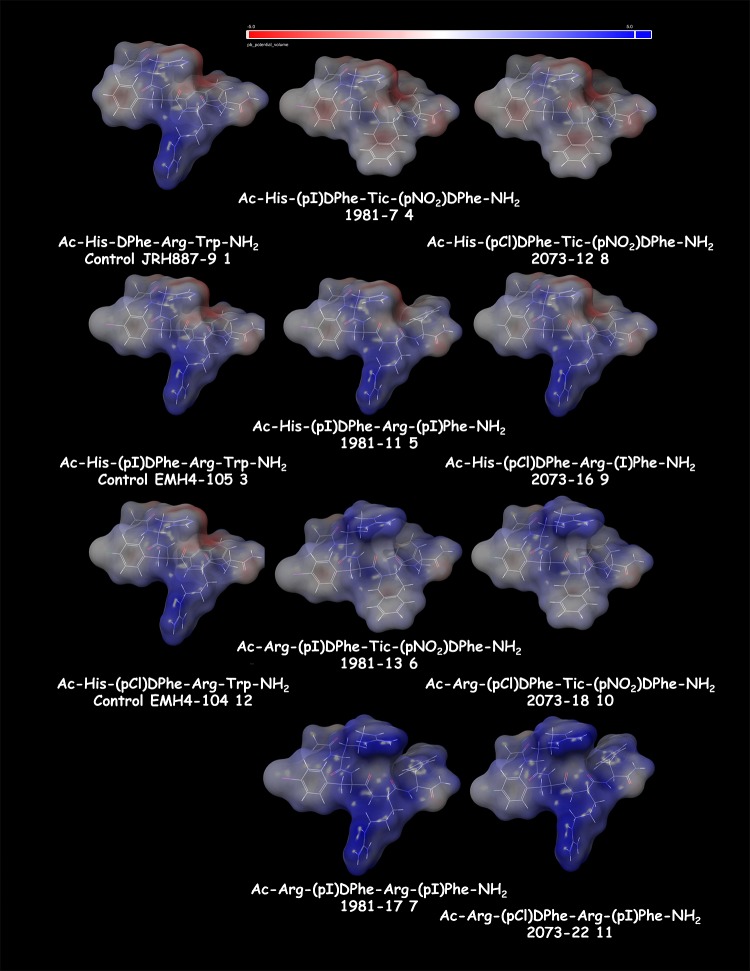
Human obesity has been linked to genetic factors and single nucleotide polymorphisms (SNPs). Melanocortin-4 receptor (MC4R) SNPs have been associated with up to 6% frequency in morbidly obese children and adults. A potential therapy for individuals possessing such genetic modifications is the identification of molecules that can restore proper receptor signaling and function. These compounds could serve as personalized medications improving quality of life issues as well as alleviating diseases symptoms associated with obesity including type 2 diabetes. Several hMC4 SNP receptors have been pharmacologically characterized in vitro to have a decreased, or a lack of response, to endogenous agonists such as α-, β-, and γ2-melanocyte stimulating hormones (MSH) and adrenocorticotropin hormone (ACTH). Herein we report the use of a mixture based positional scanning combinatorial tetrapeptide library to discover molecules with nM full agonist potency and efficacy to the L106P, I69T, I102S, A219V, C271Y, and C271R hMC4Rs. The most potent compounds at all these hMC4R SNPs include Ac-His-(pI)DPhe-Tic-(pNO2)DPhe-NH2, Ac-His-(pCl)DPhe-Tic-(pNO2)DPhe-NH2, Ac-His-(pCl)DPhe-Arg-(pI)Phe-NH2, and Ac-Arg-(pCl)DPhe-Tic-(pNO2)DPhe-NH2, revealing new ligand pharmacophore models for melanocortin receptor drug design strategies.
Figures

Similar articles
-
Discovery of Mixed Pharmacology Melanocortin-3 Agonists and Melanocortin-4 Receptor Tetrapeptide Antagonist Compounds (TACOs) Based on the Sequence Ac-Xaa1-Arg-(pI)DPhe-Xaa4-NH2.J Med Chem. 2017 May 25;60(10):4342-4357. doi: 10.1021/acs.jmedchem.7b00301. Epub 2017 May 15. J Med Chem. 2017. PMID: 28453292 Free PMC article.
-
Pharmacological characterization of 30 human melanocortin-4 receptor polymorphisms with the endogenous proopiomelanocortin-derived agonists, synthetic agonists, and the endogenous agouti-related protein antagonist.Biochemistry. 2010 Jun 8;49(22):4583-600. doi: 10.1021/bi100068u. Biochemistry. 2010. PMID: 20462274 Free PMC article.
-
Peptide and small molecules rescue the functional activity and agonist potency of dysfunctional human melanocortin-4 receptor polymorphisms.Biochemistry. 2007 Jul 17;46(28):8273-87. doi: 10.1021/bi7007382. Epub 2007 Jun 23. Biochemistry. 2007. PMID: 17590021
-
Melanocortin-4 receptor (MC4R) agonists for the treatment of obesity.J Med Chem. 2006 Jul 13;49(14):4035-43. doi: 10.1021/jm058241a. J Med Chem. 2006. PMID: 16821763 Review. No abstract available.
-
Structure-activity relationships of beta-MSH derived melanocortin-4 receptor peptide agonists.Curr Top Med Chem. 2007;7(11):1052-67. doi: 10.2174/156802607780906591. Curr Top Med Chem. 2007. PMID: 17584126 Review.
Cited by
-
An in Vitro and in Vivo Investigation of Bivalent Ligands That Display Preferential Binding and Functional Activity for Different Melanocortin Receptor Homodimers.J Med Chem. 2016 Apr 14;59(7):3112-28. doi: 10.1021/acs.jmedchem.5b01894. Epub 2016 Mar 29. J Med Chem. 2016. PMID: 26959173 Free PMC article.
-
Discovery of Nanomolar Melanocortin-3 Receptor (MC3R)-Selective Small Molecule Pyrrolidine Bis-Cyclic Guanidine Agonist Compounds Via a High-Throughput "Unbiased" Screening Campaign.J Med Chem. 2021 May 13;64(9):5577-5592. doi: 10.1021/acs.jmedchem.0c02041. Epub 2021 Apr 22. J Med Chem. 2021. PMID: 33886285 Free PMC article.
-
Discovery of Mixed Pharmacology Melanocortin-3 Agonists and Melanocortin-4 Receptor Tetrapeptide Antagonist Compounds (TACOs) Based on the Sequence Ac-Xaa1-Arg-(pI)DPhe-Xaa4-NH2.J Med Chem. 2017 May 25;60(10):4342-4357. doi: 10.1021/acs.jmedchem.7b00301. Epub 2017 May 15. J Med Chem. 2017. PMID: 28453292 Free PMC article.
-
Melanocortin-4 receptor complexity in energy homeostasis,obesity and drug development strategies.Diabetes Obes Metab. 2022 Apr;24(4):583-598. doi: 10.1111/dom.14618. Epub 2022 Jan 11. Diabetes Obes Metab. 2022. PMID: 34882941 Free PMC article. Review.
-
Discovery of Polypharmacological Melanocortin-3 and -4 Receptor Probes and Identification of a 100-Fold Selective nM MC3R Agonist versus a μM MC4R Partial Agonist.J Med Chem. 2019 Mar 14;62(5):2738-2749. doi: 10.1021/acs.jmedchem.9b00053. Epub 2019 Feb 28. J Med Chem. 2019. PMID: 30741545 Free PMC article.
References
-
- Chhajlani V.; Wikberg J. E. S. Molecular Cloning and Expression of the Human Melanocyte Stimulating Hormone Receptor cDNA. FEBS Lett. 1992, 3093417–420. - PubMed
-
- Mountjoy K. G.; Robbins L. S.; Mortrud M. T.; Cone R. D. The Cloning of a Family of Genes that Encode the Melanocortin Receptors. Science 1992, 257, 1248–1251. - PubMed
-
- Roselli-Rehfuss L.; Mountjoy K. G.; Robbins L. S.; Mortrud M. T.; Low M. J.; Tatro J. B.; Entwistle M. L.; Simerly R. B.; Cone R. D. Identification of a Receptor for g Melanotropin and Other Proopiomelanocortin Peptides in the Hypothalamus and Limbic System. Proc. Natl. Acad. Sci. U. S. A. 1993, 90, 8856–8860. - PMC - PubMed
-
- Mountjoy K. G.; Mortrud M. T.; Low M. J.; Simerly R. B.; Cone R. D. Localization of the Melanocortin-4 Receptor (MC4-R) in Neuroendocrine and Autonomic Control Circuits in the Brain. Mol. Endocrinol. 1994, 8, 1298–1308. - PubMed
-
- Gantz I.; Konda Y.; Tashiro T.; Shimoto Y.; Miwa H.; Munzert G.; Watson S. J.; DelValle J.; Yamada T. Molecular Cloning of a Novel Melanocortin Receptor. J. Biol. Chem. 1993, 268118246–8250. - PubMed
Publication types
MeSH terms
Substances
Grants and funding
LinkOut - more resources
Full Text Sources
Other Literature Sources
Chemical Information
Research Materials
Miscellaneous
