. 2014 Mar 11;53(9):1420-7.
doi: 10.1021/bi4016742. Epub 2014 Feb 26.

Cross-link formation and peptidoglycan lattice assembly in the FemA mutant of Staphylococcus aureus

Affiliations

Cross-link formation and peptidoglycan lattice assembly in the FemA mutant of Staphylococcus aureus

Sung Joon Kim et al. Biochemistry. .

Abstract

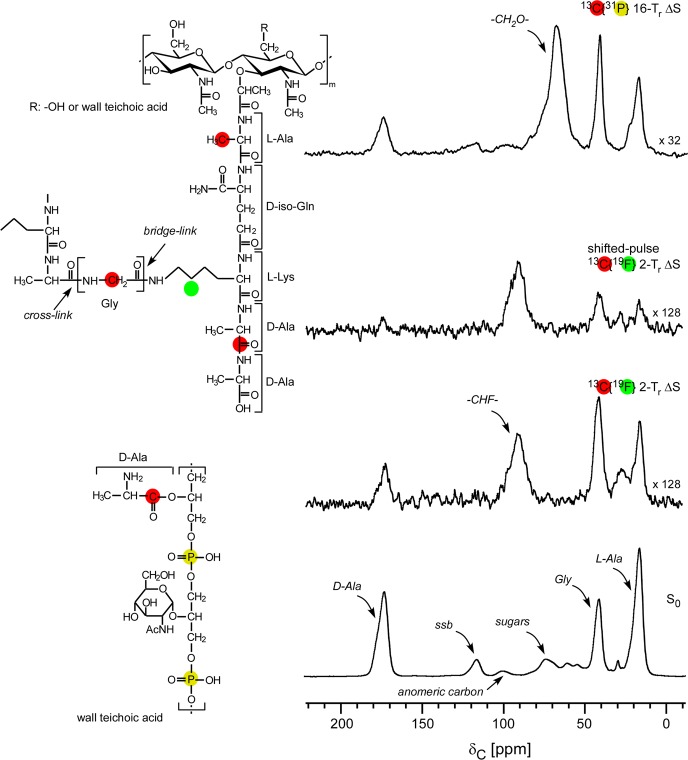
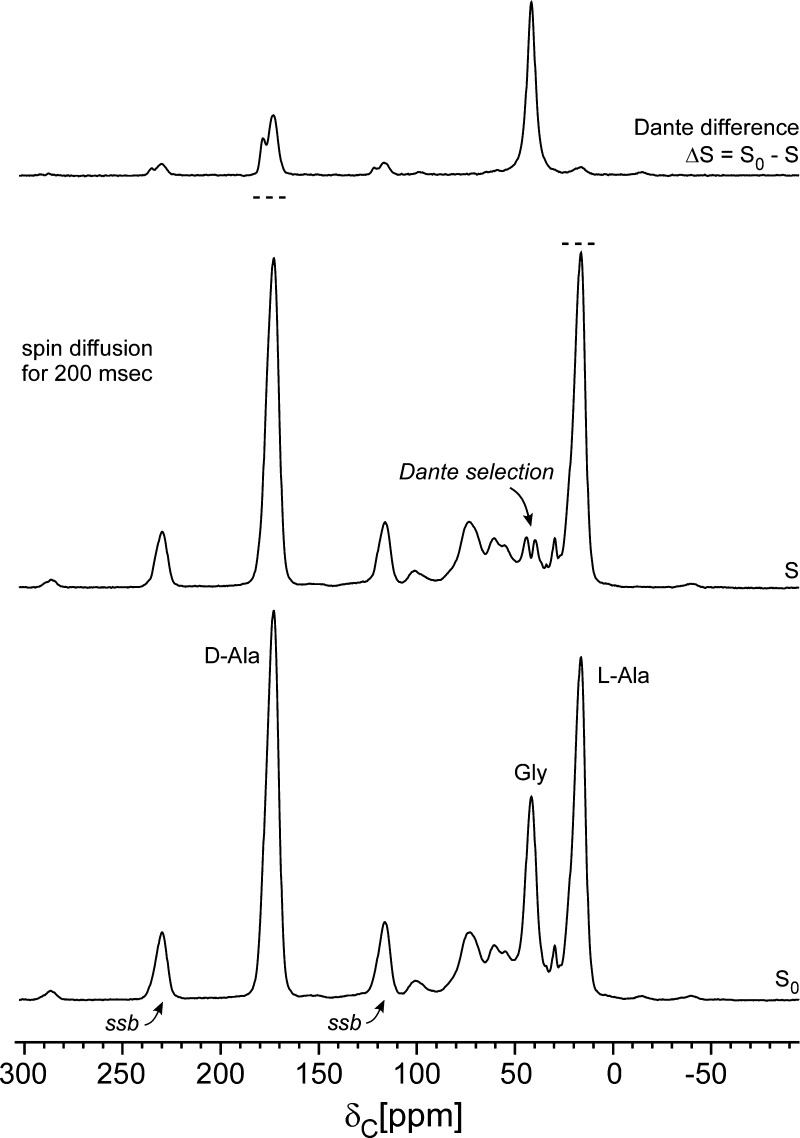
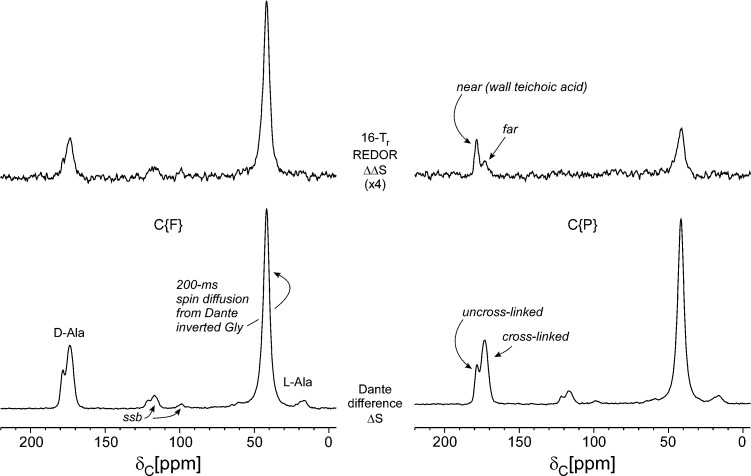
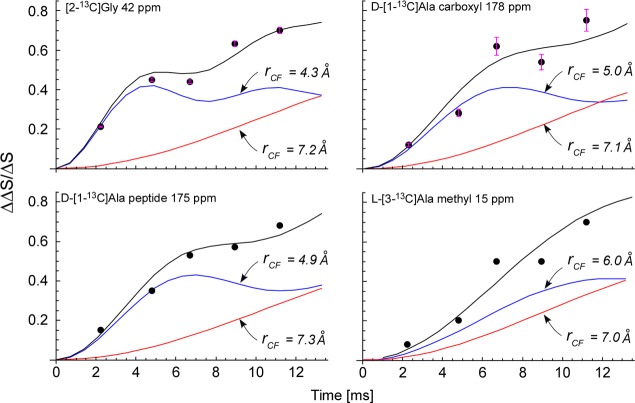
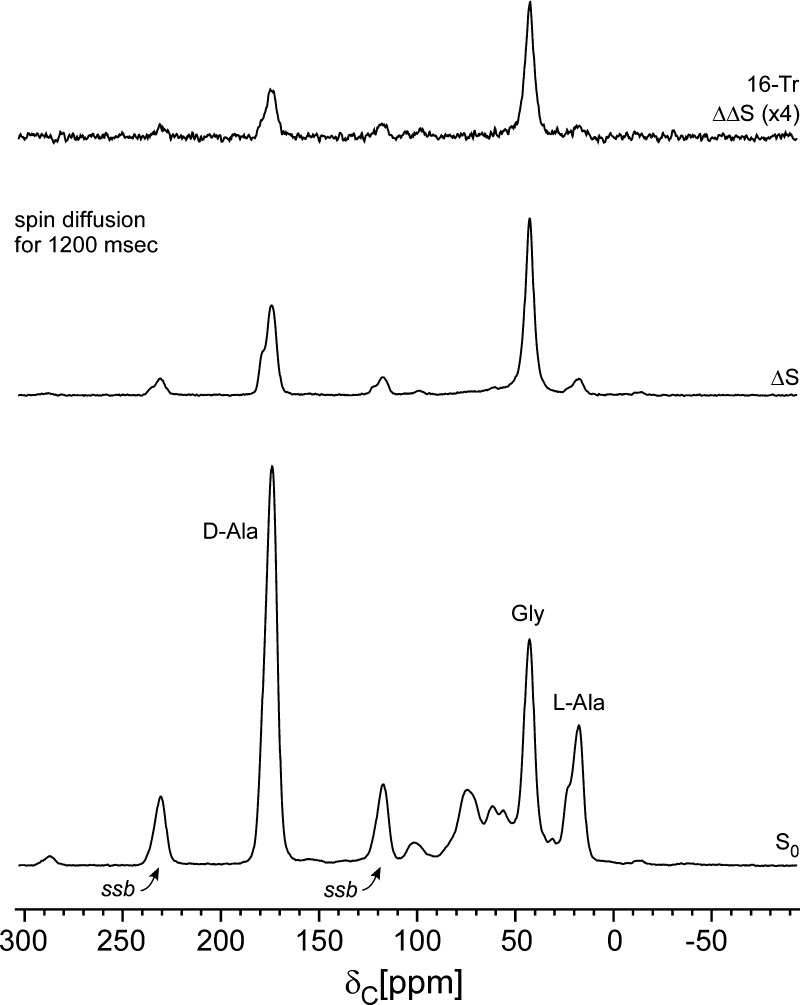
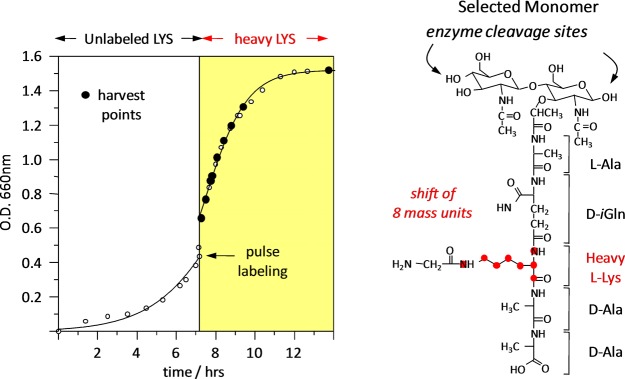
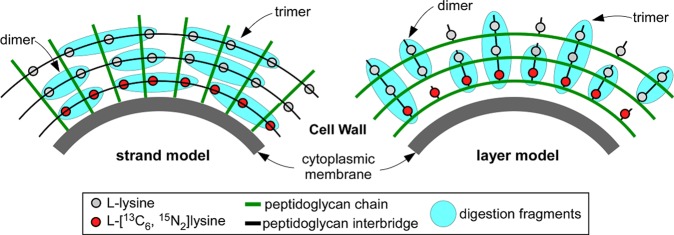
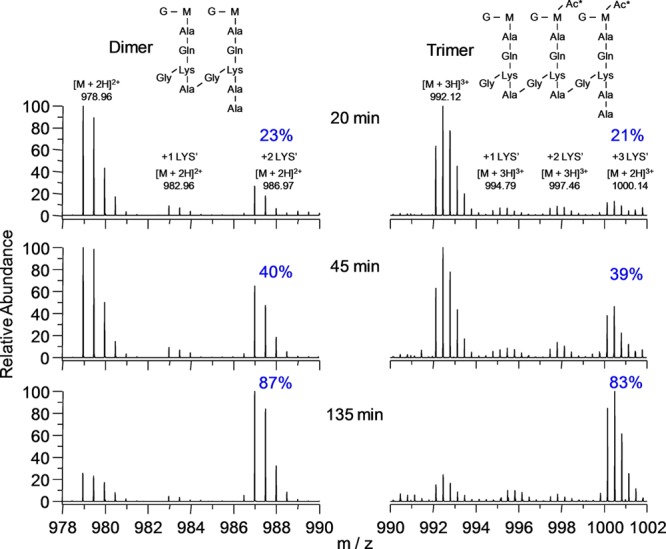
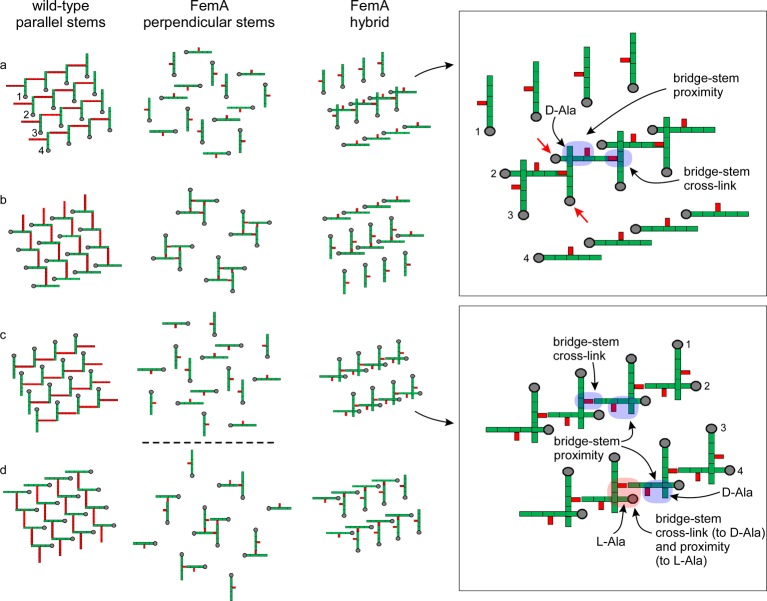
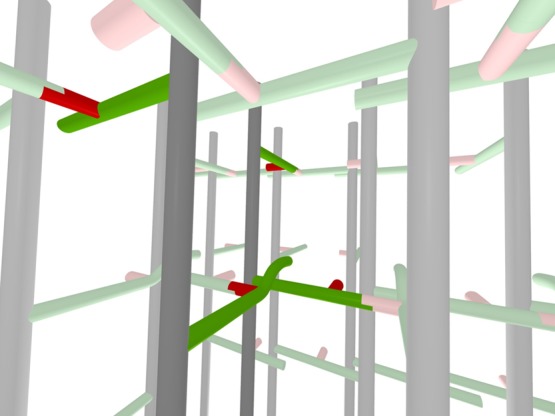
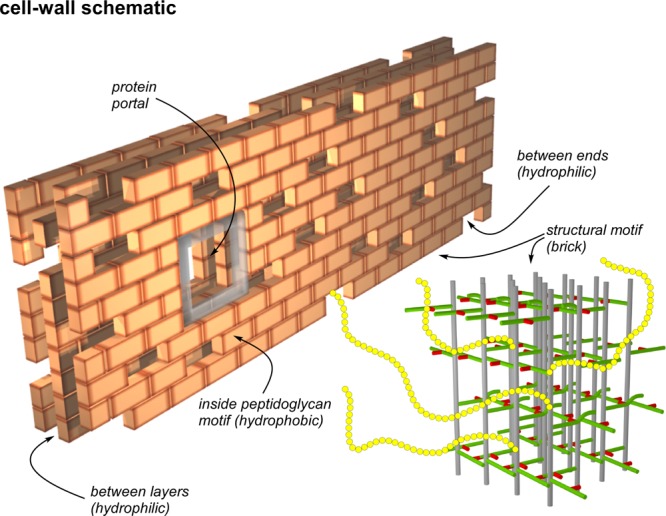
Staphylococcus aureus FemA mutant grown in the presence of an alanine-racemase inhibitor was labeled with d-[1-(13)C]alanine, l-[3-(13)C]alanine, [2-(13)C]glycine, and l-[5-(19)F]lysine to characterize some details of the peptidoglycan tertiary structure. Rotational-echo double-resonance (REDOR) NMR of isolated cell walls was used to measure internuclear distances between (13)C-labeled alanines and (19)F-labeled lysine incorporated in the peptidoglycan. The alanyl (13)C labels were preselected for REDOR measurement by their proximity to the glycine label using (13)C-(13)C spin diffusion. The observed (13)C-(13)C and (13)C-(19)F distances are consistent with a tightly packed, hybrid architecture containing both parallel and perpendicular stems in a repeating structural motif within the peptidoglycan.


Figures

Figure 1
Figure 1
C{F} and C{P} REDOR spectra of intact cell walls of the FemA mutant of S. aureus grown on media containing d-[1-13C]alanine, l-[3-13C]alanine, [2-13C]glycine, and l-[5-19F]lysine with the alanine racemase inhibitor, alaphosphin. The full-echo spectrum is at the bottom of the figure, and various REDOR differences are above. The shifted-pulse evolution time (second from top) was much less than two rotor periods. In this experiment, the separation of the two 19F π pulses was changed from the normal 140 μs (one rotor period) to 220 μs so that the effective recoupling time was only 30 μs per rotor period over the two rotor periods of REDOR dephasing. The inset shows the location of the labels (red, 13C; green, 19F) of peptidoglycan and (red, 13C; yellow, 31P) wall teichoic acid. All other carbons are at natural abundance. Spinning sidebands are designated by “ssb”.
Figure 2
Figure 2
Dante frequency selection for the cell-wall sample of Figure 1. A train of 1-μs 13C radio frequency pulses separated by 5 μs, with the carrier frequency centered at the glycyl-carbon resonance, and followed by z-axis storage for 200 ms, partially inverted the peak at 42 ppm (middle). The Dante difference spectrum (top) shows 13C–13C spin diffusion from the glycyl label to the d-alanyl label (175 and 178 ppm) and the l-alanyl label (15 ppm). The dotted lines above the peaks of the middle spectrum show their heights in the bottom spectrum. Spinning sidebands are designated by “ssb”.
Figure 3
Figure 3
Dante-selected C{F} (left) and C{P} (right) REDOR of the cell-wall sample of Figure 1. The Dante differencing of Figure 2 preceded REDOR dephasing. Four data blocks were collected resulting in spectra with and without Dante irradiation, each with and without 19F (or 31P) dephasing. The Dante differences (ΔS) are shown at the bottom of the figure and are the reference spectra for REDOR dephasing (ΔΔS) shown above. The terminal carboxyl of the d-alanyl label (178 ppm) has a much larger C{P} REDOR difference than does the peptide d-alanyl label (175 ppm), indicating preferred proximity of un-cross-linked d-alanyl units to wall teichoic acid.
Figure 4
Figure 4
Dante-selected C{F} REDOR dephasing (ΔΔSS) as a function of dipolar evolution time for the four resolved peaks of Figure 2 (top). The Dante selection was the glycyl 13C label at 42 ppm (Figure 2). The experimental dephasing (solid circles) is matched by the calculated dephasing (black line) which is a sum of two single-distance components (blue and red lines).
Figure 5
Figure 5
Dante-selected C{F} REDOR of the cell-wall sample of Figure 1. The Dante differencing of Figure 2 preceded REDOR dephasing but with a mixing time of 1200 ms. Even though the l-alanyl methyl-label peak at 15 ppm has a reduced S0 intensity relative to that in Figure 2 (bottom) because of a short T1(C), the ΔS/S0 for that peak has increased to approximately 15%.
Figure 6
Figure 6
(Left) Time course of the pulse labeling of FemA whole cells with uniformly 13C,15N-lysine. After the switch to labeled lysine in the media, the cells doubled in about 2 h. (Right) Peptidoglycan digest fragment containing a single labeled lysine.
Figure 7
Figure 7
Muramidase digestion fragments (blue) of pulse labeling of FemA whole cells with l-[13C6,15N2]-lysine (red circles) for the strand model (left), and layer model (right) of peptidoglycan biosynthesis. The fragments with a mixture of heavy and light lysines are only observed in the layer model.
Figure 8
Figure 8
Accurate-mass spectra of dimers and trimers from digestion of the peptidoglycan of FemA cells grown in the pulse-labeling experiment of Figure 6. The dimers contain 0, 1, or 2 labeled lysines (increasing m/z, left to right), and the trimers, 0, 1, 2, or 3 labeled lysines (left to right), respectively. Each labeled lysine results in a m/z mass shift of 8/2 = 4 units for dimers, and 8/3 = 2.67 units for trimers.
Figure 9
Figure 9
Lattice models for the peptidoglycan of long-bridged wild-type S. aureus (left) and its short-bridged FemA mutant (middle and right). A 4 × 4 array of glycan chains perpendicular to the plane of the paper is in gray, with the peptide stems in green and the pentaglycyl bridges in red. Panels a through d for each model are slices transverse to the glycan chain direction and separated from one another by a single glycan repeat unit. The model on the left has all nearest-neighbor stems parallel; that in the middle, perpendicular; and that on the right, a mixed geometry. The expanded insets on the far right identify structural components (arrows and color highlights) for the mixed geometry of the FemA hybrid model. The two red arrows (inset, upper right) identify strands that are color highlighted in Figure 10. Alternate rows of the mixed-geometry model have stems that are perpendicular to one another. Thus, the stems of rows 1 and 3 are parallel, and those of rows 2 and 4 are parallel. Counts for the central four strands of the unit cells indicate that ideal cross-linking is 100% for the wild-type lattice (each stem is a cross-link donor and acceptor) and 50% for each of the two FemA models.
Figure 10
Figure 10
Three-dimensional representation of the hybrid model for the peptidoglycan lattice of FemA. Two of the glycan chains, peptide stems and glycyl side chains of the central units of the expanded inset (top) of Figure 9 (see red arrows) are highlighted by darker colors. The view is looking from row 3 to row 2 (see Figure 9 for numbering scheme). A cross-linked red glycyl unit is in the foreground (just left of and below the center) as well as an un-cross-linked red glycyl unit (to the right). The steric conflict of the two highlighted green stems in the foreground is represented by an upward curvature of one of the stems.
Figure 11
Figure 11
Schematic representation of the cell wall of the FemA mutant of S. aureus as a multilayered brick wall. Each brick is the peptidoglycan structural motif (bottom right) shown in expanded view in Figure 10. The interior of the structural motif is hydrophobic and the potential binding site of glycopeptide drugs with hydrophobic tails. Spaces and gaps are hydrophilic and accommodate wall teichoic acid (yellow chains). This arrangement brings the 31P of phosphate groups close to the surfaces of bricks, which are necessarily rich in un-cross-linked d-alanyl carboxyl groups, consistent with the results of Figure 3 (right). Bricks are placed around membrane-bound proteins creating portals to the cell surface. The membrane bilayer is envisioned parallel to the back surface of the wall which is built one layer at a time with the glycan chains of the structural motif parallel to the bilayer surface, consistent with the results of Figures 6–8.

References

    1. Rogers H. J., Ward J. B., and Perkins H. R. (1980) Microbial Cell Walls and Membranes, Chapman and Hall, New York.
    1. Sharif S.; Kim S. J.; Labischinski H.; Schaefer J. (2009) Characterization of peptidoglycan in fem-deletion mutants of methicillin-resistant Staphylococcus aureus by solid-state NMR. Biochemistry 48, 3100–3108. - PMC - PubMed
    1. Kim S. J.; Singh M.; Preobrazhenskaya M.; Schaefer J. (2013) Staphylococcus aureus peptidoglycan stem packing by rotational-echo double resonance NMR spectroscopy. Biochemistry 52, 3651–3659. - PMC - PubMed
    1. Kim S. J.; Matsuoka S.; Patti G. J.; Schaefer J. (2008) Vancomycin derivative with damaged d-Ala-d-Ala binding cleft binds to cross-linked peptidoglycan in the cell wall of Staphylococcus aureus. Biochemistry 47, 3822–3831. - PMC - PubMed
    1. Gullion T.; Schaefer J. (1989) Rotational-echo double-resonance NMR. J. Magn. Reson. 81, 196–200. - PubMed

Publication types

MeSH terms

LinkOut - more resources