. 2014 Aug;28(8):1725-1735.
doi: 10.1038/leu.2014.70. Epub 2014 Feb 12.

Promiscuous MYC locus rearrangements hijack enhancers but mostly super-enhancers to dysregulate MYC expression in multiple myeloma

Affiliations

Promiscuous MYC locus rearrangements hijack enhancers but mostly super-enhancers to dysregulate MYC expression in multiple myeloma

Maurizio Affer et al. Leukemia. 2014 Aug.

Abstract

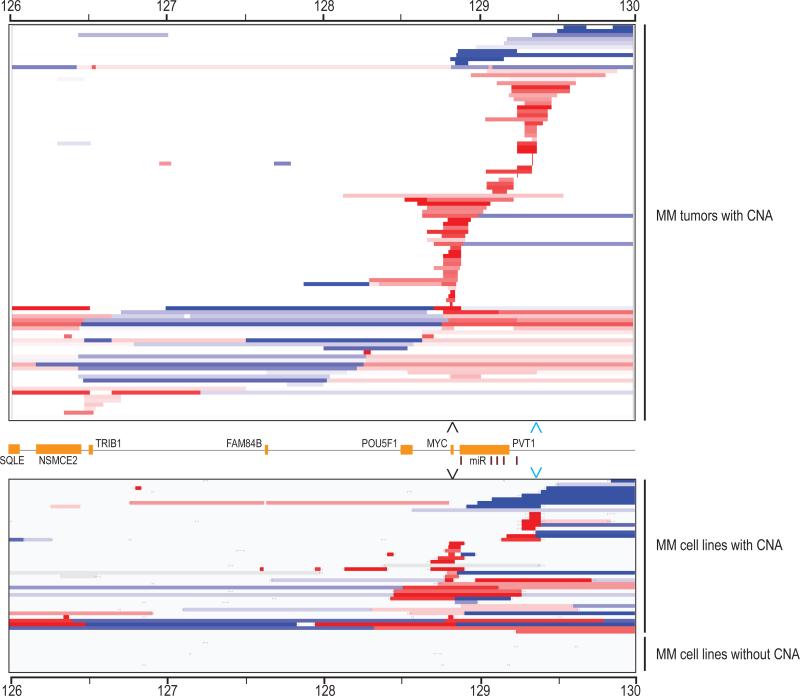
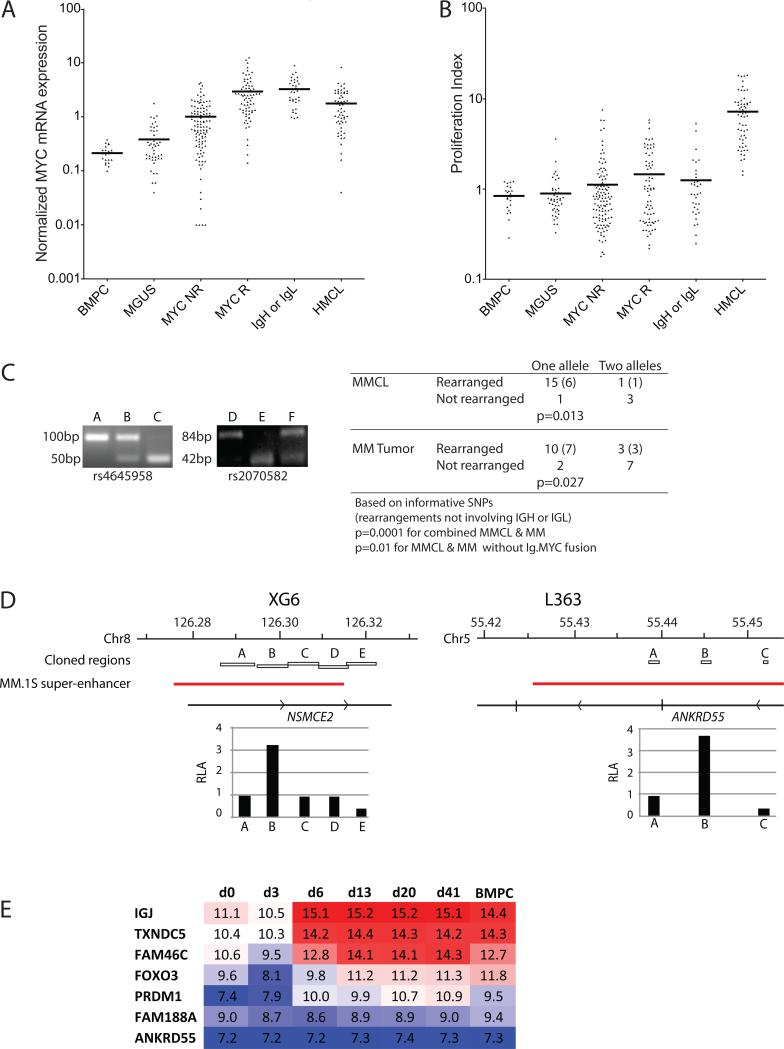
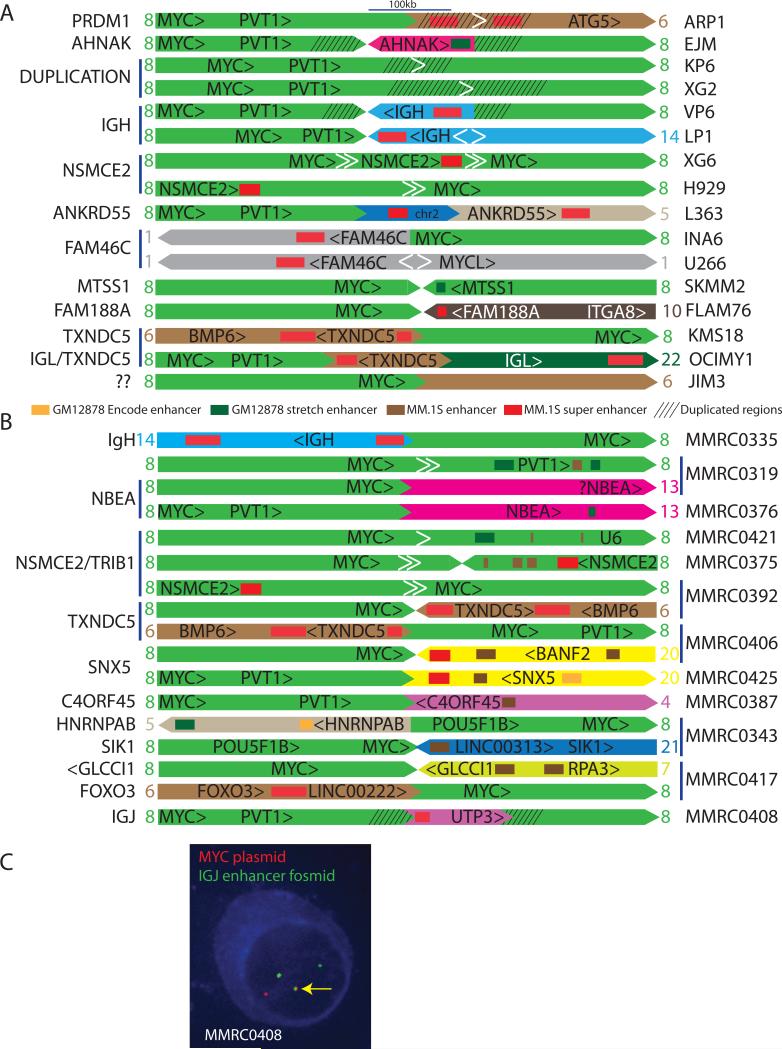
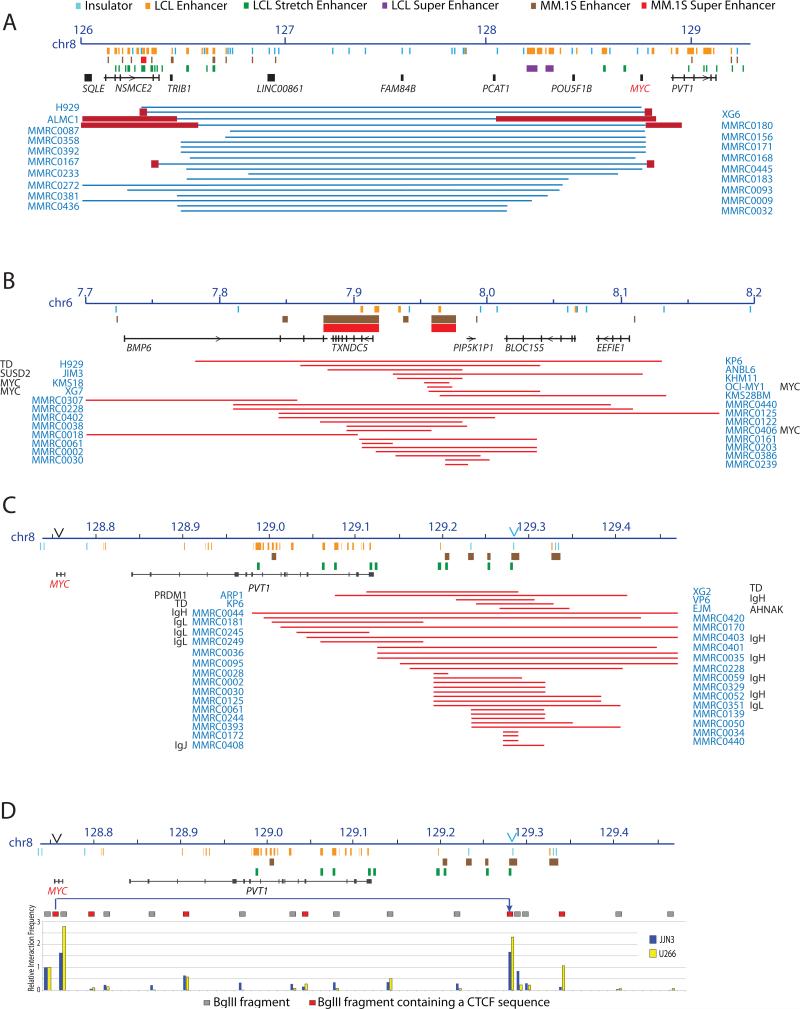
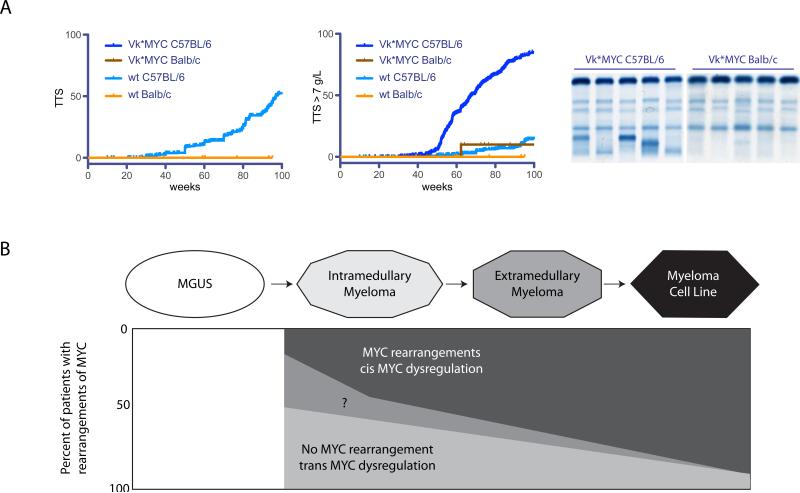
MYC locus rearrangements-often complex combinations of translocations, insertions, deletions and inversions-in multiple myeloma (MM) were thought to be a late progression event, which often did not involve immunoglobulin genes. Yet, germinal center activation of MYC expression has been reported to cause progression to MM in an MGUS (monoclonal gammopathy of undetermined significance)-prone mouse strain. Although previously detected in 16% of MM, we find MYC rearrangements in nearly 50% of MM, including smoldering MM, and they are heterogeneous in some cases. Rearrangements reposition MYC near a limited number of genes associated with conventional enhancers, but mostly with super-enhancers (e.g., IGH, IGL, IGK, NSMCE2, TXNDC5, FAM46C, FOXO3, IGJ, PRDM1). MYC rearrangements are associated with a significant increase of MYC expression that is monoallelic, but MM tumors lacking a rearrangement have biallelic MYC expression at significantly higher levels than in MGUS. We also have shown that germinal center activation of MYC does not cause MM in a mouse strain that rarely develops spontaneous MGUS. It appears that increased MYC expression at the MGUS/MM transition usually is biallelic, but sometimes can be monoallelic if there is an MYC rearrangement. Our data suggest that MYC rearrangements, regardless of when they occur during MM pathogenesis, provide one event that contributes to tumor autonomy.


Figures

Figure 1
Figure 1. Copy number abnormalities in the MYC locus in MM tumors and cell lines
Segmented Agilent 244k aCGH of the MYC locus (chr8: 126000000-130000000) in 101 of 238 MM tumors and 42 of 53 MMCL with CNA viewed in IGV is shown. The overall copy number for the region for each sample has been normalized to two copies in order to highlight local changes in copy number. More then a one log gain is deep red, more then one log loss is deep blue, and copy number within 0.2 log of diploid is white. The samples are ordered starting with telomeric deletions, segmental telomeric gains (blue arrowhead), segmental MYC gains (black arrowhead) and centromeric deletions and/or gains.
Figure 2
Figure 2. Rearrangements cis-dysregulate MYC expression
A. Affymetrix Hu133Plus2 arrays were used to estimate the normalized expression of MYC mRNA in CD138-selected plasma cells from normal bone marrow (BMPC), MGUS, MM without MYC rearrangements (MYC NR), MM with MYC rearrangements (MM R), MM with MYC rearrangements involving IgH or IgL (IgH or IgL) and MM cell lines (MMCL). B. The arrays were also used to calculate the proliferation index in the same cell populations. C. MM RNA from tumors heterozygous for SNPs rs4645958 or rs2070582 was analyzed by RT-PCR for allele specific expression. For both SNPs the polymorphism alters an Ici1 restriction site allowing the two alleles to be distinguished after restriction digest of the PCR product. Shown is the 4% agarose gel electrophoresis of the PCR digest for three patients with each polymorphism, providing examples of MM tumors that express each allele alone, and both together. Also provided is a table summarizing the allele specific expression of MYC in MM tumors and cell lines. D. Regions adjacent to MYC breakpoints in XG6 and L363 are shown, with the location of fragments cloned for enhancer assays indicated. The fragments were located in predicted MM.1S super-enhancers. The relative ability of the various fragments to enhance the transcription of a MYC promoter driven luciferase construct is shown as relative luciferase activity (RLA) normalized to the activity of the MYC promoter without enhancer. E. Expression of genes adjacent to putative super-enhancers involved in MYC locus rearrangements during in vitro B cell differentiation to long lived plasma cells. The log2-normalized data from Cocco et al is shown for the progressive stages of in vitro plasma cell differentiation23. In addition to IgH, IgK, and IgL (not shown), also IGJ, TXNDC5, FAM46C, FOXO3, PRDM1 (but not FAM188A or ANKRD55) are markedly up regulated with plasma cell differentiation.
Figure 3
Figure 3. MYC locus rearrangements in 16 MMCL and 12 MMRC tumors
A. The anatomy of MYC locus rearrangements on chr8 (light green) shows MM.1S enhancers and super enhancers, and duplicated regions, with the genes associated with the enhancer regions indicated at the left. Enhancer elements in the MYC locus are not shown here but are shown in Figure 4. The orientations of the chromosomes and transcription units are indicated. The white arrowheads indicate intrachromosomal breakpoints, with the pair of white arrows in XG6 and H929 indicating a deletion, the pair of arrows in U266 and LP1 indicating an inversion, and the single white arrow in ARP1, KP6, and XG2 indicating tandem duplication. A more detailed diagram of the XG6 and LP1 rearrangements is shown in Figure S1. Additional information regarding these rearrangements is included in Results and Table S10. B. The anatomy of MYC locus rearrangements for 12 MMRC tumors is presented as described in Figure 3. Several of the MM tumors have two different rearrangements. Additional information regarding these rearrangements is summarized in Results, Table 2, and Table S11. C. cIg-FISH was performed in MMRC0408 demonstrating co-localization of probes for MYC (red) and the IgJ enhancer (green) in the nuclei of plasma cells with light chain restriction (blue cytoplasmic staining).
Figure 4
Figure 4. Three chromosomal regions involved in recurrent MYC rearrangements
Symbols at the top apply to Panels A-D; the boxed symbols at the bottom to Panel D. A. Large deletions (blue lines) identified by Agilent 244K CGH results in 53 MMCL and 218 MMRC tumors indicates a repositioning of MYC near enhancers associated with NSMCE2 and TRIB1, which are located about 2.5 Mb centromeric to MYC. The dark red boxes indicate regions of copy number gains that flank the deleted regions. Breakpoints have been identified by sequencing or mate pairs in two MMCL (H929, XG6) and in one of the tumors (MMRC0392) shown in this figure, but also in two other tumors (MMRC0375, 0421) with complex CGH patterns not shown in this Figure. B. Super enhancers associated with TXNDC5 on chr6. The red lines indicate regions of copy number gains determined from 244K CGH data on MMCL and 218 MMRC tumors. The copy number gain is juxtaposed near MYC in three MMCL (KMS18, OCIMY1, XG7) and one tumor (MMRC406) and near SUSD2 in the JIM3 MMCL. The copy number gains shown are significantly enriched in MMRC tumors that have MYC rearrangements not involving IGH or IGL loci (see DISCUSSION). C. Segmental copy number gains localized >200 kb telomeric to MYC. MMCL and MMRC tumors with segmental copy number gains (red lines) identified from Agilent 244K CGH data are shown. Many of these gains flank insertions of enhancer elements (see Results and Discussion), or occur in tumors or MMCL that have MYC.IGH or MYC.IGL fusion signals. Most of these gains are centered in two regions that are about 350 kb and 500 kb downstream of MYC. The former occurs within the distal end of the PVT1 locus, near one MM.1S enhancer and multiple LCL enhancers. The latter is centered in a region that preferentially associates with the MYC promoter, but also contains a cluster of MM.1S enhancer sequences and GM12878 stretch enhancers. D. Interaction of MYC promoter with distal telomeric sequences. 3C experiments show a preferential interaction of a MYC promoter fragment that contains a CTCF site with a fragment, which is located ~500 kb telomeric of MYC, that also contains a CTCF sequence. The JJN3 MMCL has a MYC:IGH rearrangement, but the U266 MMCL has a MYCL rearrangement and expresses virtually no MYC.
Figure 5
Figure 5. Dysregulation of MYC causes the progression of MGUS to MM
A. Wild type C57Bl/6, but not Balb/c, mice develop faint (<4g/L), non-progressive M-spikes detectable by serum protein electrophoresis, with a median Time To Spike (TTS) detection of 97 weeks (left panel). With the introduction of the Vk*MYC transgene, C57Bl/6 mice develop progressively increasing M-spikes with a median Time To Spike >7g/L of 67 weeks. In contrast wild type C57Bl/6 or Vk*MYC Balb/c mice rarely develop an M-spike >7g/L, and it is never progressive (middle panel). Representative serum protein electrophoresis is shown for Vk*MYC C56BL/6 and Vk*MYC Balb/c mice (right panel). B. Proposed model summarizing the role of MYC in the progression of MM. The height of the boxed region indicates the fraction of tumors with MYC rearrangements at different stages. MGUS: white, low MYC expression. MM: light gray, increased MYC expression without a MYC rearrangement; dark gray, substantially increased MYC expression with a MYC rearrangement; intermediate gray, unknown. Increased MYC expression is due to unknown trans- mechanisms that result in bi-allelic expression in at least 50% of early MM tumors. Mono-allelic expression as a result of a MYC locus rearrangement might occur with this transition in some (? ~15%) MM tumors. Most MYC rearrangements probably occur during progression of MM, with >50% in advanced MM and 90% in MMCL.

References

    1. Dalla-Favera R, Martinotti S, Gallo RC, Erikson J, Croce CM. Translocation and rearrangements of the c-myc oncogene locus in human undifferentiated B-cell lymphomas. Science. 1983 Feb 25;219(4587):963–967. - PubMed
    1. Potter M. Neoplastic development in plasma cells. Immunol Rev. 2003 Aug;194:177–195. - PubMed
    1. Kuppers R. Mechanisms of B-cell lymphoma pathogenesis. Nat Rev Cancer. 2005 Apr;5(4):251–262. - PubMed
    1. Klein U, Tu Y, Stolovitzky GA, Keller JL, Haddad J, Jr., Miljkovic V, et al. Transcriptional analysis of the B cell germinal center reaction. Proc Natl Acad Sci U S A. 2003 Mar 4;100(5):2639–2644. - PMC - PubMed
    1. Zhan F, Tian E, Bumm K, Smith R, Barlogie B, Shaughnessy J., Jr. Gene expression profiling of human plasma cell differentiation and classification of multiple myeloma 23 based on similarities to distinct stages of late-stage B-cell development. Blood. 2003 Feb 1;101(3):1128–1140. - PubMed

Publication types