. 2015 Jul;25(7):1970-80.
doi: 10.1093/cercor/bhu006. Epub 2014 Feb 10.

Diffusion MR Microscopy of Cortical Development in the Mouse Embryo

Affiliations

Diffusion MR Microscopy of Cortical Development in the Mouse Embryo

Manisha Aggarwal et al. Cereb Cortex. 2015 Jul.

Abstract

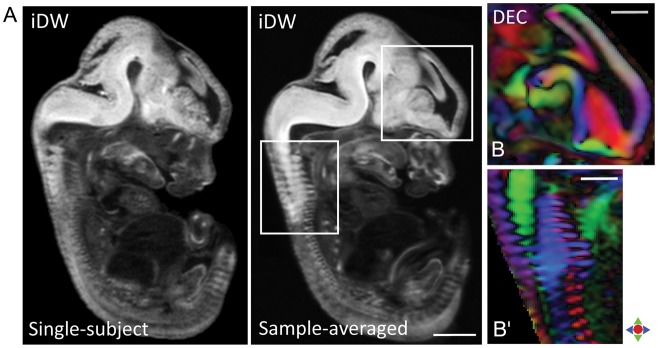
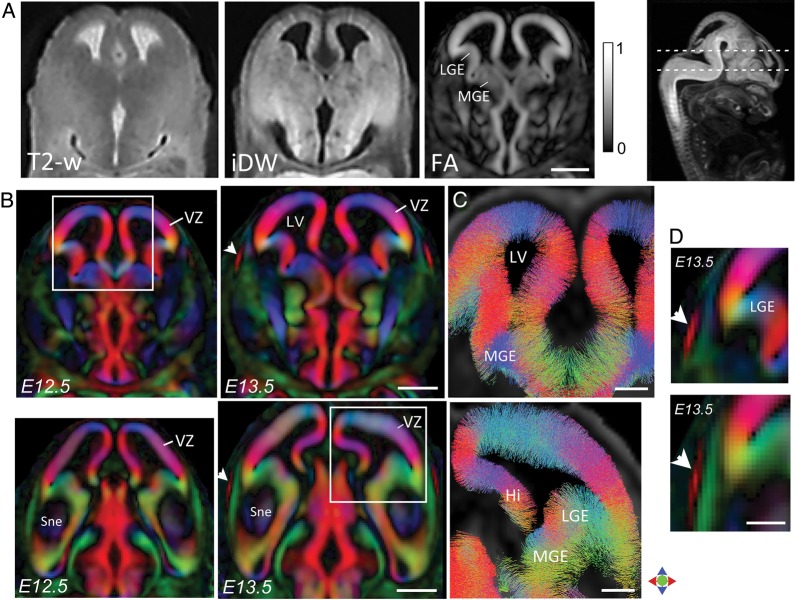
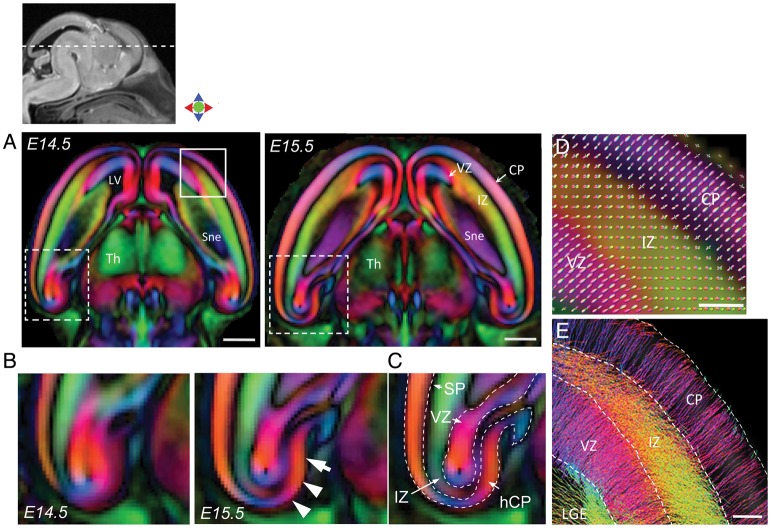
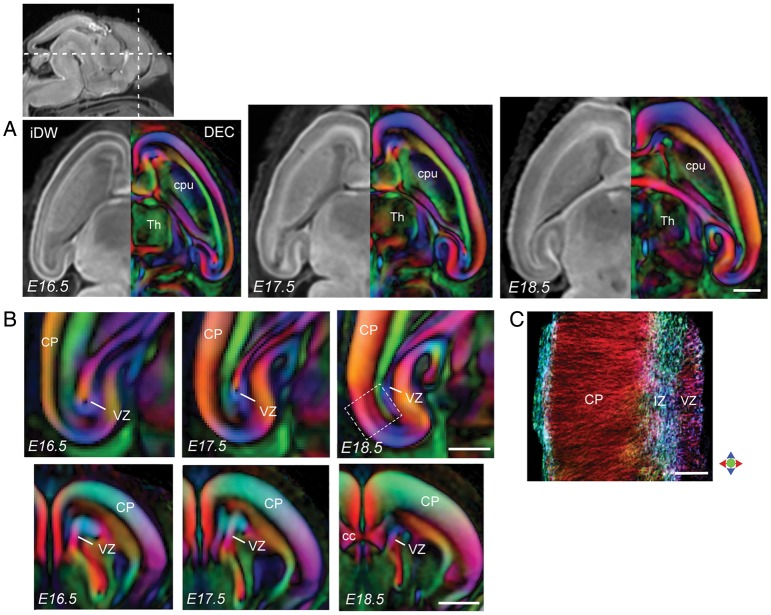
Cortical development in the mouse embryo involves complex changes in the microstructure of the telencephalic wall, which are challenging to examine using three-dimensional (3D) imaging techniques. In this study, high-resolution 3D diffusion magnetic resonance (dMR) microscopy of the embryonic mouse cortex is presented. Using diffusion-weighted gradient- and spin-echo based acquisition, dMR microimaging data were acquired from fixed mouse embryos at 7 developmental stages from embryonic day (E)12.5 to E18.5. The dMR imaging (dMRI) contrasts revealed microscopic structural detail in the mouse telencephalic wall, allowing delineation of transient zones in the developing cortex based on their unique diffusion signatures. With the high-resolution 3D data of the mouse embryo, we were able to visualize the complex microstructure of embryonic cerebral tissue and to resolve its regional and temporal evolution during cortical formation. Furthermore, averaged dMRI contrasts generated via deformable registration revealed distinct spatial and temporal gradients of anisotropy variation across the developing embryonic cortical plate and the ventricular zone. The findings of this study demonstrate the potential of 3D dMRI to resolve the complex microstructure of the embryonic mouse cortex, and will be important for investigations of corticogenesis and its disruption in embryonic mouse models.

Keywords: cortex; development; diffusion MRI; microimaging; mouse embryo.


Figures

Figure 1.
Figure 1.
Representative sagittal sections from the E12.5 mouse embryo showing sample-averaged tensor contrasts in the embryonic brain. (A) Sagittal view shows iDW contrasts from single-subject (left) and sample-averaged (right) whole embryo images. (BB′) Zoomed-in views of DEC images through select regions (in the forebrain and vertebral column, indicated by white boxes in A) illustrate the anatomical contrast and preservation of fine structural detail in the tensor-averaged orientation maps. Red: Medial-lateral; green: dorsal-ventral; blue: anterior-posterior. Scale bar for A = 1 mm, and for BB′ = 0.5 mm.
Figure 2.
Figure 2.
Diffusion MR microimaging of the embryonic mouse cortex at E12.5–E13.5. (A) Comparison of T2-weighted, iDW, and FA contrasts in a horizontal section through the E12.5 telencephalon shows markedly high diffusion anisotropy in the VZ (FA map, scale of 0–1). (B) DEC contrasts reveal the radial orientation of anisotropy throughout the VZ at E12.5 and E13.5. The location of the sections is indicated in the sagittal iDW image at the top right. White arrowheads indicate the appearance of the CP resolved in DEC maps at E13.5. Magnified views through the lateral cerebral wall are shown in D, indicating the emerging CP delineated by its radially oriented anisotropy (arrowheads). (C) Probabilistic streamline tracking based on the dMRI data (regions indicated by white boxes in B) shows fine radially oriented processes spanning the entire width of the VZ at E12.5 (top) and E13.5 (bottom). Fibers displayed in C are cropped to a horizontal slab of 0.1 mm thickness. Color indicates the local orientation (red: medial-lateral; green: dorsal-ventral; blue: anterior-posterior). Hi: hippocampal neuroepithelium; MGE: medial ganglionic eminence; LGE: lateral ganglionic eminence; LV: lateral ventricle; Sne: striatal neuroepithelium; VZ: ventricular zone. Scale bars for AB = 0.5 mm and for CD = 200 μm.
Figure 3.
Figure 3.
Delineation of the VZ, IZ, and developing CP with dMR microimaging at E14.5–E15.5. (A) Horizontal DEC sections through the telencephalon at E14.5 (left) and E15.5 (right) show distinct patterns of anisotropy in the embryonic cerebral wall, with radial orientation in the VZ and CP, and predominantly tangential orientation in the IZ. (BC) Comparison of DEC sections through the hippocampal formation at E14.5 and E15.5 (areas indicated by dashed white boxes in A) shows the appearance of a distinct hCP at E15.5 (white arrows). Structural boundaries of the VZ, IZ, and hCP resolved from the DEC contrasts at E15.5 are overlaid in C. (D) High-magnification view of a section through the lateral cerebral wall at E14.5 (corresponding to the region within the solid white box in A) shows the fiber orientation distributions estimated from the dMRI data overlaid on the DEC map. (E) Probabilistic tractography shows fine radially oriented processes reconstructed in the VZ and the CP at E14.5, with predominantly tangential orientation of fibers seen in the IZ and also in the LGE. LV: lateral ventricle; Sne: striatal neuroepithelium; SP: subplate; Th: thalamus. Scale bars for A = 0.5 mm, and for DE = 100 µm.
Figure 4.
Figure 4.
dMR microimaging of the embryonic mouse cortex from E16.5 to E18.5. (A) Horizontal sections through the telencephalon at E16.5, E17.5 and E18.5 show the radial pattern of anisotropy and increasing thickness of the CP with gestational age. iDW and DEC contrasts are shown in the left and right hemi-sections, respectively. (B) Magnified views of horizontal sections through the hippocampal formation (top panel) and coronal sections through the forebrain (bottom panel) show temporal changes in the thickness of the developing CP and the VZ resolved with DEC contrasts. The anatomical locations of the sections are indicated by dashed lines in the sagittal iDW image at the top left. (C) High-resolution track-density image of a small region through the cerebral wall at E18.5 (corresponding to the area within the dashed white box in B) reveals the radially arranged microstructure of cortical gray matter in the CP resolved with dMR microimaging. Color represents the local orientation of anisotropy (red: medial-lateral; green: dorsal-ventral; blue: anterior-posterior). cc: corpus callosum; cpu: caudoputamen; Th: thalamus. Scale bars for AB = 0.5 mm and for C = 100 μm.
Figure 5.
Figure 5.
Fluorescence immunohistochemistry of the embryonic cortical wall at E17.5. Horizontal sections immunolabeled with antibodies to GLAST (A) and βIII-tubulin (B) reveal the organization of the radial glial scaffold and axonal and dendritic processes in the embryonic cortex at E17.5. The radial and tangential orientation of processes in the VZ, CP, and IZ can be seen in the merged image (C). Scale bar = 100 μm.
Figure 6.
Figure 6.
TDI maps of the cerebral wall in the mouse embryo from E12.5 to E18.5. TDI sections in the coronal plane from the lateral region of the telencephalic wall at each developmental stage, generated at a grid size of 4 µm isotropic from the dMRI data, are shown. The TDI maps reveal the distinct developmental zones in the cerebral wall and their evolving microstructure at successive stages of corticogenesis. CP: cortical plate; IZ: intermediate zone; MZ: marginal zone; PP: primordial plexiform layer; VZ: ventricular zone. Color represents the local orientation of anisotropy (red: medial-lateral; green: dorsal-ventral; blue: anterior-posterior). Scale bar = 100 μm.
Figure 7.
Figure 7.
Delineation of developing callosal connections in the E18.5 mouse cortex. (A) Horizontal sections through sample-averaged iDW and DEC maps of the telencephalon show the embryonic cc resolved in DEC contrasts. (BD) Coronal DEC views through the forebrain (along the dashed lines in the iDW image at the top left) reveal the telencephalic commissures delineated at E18.5. (B′–D′) Magnified views of the dorsal telencephalic region (areas within the white boxes in BD) show the delineation of developing callosal fibers, at the level of the body (B′–C′), and the splenium (D′) of the cc. ac: anterior commissure; cc: corpus callosum; Cl: claustrum; fi: fimbria; h: hippocampus; hc: hippocampal commissure; scc: splenium of the cc; Sne: striatal neuroepithelium. Scale bars = 0.5 mm.
Figure 8.
Figure 8.
Cortical surface mapping of FA values in the embryonic mouse brain from E12.5 to E18.5. Color represents FA measurements from sample-averaged tensor data (n = 3) at each stage as shown in the color bar. White arrowheads indicate the marked transition in cortical FA seen along the rostro-caudal extent of the rhinal fissure (indicated by the black dashed line at E16.5) separating the neocortex and the paleocortex. The bottom panel shows the comparison of surface FA in the VZ at E14.5 (left) and E18.5 (right), indicating a drastic decrease in FA in the VZ with gestational age.
Figure 9.
Figure 9.
Regional changes in cortical anisotropy during embryonic development. (A) Plot showing the change in regional volumes of the VZ and CP with gestational age. Data points are volume measurements from embryonic specimens (n = 3) at each stage. The plot in the inset shows the VZ volume with the y-axis scaled to illustrate the temporal variation. (B) FA in the VZ and the CP plotted versus gestational age. Data shown are mean FA measurements over the VZ and the CP from embryos (n = 3) at each stage. (CD) Representative coronal section from an E18.5 embryo showing structural boundaries of cortical regions overlaid on the FA map, with 3D surface rendering of the segmented regions shown in D. CgCx: cingulate cortex; H: hippocampal formation; NCx: neocortex; PCx: paleocortex. Scale bar = 1 mm. (EH) Plots of regional FA measurements across the developing CP, in the neocortex (E), cingulate cortex (F), paleocortex (G), and the hippocampus (H). Dashed lines indicate the average FA profile over the entire CP, with error bars representing the standard deviation.

References

    1. Aggarwal M, Mori S, Shimogori T, Blackshaw S, Zhang J. 2010. Three-dimensional diffusion tensor microimaging for anatomical characterization of the mouse brain. Magn Reson Med. 64:249–261. - PMC - PubMed
    1. Aggarwal M, Zhang J, Miller MI, Sidman RL, Mori S. 2009. Magnetic resonance imaging and micro-computed tomography combined atlas of developing and adult mouse brains for stereotaxic surgery. Neuroscience. 162:1339–1350. - PMC - PubMed
    1. Alexander DC, Pierpaoli C, Basser PJ, Gee JC. 2001. Spatial transformations of diffusion tensor magnetic resonance images. IEEE Trans Med Imaging. 20:1131–1139. - PubMed
    1. Angevine JB, Jr, Sidman RL. 1961. Autoradiographic study of cell migration during histogenesis of cerebral cortex in the mouse. Nature. 192:766–768. - PubMed
    1. Austin CP, Cepko CL. 1990. Cellular migration patterns in the developing mouse cerebral cortex. Development. 110:713–732. - PubMed

Publication types