. 2014 Jun;44(6):1685-1698.
doi: 10.1002/eji.201343980. Epub 2014 Mar 19.

New insights into the role of the aryl hydrocarbon receptor in the function of CD11c⁺ cells during respiratory viral infection

Affiliations

New insights into the role of the aryl hydrocarbon receptor in the function of CD11c⁺ cells during respiratory viral infection

Guang-Bi Jin et al. Eur J Immunol. 2014 Jun.

Abstract

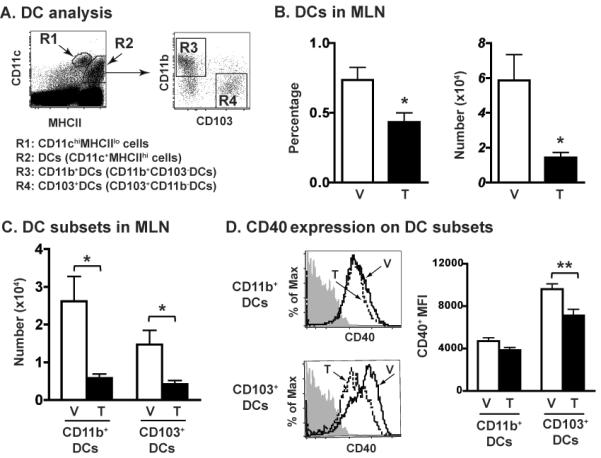
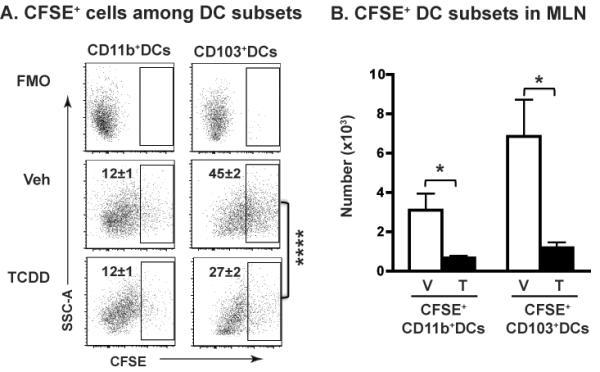
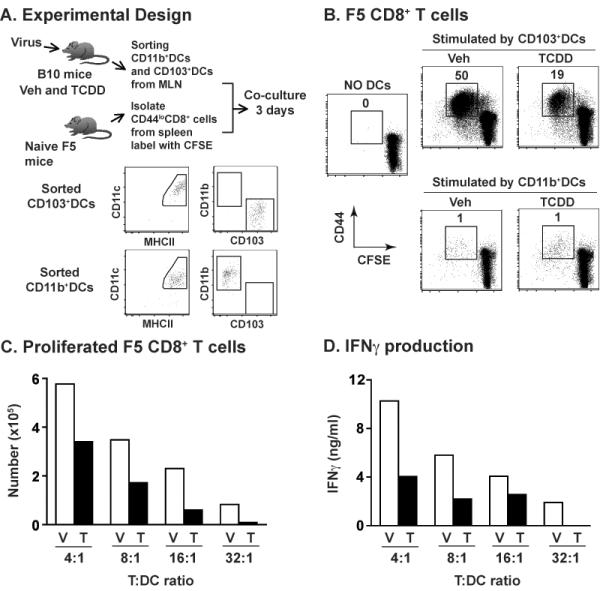
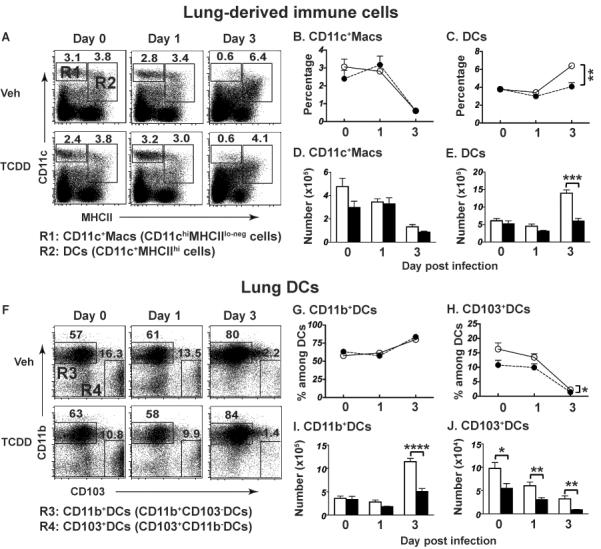
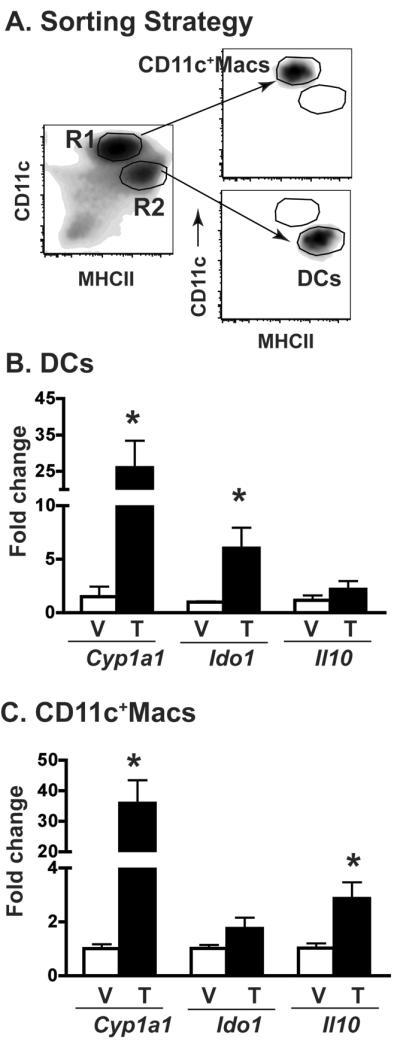
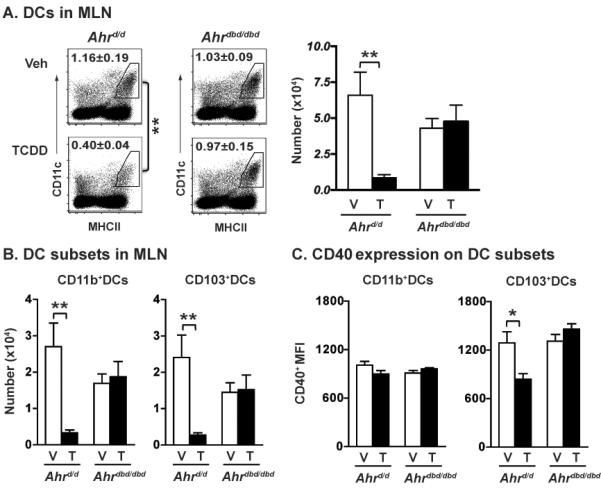
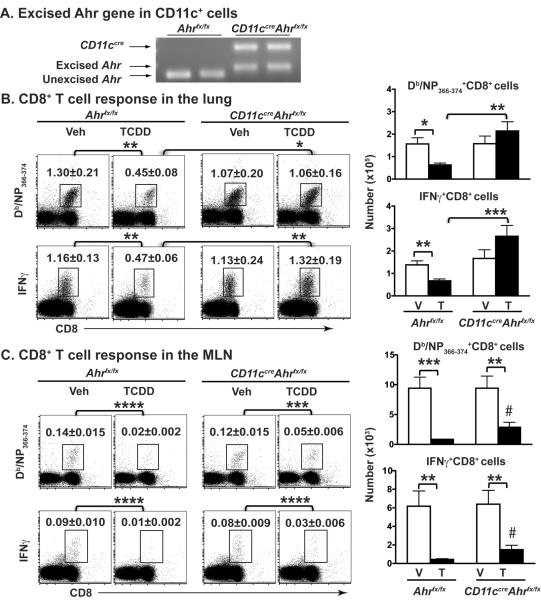
The aryl hydrocarbon receptor (AHR) has garnered considerable attention as a modulator of CD4(+) cell lineage development and function. It also regulates antiviral CD8(+) T-cell responses, but via indirect mechanisms that have yet to be determined. Here, we show that during acute influenza virus infection, AHR activation skews dendritic-cell (DC) subsets in the lung-draining lymph nodes, such that there are fewer conventional CD103(+) DCs and CD11b(+) DCs. Sorting DC subsets reveals AHR activation reduces immunostimulatory function of CD103(+) DCs in the mediastinal lymph nodes, and decreases their frequency in the lung. DNA-binding domain Ahr mutants demonstrate that alterations in DC subsets require the ligand-activated AHR to contain its inherent DNA-binding domain. To evaluate the intrinsic role of AHR in DCs, conditional knockouts were created using Cre-LoxP technology, which revealed that AHR in CD11c(+) cells plays a key role in controlling the acquisition of effector CD8(+) T cells in the infected lung. However, AHR within other leukocyte lineages contributes to diminished naïve CD8(+) T-cell activation in the draining lymphoid nodes. These findings indicate DCs are among the direct targets of AHR ligands in vivo, and AHR signaling modifies host responses to a common respiratory pathogen by affecting the complex interplay of multiple cell types.

Keywords: Antiviral immunity; CD8+ T cells; Dendritic cells (DCs); Influenza A virus.


Figures

Figure 1
Figure 1
AHR activation reduces the number of CD11b+ and CD103+ DCs in the MLNs. Female B6 mice were dosed orally with 10 μg/kg of TCDD (TCDD-treated group, T) or peanut oil (vehicle-treated group, V) one day prior to influenza A virus infection (i.n., Mem/102, H3N2). MLN cells were collected 3 days later and stained with mAbs for flow cytometric analysis. (A) Doublet discrimination and live cell gating was used following strategies outlined in Supporting Information Fig. 4A. Two distinct populations of CD11c+ cells in the MLN: CD11chiMHCIIlo cells (R1 gate, monocytes) and CD11c+MHCIIhi cells (R2 gate, DCs). DCs are further analyzed to enumerate CD11b+DCs (R3 gate) and CD103+DCs (R4 gate). (B) The average percentage and number of DCs in the MLN. (C) The number of CD11b+DCs and CD103+DCs in the MLN. (D) Representative histograms of CD40 expression on the indicated DC subsets. Gray filled histograms depict the CD40 FMO controls; black lines indicate CD40 on cells from the vehicle group and dashed lines indicate CD40 from TCDD treatment group. The bar graph shows the average CD40 MFI in each DC subset from each treatment group. Data are shown as mean ± SEM (n = 7/group) from one experiment that is representative of 3 independent experiments. *p < 0.05, **p < 0.01, two-tailed unpaired Student's t-test.
Figure 2
Figure 2
AHR activation reduces lung DC migration to the MLN. Mice were treated and infected as described in Fig. 1, except that they were given CFSE (i.n.) 18 h before infection. On day 3-post infection, MLNs were removed and processed for flow cytometry. CD11b+ and CD103+ DCs are defined as described in Fig. 1A, and the frequency of CFSE+ DCs was analyzed. CFSE+ cells were defined using MLN cells from mice that received media i.n. (FMO control). (A) Numbers on each gated region indicate the percentage of CFSE+ cells among CD11b+ or CD103+ DCs. (B) Bar graphs depict the average number of CFSE+CD11b+ and CFSE+CD103+ DCs in the MLN. Data are shown as mean ± SEM (n = 7/group) from one experiment that is representative of two independent experiments. *p < 0.05, ****p < 0.0001, two-tailed unpaired Student's t-test.
Figure 3
Figure 3
AHR activation reduces the ability of CD103+DCs to stimulate naïve virus-specific CD8+ T cells. (A) The overall approach: mice were treated and infected as described in Fig. 1. On day 3-post infection MLN cells were pooled from mice in the same group (≥30 mice/group) and stained with fluorochrome-conjugated mAbs. Using the same gating strategy as in Fig. 1A, DCs were sorted to obtain CD11b+DCs and CD103+DC (purity of sorted subsets ≥95%). Sorted DCs were serially diluted and used to stimulate CFSE-labeled naïve (CD44lo) F5 CD8+ T cells (2×10⁵ cells/well), in a range from 4:1 to 32:1 T cells:DCs. Cells were collected after 3 days of ex vivo co-culture and stained for flow cytometric analysis. DCs in the co-culture were excluded and CD3+CD8+ cells were used to identify F5 CD8+ T cells (Supporting Information Fig. 4B). (B) Number on each dot plot indicates the percentage of activated (CFSEdecayCD44hi) F5 CD8+ T cells after culture with CD103+DCs (16:1 T:DC ratio) or CD11b+DCs (8:1 T:DC ratio). “NO DCs” shows CFSE-labeled naïve F5 CD8+ T cells cultured in the absence of antigen-bearing DCs. (C) Bar graphs show the number of activated F5 CD8+ T cells stimulated by CD103+DCs derived from MLN of vehicle (V) or TCDD (T) treated mice, and (D) IFNγ levels in corresponding co-culture supernatants. Other controls include the use of sorted CD11chiMHCIIlo cells from Mem/102 infected mice, and isolated CD11c+ cells from mice infected with HKx31, a strain that cannot be recognized by F5 transgenic CD8+ T cells. These cells failed to stimulate CD8+ T cell activation at any T cell:DC ratio used (not shown). Data shown are from one experiment that is representative of two independent experiments with the same results.
Figure 4
Figure 4
AHR activation modulates DCs in the lung. Female B6 mice were treated and infected as described in Fig. 1, and sacrificed on the indicated day relative to infection. Lung-derived immune cells were obtained using collagenase digestion and stained with fluorochrome-conjugated Abs. (A) Following gating to exclude doublets, dead and autofluorescent cells (Supporting Information Fig. 4C), CD45.2+CD11c+ cells were divided into two sub-populations: CD11chiMHCIIlo cells (R1 gate, CD11c+Macs) and CD11c+MHCIIhi cells (R2 gate, DCs). DCs were further analyzed as CD11b+DCs (R3 gate) and CD103+DCs (R4 gate). Numbers on dot plots show the average percentage of cells in the gated region. Panels B and C show the percentage of CD11c+Macs and DCs, D and E depict number of CD11c+Macs and DCs in the lung. Panels G and H show the percentage of CD11b+ and CD103+ cells among DCs, and I and J depict the number of CD11b+ and CD103+ DCs in the lung. Data are shown as mean ± SEM (n = 7–8/group) are from one experiment that is representative of at least two independent experiments with same results. *p < 0.05, **p < 0.01, ***p < 0.001, ****p < 0.0001, one-way ANOVA followed by Tukey HSD.
Figure 5
Figure 5
Cell type specific AHR-mediated changes in gene expression. Female B6 mice were treated and infected as described in Fig. 1. (A) Lung-derived CD11c+ cells were enriched using mouse CD11c microbeads and then sorted into CD11c+ Macs (R1 gate) and DCs (R2 gate); purity ≥99%. Total RNA was isolated from sorted cells, and Cyp1a1, Ido1, and Il-10 gene expression determined by quantitative real time PCR. (B,C) The average fold change (ΔΔCT) in gene expression compared to vehicle-treated mice and normalized to L13 is shown for sorted (B) DCs and (C) CD11c+Macs. V, indicates vehicle treatment group, T indicates TCDD treatment group. Data are shown as mean ± SEM (n=3 separate pools/group; where each pool consisted of cells from 10–15 mice). *p < 0.05, two-tailed unpaired Student's t-test. Data are representative of two independent experiments with same results.
Figure 6
Figure 6
Alterations in DC subset distribution require the ligand-activated AHR have a functional DNA binding domain. Female B6 congenic (Ahrd/d) and Ahrdbd/dbd mutant mice received a single oral dose of either peanut oil or TCDD (100 μg/kg) one day before infection (i.n.). Three days later, MLN cells were collected, stained with mAbs, and data were analyzed as described in Fig. 1A. (A) The number on each gated region shows the average percentage of DCs in each group, and bar graphs depict the average number of DCs in the MLN. (B) The graphs show the number of CD11b+DCs (left) and CD103+DCs (right) in the MLN. (C) The bar graphs depict the CD40 MFI in each DC subset. Data are shown as mean ± SEM (n = 5–6/group) from one experiment representative of three performed. *p < 0.05, **p < 0.01 compared within genotype using one-way ANOVA with post hoc tests.
Figure 7
Figure 7
Excision of Ahr in CD11c+ cells restores TCDD-induced decrease in virus-specific CD8+ T cells in the lung. (A) Splenic CD11c+MHCII+ cells from Ahrfx/fx and CD11cCreAhrfx/fx mice were stained with Abs and sorted (FACS Aria). Genomic DNA from sorted cells was used to validate expression of the excised and unexcised Ahrfx gene by PCR. (B and C) Ahrfx/fx and CD11cCreAhrfx/fx mice were treated and infected as described in Fig. 6. On day 9 post infection, lung-derived immune cells (B) and MLN cells (C) were stained with MHCI tetramers (Db/NP366–374) or anti-IFNγ Ab combined with anti-CD8 Ab. Doublets and dead cells were gated out (Supporting Information Fig. 4D and 4E). Numbers on each gated region of representative dot plots show the percentage of Db/NP366–374+ or IFNγ+ CD8+ T cells in the lung and MLN. Bar graphs depict the number of NP-specific CD8+ T cells and IFNγ+ CD8+ T cells in each compartment. V, indicates vehicle treatment group, T indicates TCDD treatment group. Data are shown as mean ±SEM (n=7–8/group) from one of two independent experiments with same results. *p < 0.05, **p < 0.01, ***p < 0.001, ****p < 0.0001 compared with V group of same genotype; # p < 0.05 compared with Ahrfx/fx group treated with TCDD; one-way ANOVA follow by post-hoc test (Tukey HSD).

Similar articles

Cited by

References

    1. Denison M, Nagy S. Activation of the aryl hydrocarbon receptor by structurally diverse exogenous and endogenous chemicals. Annu. Rev. Phramacol. Toxicol. 2003;43:309–334. - PubMed
    1. Nguyen LP, Bradfield CA. The search for endogenous activators of the aryl hydrocarbon receptor. Chem Res Toxicol. 2008;21:102–116. - PMC - PubMed
    1. Lawrence BP, Kerkvliet NI. Immune modulation by TCDD and related polyhalogenated aromatic hydrocarbones. In: Luebke R, House R, Kimber I, editors. Immunotoxicology and Immumopharmacology. 3 Edn CRC Press, Taylor & Francis Group; Boca Raton, FL: 2006. pp. 239–258.
    1. Kerkvliet NI, Steppan LB, Vorachek W, Oda S, Farrer D, Wong CP, Pham D, Mourich D. Activaiton of aryl hydrocarbon receptor by TCDD prevents diabetes in NOD mice and increases Foxp3+ T cells in pancreatic lymph nodes. Immunotherapy. 2009;1:539–547. - PMC - PubMed
    1. Quintana FJ, Basso AS, Iglesias AH, Korn T, Farez MF, Bettelli E, Caccamo M, Oukka M, Weiner HL. Control of Treg and TH17 cell differentiation by the aryl hydrocarbon receptor. Nature. 2008;453:65–71. - PubMed

Publication types

MeSH terms