. 2014 Feb 15;5(3):764-74.
doi: 10.18632/oncotarget.1769.

Identification of a long non-coding RNA as a novel biomarker and potential therapeutic target for metastatic prostate cancer

Affiliations

Identification of a long non-coding RNA as a novel biomarker and potential therapeutic target for metastatic prostate cancer

Francesco Crea et al. Oncotarget. .

Abstract

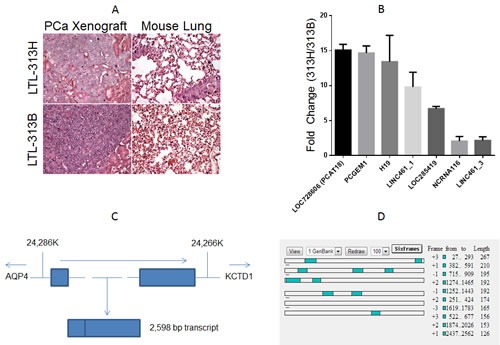
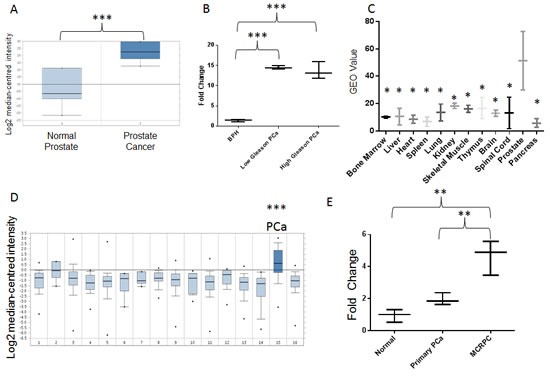
Metastatic prostate cancer (PCa) is still an incurable disease. Long non-coding RNAs (lncRNAs) may be an overlooked source of cancer biomarkers and therapeutic targets. We therefore performed RNA sequencing on paired metastatic/non-metastatic PCa xenografts derived from clinical specimens. The most highly up-regulated transcript was LOC728606, a lncRNA now designated PCAT18. PCAT18 is specifically expressed in the prostate compared to 11 other normal tissues (p<0.05) and up-regulated in PCa compared to 15 other neoplasms (p<0.001). Cancer-specific up-regulation of PCAT18 was confirmed on an independent dataset of PCa and benign prostatic hyperplasia samples (p<0.001). PCAT18 was detectable in plasma samples and increased incrementally from healthy individuals to those with localized and metastatic PCa (p<0.01). We identified a PCAT18-associated expression signature (PES), which is highly PCa-specific and activated in metastatic vs. primary PCa samples (p<1E-4, odds ratio>2). The PES was significantly associated with androgen receptor (AR) signalling. Accordingly, AR activation dramatically up-regulated PCAT18 expression in vitro and in vivo. PCAT18 silencing significantly (p<0.001) inhibited PCa cell proliferation and triggered caspase 3/7 activation, with no effect on non-neoplastic cells. PCAT18 silencing also inhibited PCa cell migration (p<0.01) and invasion (p<0.01). These results position PCAT18 as a potential therapeutic target and biomarker for metastatic PCa.


Conflict of interest statement

No potential conflicts of interest were declared.

Figures

Figure1
Figure1
A Hematoxylin-eosin staining of the xenograft (left panels) and mouse lung tissue (right panels) of transplantable prostate cancer tumor lines LTL-313H and LTL-313B. LTL-313H cells are more locally invasive to the adjacent kidney than−313B cells, and show signs of distant metastatic spreading (never found in LTL-313B-engrafted mice). .B, qPCR confirmation of RNA Seq. data (columns represent average value, bars represent standard deviation, 2 replicate experiments). Values indicate relative expression level in LTL-313H vs. LTL-313B cells. We chose the 4 most up-regulated and 3 randomly selected transcripts. C, Schematic representation of the PCAT18 locus (NLM “Gene” website). The gene is located in a region between 24,286 and 24,266 K (Chromosome 18 primary assembly). Lines represent introns, rectangles represent exons. Dotted lines represent a relative distance that is bigger than the one shown in the picture. Arrows represent transcription direction. The genes flanking PCAT18 locus (AQP4, aquaporin-4; KCTD1, Potassium Channel Tetramerization Domain-Containing Protein 1) are shown. D, ORF finder output for PCAT18 sequence. Open Reading Frames are shown as shaded squares throughout the sequence. Each lane represents a possible reading frame. The software identified no ORF longer than 267 bp for a transcript longer than 2Kb. Considering 6 possible reading frames, protein-coding regions could account for no more than 16% of the whole transcript.
Figure2
Figure2
A, PCAT18 expression in normal prostate (n=6) and PCa (n=7) samples (horizontal bar represents median value, vertical bars represent minimum and maximum value per group). Query thresholds for all Oncomine analysis were p<0.01 and fold change>2. All Oncomine outputs passing these thresholds in prostate cancer studies are shown in Fig. 2. The non-significant correlations are summarized in Suppl. Table 6. Oncomine™ database (Compendia Bioscience, Ann Arbor, MI) was used for analysis and visualization. ***p<0.001 (Oncomine Analysis). Fold change: 7.2. B, PCAT18 expression (qPCR) in benign prostatic hyperplasia (BPH, n=5), low-Gleason (n=5) and high-Gleason (n=6) PCa samples. (Median-centered values, bars represent minimum and maximum value per group). ***p<0.001 (ANOVA and Tukey's post-test). C, Expression of PCAT18 in 12 benign tissues (GEO database, http://www.ncbi.nlm.nih.gov/geo/, study ID: HG-U95D), n=2 per tissue, horizontal bar represents mean value, vertical bars represent minimum and maximum value per group. *p<0.05 compared to prostate (ANOVA and Holm-Sidak`s post-test). Fold Change: 2.78-8.75 (prostate compared to other tissues). D, Oncomine analyis of PCAT18 expression in 16 tumor tissues (median-centered values, bars represent minimum and maximum value per group). Data are centered to the median level of expression in the whole cohort. Sample size for each tumor type is in brackets: 1. Bladder Cancer (32); 2. Brain and CNS Cancer (4); 3. Breast Cancer (328); 4. Cervical Cancer (35); 5. Colorectal Cancer (330); 6. Esophageal Cancer (7); 7. Gastric Cancer (7); 8. Head and Neck Cancer (41); 9. Kidney Cancer (254); 10. Liver Cancer (11); 11. Lung Cancer (107); 12. Lymphoma (19); 13. Ovarian Cancer (166); 14. Pancreatic Cancer (19); 15. Prostate Cancer (59); 16. Sarcoma (49). ***p<0.001 E, PCAT18 expression (qPCR) in plasma samples from normal individuals and patients with localized or metastatic castration-resistant (mCRPC) PCa, (median-centered values, bars represent minimum and maximum value per group) **p<0.01 (ANOVA and Tukey's post-test). Samples were processed as previously described [4] for plasma separation, RNA extraction, retrotranscription and quantification. Oncomine™ (Compendia Bioscience, Ann Arbor, MI) was used for analysis and visualization.
Figure 3
Figure 3
A, Transcripts positively associated with PCAT18 (SAM analysis, Q<0.5%) were analyzed in Oncomine for “literature defined concepts” (p−4, odds ratio>2).Here we show the top 3 concepts associated with JES. B, PCAT18 expression levels in untreated LNCaP cells (Control) and cells supplemented with dihydrotestosterone (DHT, 10nM, 6-24-48h). LNCaP cells were grown in phenol red-free medium (RPMI-1640) supplemented with 10% charcoal-stripped FBS. Columns represent mean value (2 independent experiments performed in triplicate), bars standard deviation. C, Expression of 3 genes in xenografts from mice supplemented with Testosterone (Test.) (2.5mg/mouse, n=2) or after castration (1, 2, 3 weeks, n=3). LOC728606 (PCAT18) down-regulation is comparable to that of PSA. Data are from LTL-331 human prostate cancer xenografts (www.livingtumorlab.com) and normalized to the average HPRT1 expression level in testosterone-supplemented animals. HPRT1 expression is stable pre- and post-castration (unpublished microarray data). RNA extraction, retro-transcription and QPCR were performed as described in Fig. 1B legend. D, E, The living tumor lab (www.livingtumorlab.com) comprises a collection of patient-derived PCa tumor tissue xenografts, originated with a method described in reference. An androgen-dependent PCa line (LTL313B) has been exposed to castrate-levels of testosterone for a prolonged time, in order to generate a castration-resistant subline. The figures show LTL313B tumor volume (D) and serum PSA levels (E) before and after castration. Neoplastic cells were implanted in male NOD/SCID intact mice, supplemented with testosterone until castration. Serum PSA was measured and mice were sacrificed for tumor volume measurement at indicated time points, as described before [25]. At 12-16 weeks post-castration, a castration-resistant, AR-positive cell line was generated (LTL-313BR). F, PCAT18 expression was measured by qPCR in testosterone-supplemented LTL313B, castrated xenografts (3 weeks) and in a CRPC subline (LTL313BR, no testosterone supplementation).
Figure 4
Figure 4
A, C4-2 invasion was quantified 24h after the start of the invasion assay. Cells were transfected with 2nM Negative Control (NC) or PCATT18-targeting siRNA1 and siRNA2. Columns represent mean value (4 experiments) bar SD. ***p<0.001 (ANOVA and Dunnett's post-test). B, C4-2 cell migration was quantified at 6h, 24h or 48h post-transfection, **P<0.01, ***P<0.001 (siRNA vs. NC), 2 way ANOVA and Tukey's post-test. C, D, E, MTT assay was performed on LNCaP (C) C4-2 (D) and BPH (E) cells treated with negative control (NC) or PCAT18-targeting siRNAs (both at 2nM concentration) on days 1-3-5 post-transfection, as previously described [30]. Dots represent mean value, lines standard deviation (2 experiments performed in triplicate, data normalized to cell number in NC-day1) ***p<0.001 (2 way ANOVA and Tukey's post-test). F, LNCaP cells were transfected with negative control (NC) or PCAT18-targeting siRNAs for 5 days. Bars represent mean values, lines standard deviations (2 independent experiments performed in triplicate). ***p<0.001 with respect to NC (ANOVA and Dunnet's post-test).

References

    1. Bishr M, Saad F. Overview of the latest treatments for castration-resistant prostate cancer. Nat Rev Urol. 2013 - PubMed
    1. Rodrigues G, Warde P, Pickles T, Crook J, Brundage M, Souhami L, Lukka H, Genitourinary Radiation Oncologists of C Pre-treatment risk stratification of prostate cancer patients: A critical review. Canadian Urological Association journal = Journal de l'Association des urologues du Canada. 2012;6(2):121–127. - PMC - PubMed
    1. Kapranov P, Cheng J, Dike S, Nix DA, Duttagupta R, Willingham AT, Stadler PF, Hertel J, Hackermuller J, Hofacker IL, Bell I, Cheung E, Drenkow J, Dumais E, Patel S, Helt G, et al. RNA maps reveal new RNA classes and a possible function for pervasive transcription. Science. 2007;316(5830):1484–1488. - PubMed
    1. Watahiki A, Macfarlane RJ, Gleave ME, Crea F, Wang Y, Helgason CD, Chi KN. Plasma miRNAs as Biomarkers to Identify Patients with Castration-Resistant Metastatic Prostate Cancer. International journal of molecular sciences. 2013;14(4):7757–7770. - PMC - PubMed
    1. Chen G, Wang Z, Wang D, Qiu C, Liu M, Chen X, Zhang Q, Yan G, Cui Q. LncRNADisease: a database for long-non-coding RNA-associated diseases. Nucleic acids research. 2013;41(Database issue):D983–986. - PMC - PubMed

Publication types