. 2014 Apr 4;289(14):9584-99.
doi: 10.1074/jbc.M113.526517. Epub 2014 Feb 11.

Toll-like receptor 4-mediated endoplasmic reticulum stress in intestinal crypts induces necrotizing enterocolitis

Affiliations

Toll-like receptor 4-mediated endoplasmic reticulum stress in intestinal crypts induces necrotizing enterocolitis

Amin Afrazi et al. J Biol Chem. .

Abstract

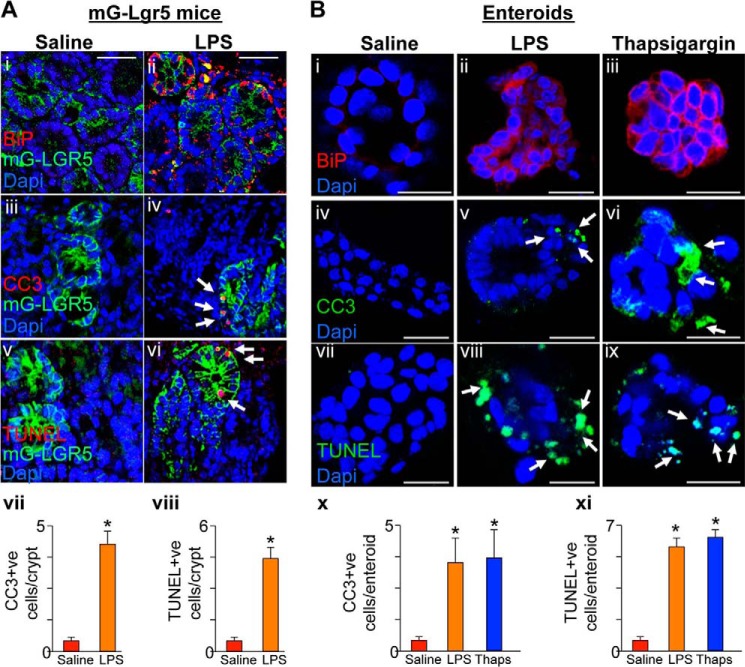
The cellular cues that regulate the apoptosis of intestinal stem cells (ISCs) remain incompletely understood, yet may play a role in diseases characterized by ISC loss including necrotizing enterocolitis (NEC). Toll-like receptor-4 (TLR4) was recently found to be expressed on ISCs, where its activation leads to ISC apoptosis through mechanisms that remain incompletely explained. We now hypothesize that TLR4 induces endoplasmic reticulum (ER) stress within ISCs, leading to their apoptosis in NEC pathogenesis, and that high ER stress within the premature intestine predisposes to NEC development. Using transgenic mice and cultured enteroids, we now demonstrate that TLR4 induces ER stress within Lgr5 (leucine-rich repeat-containing G-protein-coupled receptor 5)-positive ISCs, resulting in crypt apoptosis. TLR4 signaling within crypts was required, because crypt ER stress and apoptosis occurred in TLR4(ΔIEC-OVER) mice expressing TLR4 only within intestinal crypts and epithelium, but not TLR4(ΔIEC) mice lacking intestinal TLR4. TLR4-mediated ER stress and apoptosis of ISCs required PERK (protein kinase-related PKR-like ER kinase), CHOP (C/EBP homologous protein), and MyD88 (myeloid differentiation primary response gene 88), but not ATF6 (activating transcription factor 6) or XBP1 (X-box-binding protein 1). Human and mouse NEC showed high crypt ER stress and apoptosis, whereas genetic inhibition of PERK or CHOP attenuated ER stress, crypt apoptosis, and NEC severity. Strikingly, using intragastric delivery into fetal mouse intestine, prevention of ER stress reduced TLR4-mediated ISC apoptosis and mucosal disruption. These findings identify a novel link between TLR4-induced ER stress and ISC apoptosis in NEC pathogenesis and suggest that increased ER stress within the premature bowel predisposes to NEC development.

Keywords: Inflammation; Innate Immunity; Necrotizing Enterocolitis; Sepsis; Toll-like Receptors (TLR).


Figures

FIGURE 1.
FIGURE 1.
Generation of mice expressing TLR4 selectively within the intestinal epithelium. A, schematic diagram showing the generation of TLR4ΔIEC-OVER transgenic mice. The positions of coding regions of genes in the expression cassette downstream of the TRE-mini-CMV and CAG promoter are shown. B, diagrammatic representation of the breeding scheme is shown, as described under “Experimental Procedures.” C, genomic PCR from tail tip DNA confirming the genotype of the indicated strain. D, RT-PCR showing the expression of TLR4 within the small intestine or lung of the indicated strain to validate the genotype of the transgenic mice, along with RPLO as the housekeeping gene. E, expression of IL-6 by qRT-PCR in the small intestines and lungs of mice of the indicated strain showing selective induction of IL-6 within the intestine but not the lung in the TLR4−/−;IECOVER (TLR4ΔIEC-OVER) mice. Sal, saline. *, p < 0.05 versus saline; **, p < 0.05 LPS-treated TLR4−/− versus wild type; ***, LPS-treated lung versus small intestine.
FIGURE 2.
FIGURE 2.
TLR4 activation induces ER stress and apoptosis in IEC-6 enterocytes and intestinal crypts. A and B, representative confocal images of IEC-6 cells (A) or intestinal crypts in C57BL/6 mice (B) stained for BiP (panels i–iii), cleaved caspase-3 (panels vii–ix), or TUNEL (panels x-xii). Cells/mice were treated as indicated with LPS (50 μg/ml cells 1 h for P-PERK and 6 h for BIP, CHOP, and CC3; 5 mg/kg mice, 3 h for P-PERK and 6 h for BIP, CHOP, and CC3) or thapsigargin (0.5 μm cells, 0.5 mg/kg mice for time points similar to LPS treatments); SDS-PAGE showing BiP, CHOP, P-PERK, or CC3 and loading control β-actin in IEC-6 cells (A, panel iv) or wild-type mice (B, panel iv); qRT-PCR for spliced XBP1s or ATF6 in IEC-6 cells (A, panels v and vi) or mice (B, panels v and vi) under the indicated treatment. Panels xiii and xiv, quantification of cleaved caspase-3 positive or TUNEL positive IEC-6 cells or crypts/high power field. *, p < 0.05 control/saline or thapsigargin versus LPS. The results are representative of three separate experiments with three to five mice per group. The data are the means ± S.E. Scale bars, 10 μm. Arrows, apoptotic cells. Ctrl, control; Thaps, thapsigargin.
FIGURE 3.
FIGURE 3.
TLR4 activation induces ER stress and apoptosis in Lgr5-positive stem cells and cultured enteroids. A, representative confocal micrographs of intestinal crypts in mG-Lgr5 lineage tracing reporter mice treated with saline (panels i, iii, and v) or LPS (5 mg/kg 6 h prior; panels ii, iv, and vi) and immunostained for BiP (panels i and ii), CC3 (panels iii and iv), or TUNEL (panels v and vi). Panels vii and viii, blinded quantification of apoptosis over 50 high power fields. B, representative confocal micrographs of enteroids from the ilea of mice treated as indicated and immunostained with BiP (panels i–iii), cleaved caspase-3 (panels iv–vi), or TUNEL (panels vii–ix). Panels x and xi, blinded quantification of apoptosis over 50 high power fields. LPS treatment included enteroids (25 μg/ml) for 6 h and thapsigargin (0.5 μm) for 6 h. **, p < 0.05 saline or thapsigargin versus LPS. The results are representative of at least three separate experiments with three to five mice per group. The data are means ± S.E. Scale bars, 10 μm. Arrows, apoptotic cells.
FIGURE 4.
FIGURE 4.
TLR4-induced ER stress in the intestinal crypts requires the adapter molecule MyD88. A, SDS-PAGE showing the knockdown of TRIF (panel i) and MyD88 (panel ii) in IEC-6 cells. Blots were stripped and reprobed for β-actin. B and C, representative confocal micrographs of IEC-6 cells (B) and crypts (C) from terminal ileum of mice deficient in MyD88 or TRIF or that were treated with Bay11 (2 μm, 30 min prior), treated with LPS (50 μg/ml for 6 h, except 1 h for P-PERK for cells, 5 mg/kg for 6 h, except 3 h for P-PERK for mice) and stained for BiP (B, panels i–iii, and C, panels i and ii), CC3 (B, panels iv–vi, and C, panels iii and iv), or TUNEL (B, panels vii–ix, and C, panels v and vi). D and E, SDS-PAGE for BiP, P-PERK, CHOP, or CC3 in IEC-6 cells (D) or mice (E) after treatment with LPS (conditions as in B and C); blots reprobed for actin. F, qRT-PCR showing the expression of ATF6 in cells (left panel) or mice (right panel) under the conditions indicated, corresponding to those in B and C. G and H, blinded evaluation of apoptosis via quantification of CC3 (G) or TUNEL (H) in LPS-treated IEC-6 cells and mice as indicated. *, p < 0.05 TRIF-deficient versus MyD88-deficient groups. The results are representative of three separate experiments with 50 high power fields and three to five mice per group. The data are means ± S.E. Scale bars, 10 μm.
FIGURE 5.
FIGURE 5.
TLR4-induced ER stress leads to apoptosis in IEC-6 cells and intestinal crypts via the PERK-CHOP signaling pathway. A, RT-PCR showing stable knockdown of the indicated gene by mRNA expression in IEC-6 cells that had been transduced with lentivirus expressing target or scrambled (control) shRNA. B, representative SDS-PAGE showing mucosal scrapings from three separate mice that were orally fed with lentivirus expressing either empty vector of shRNA for 3 consecutive days (200 μl of 103–104 PFU/ml) and analyzed 24 h after the last lentiviral feeding. The blots are probed by SDS-PAGE for PERK, stripped, and then reprobed for actin. C and D, panels i–iv and vi–ix, representative confocal images of gene-modified IEC-6 cells (C) or crypts (D) from mice in which the indicated gene had been deleted and which were then treated with LPS (50 μg/ml for 6 h for cells, 5 mg/kg for 6 h for mice) and stained for cleaved caspase-3 or TUNEL as indicated. Arrows indicate apoptotic cells. C and D, panels v and x, blinded quantification of apoptosis in IEC-6 cells or crypts. *, p < 0.05 versus cells (C, panels v and x) or mice (D, panels v and x) deficient in ATF6 or XBP1. The results are representative of three separate experiments in triplicate with over 50 high power fields analyzed. The data are means ± S.E. Scale bars, 10 μm.
FIGURE 6.
FIGURE 6.
TLR4-mediated generation of ER stress within intestinal crypts induces NEC development via the PERK/CHOP pathway. A, representative photomicrographs of the hematoxylin- and eosin-stained terminal ileum (panels i–vi) and confocal images of ileal crypts from newborn intestine (panels vii–xviii) from wild-type mice, mice lacking TLR4 within the intestinal epithelium (TLR4ΔIEC), mice expressing TLR4 only within the intestinal epithelium (TLR4ΔIEC-OVER), mice lacking PERK in the intestinal epithelium (PERKKD), or mice globally deficient in CHOP (CHOP−/−). The mice were either breast fed (control) or induced to develop necrotizing enterocolitis as indicated. The slides were then stained for BiP (panels vii–xii), or CC3 (panels xiii–xviii). B, NEC severity as assessed by blinded histopathology NEC severity score (panel i) or expression of iNOS by qRT-PCR in the terminal ileum (panel ii). C, panel i, qRT-PCR in ileal mucosa of XBP1s. Panel ii, blinded evaluation of cleaved caspase-3 in the intestinal crypts in three consecutive experiments over 50 high power fields with three to five mice per experiment. In all graphs: *, p < 0.05 wild-type NEC versus control; #, p < 0.05 NEC wild type versus NEC in TLR4ΔIEC mice; ##, p < 0.05 NEC in TLR4ΔIEC-OVER versus control wild type; **, p < 0.05 NEC in PERK or CHOP-deficient mice versus NEC in wild-type mice. The data are means ± S.E. Scale bars, 10 μm. Arrows, apoptotic cells. Ctrl, control.
FIGURE 7.
FIGURE 7.
Inhibition of PERK attenuates TLR4-induced ER stress and apoptosis in the TLR4ΔIEC-OVER mice. A, qRT-PCR showing the expression of TLR4 (panel i) or PERK (panel ii) in the small intestinal mucosa of TLR4ΔIEC-OVER mice after administration of lentiviruses containing PERK shRNA. *, p < 0.005 blue bars versus orange bars. The results are representative of three to five mice. B, representative confocal micrographs of intestinal crypts showing staining for BiP (panels i–iii) or TUNEL (panels iv–vi) in TLR4ΔIEC-OVER mice that had been treated with saline (panels i and iv) or LPS (panels ii and v) or in TLR4ΔIEC-OVER mice that had been administered by oral gavage lentiviruses expressing PERK shRNA for 3 consecutive days (200 μl of 103–104 PFU/ml) (panels iii and vi). C, panel i, blind quantification of apoptosis pertaining to groups depicted in B treated with saline or LPS as indicated. Panels ii and iii, qRT-PCR showing the expression of XBP1s (panel ii) or ATF6 (panel iii) in the intestinal mucosa of the indicated mice treated with either LPS or saline as shown. *, p < 0.05 saline versus LPS-treated TLR4ΔIEC-OVER mice; **, p < 0.05 TLR4ΔIEC-OVER mice versus TLR4ΔIEC-OVER mice + PERK shRNA. The results are representative of three separate experiments. The data are means ± S.E. Scale bars, 10 μm. Arrows, apoptotic cells. Sal, saline.
FIGURE 8.
FIGURE 8.
Increased baseline ER stress within the fetal bowel predisposes to the development of necrotizing enterocolitis in mice and humans. A and B, representative photomicrographs of human (A) and mouse (B) terminal ileum (panels i–iii) and confocal images of ileal crypts (panels iv–ix) from human fetal intestine, a premature infant with NEC, full term infant, or E17 fetal mouse intestine injected intraintestinally with saline, LPS, or LPS + salubrinal as indicated and then stained for BiP (panels iv–vi) or cleaved CC3 (panels vii–ix). C, Western blot of P-PERK and CHOP in in utero injected fetal intestine. LPS intragastric dose was 5 μl of 1 mg/ml stock, and salubrinal intragastric dose was 1 mg/ml. The total injected volume was 5 μl. D, XBP1s expression by qRT-PCR in the ileal mucosa (panel i) blinded evaluation of apoptosis in the ileum of mouse and human tissue (panel ii). *, p < 0.05 versus human full term control; **, p < 0.05 mouse fetal saline versus mouse term control; ***, p < 0.05 mouse fetal LPS versus mouse saline and mouse LPS + salubrinal; #, p < 0.05 human NEC versus term control or fetal; ##, p < 0.05 mouse fetal LPS-injected versus saline or LPS + salubrinal injected fetal mice. The results are representative of three separate experiments with at least one mother per group and the injection of at least four pups. The data are means ± S.E. Scale bars, 10 μm. Arrows, apoptotic cells. Ctrl, control; Sal, saline; Salub, salubrinal.
FIGURE 9.
FIGURE 9.
PUMA is required for the induction in apoptosis in response to TLR4-induced ER stress in the intestinal crypts. A, qRT-PCR for PUMA in wild-type or PERK-deficient IEC-6 cells (panel i) or mice (panel ii) after treatment with saline (control) or LPS for 6 h as indicated. *, p < 0.05 versus control wild-type cells or mice; **, p < 0.01 versus LPS-treated wild-type cells or mice versus PERK-deficient cells or mice. The data are means ± S.E. The results are representative of three separate experiments. B, qRT-PCR for PUMA in wild-type or PUMA-deficient IEC-6 cells showing the extent of PUMA knockdown. *, p < 0.05 wild-type versus PUMAKD cells. C, representative confocal micrographs of wild-type or PUMA-deficient IEC-6 cells that were either untreated or treated with LPS, LPS + Z-VAD, or thapsigargin as indicated, then stained for BiP (panels i–vi) or TUNEL (panels vii–xii) as indicated. Arrows, apoptotic cells. D, representative confocal micrographs showing the crypts of PUMA−/− mice that were injected with saline or LPS (5 mg/kg for 6 h). Tissues were stained for BiP (panels i and ii) or TUNEL (panels iii and iv). Scale bars, 10 μm. E and F, qRT-PCR or quantification of apoptosis in wild-type or PUMA-deficient IEC-6 cells (E) or PUMA−/− mice (F) under the conditions indicated. *, p < 0.05 LPS versus control wild-type IEC-6 cells; #, p < 0.05 LPS versus LPS + Z-VAD IEC-6 cells; **, p < 0.05 thapsigargin versus other groups in PUMAKD cells. The results are representative of three separate experiments with over five mice per group or over 50 high power field per group as indicated. The data are means ± S.E. Ctrl, control; Thaps, thapsigargin.

References

    1. Simons B. D., Clevers H. (2011) Stem cell self-renewal in intestinal crypt. Exp. Cell Res. 317, 2719–2724 - PubMed
    1. Chen C. L., Yu X., James I. O., Zhang H. Y., Yang J., Radulescu A., Zhou Y., Besner G. E. (2012) Heparin-binding EGF-like growth factor protects intestinal stem cells from injury in a rat model of necrotizing enterocolitis. Lab. Invest. 92, 331–344 - PMC - PubMed
    1. Sodhi C. P., Shi X. H., Richardson W. M., Grant Z. S., Shapiro R. A., Prindle T., Jr., Branca M., Russo A., Gribar S. C., Ma C., Hackam D. J. (2010) Toll-like receptor-4 inhibits enterocyte proliferation via impaired β-catenin signaling in necrotizing enterocolitis. Gastroenterology 138, 185–196 - PMC - PubMed
    1. Feng J., Besner G. E. (2007) Heparin-binding epidermal growth factor-like growth factor promotes enterocyte migration and proliferation in neonatal rats with necrotizing enterocolitis. J. Pediatr. Surg. 42, 214–220 - PubMed
    1. Leaphart C. L., Cavallo J., Gribar S. C., Cetin S., Li J., Branca M. F., Dubowski T. D., Sodhi C. P., Hackam D. J. (2007) A critical role for TLR4 in the pathogenesis of necrotizing enterocolitis by modulating intestinal injury and repair. J. Immunol. 179, 4808–4820 - PubMed

Publication types

MeSH terms