. 2014 Feb 15;5(3):775-87.
doi: 10.18632/oncotarget.1770.

Targeting Src-mediated Tyr216 phosphorylation and activation of GSK-3 in prostate cancer cells inhibit prostate cancer progression in vitro and in vivo

Affiliations

Targeting Src-mediated Tyr216 phosphorylation and activation of GSK-3 in prostate cancer cells inhibit prostate cancer progression in vitro and in vivo

Anna Goc et al. Oncotarget. .

Abstract

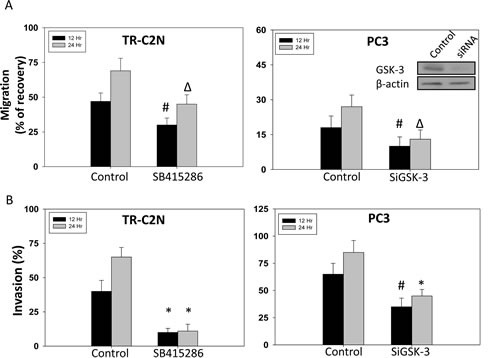
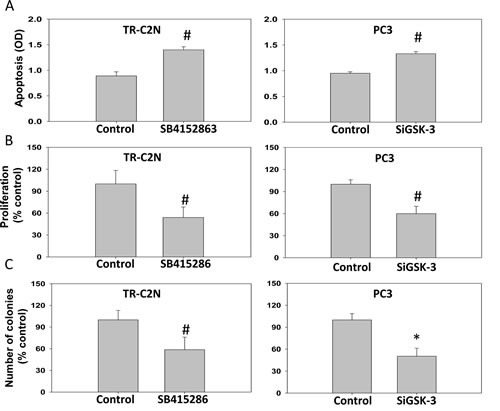
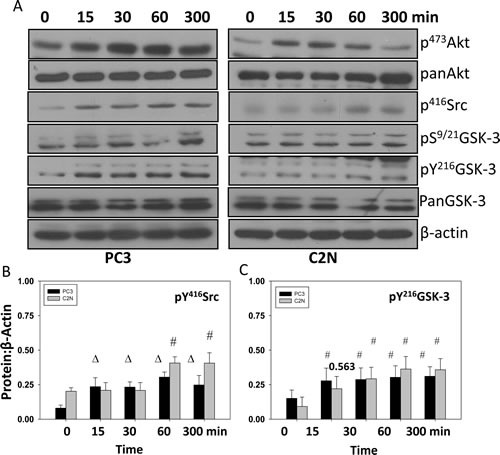
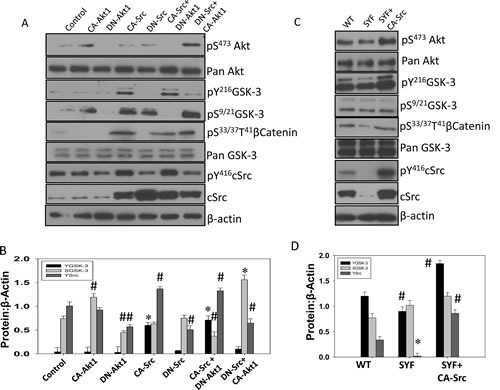
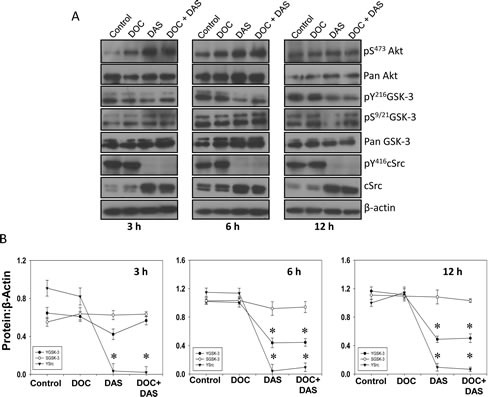
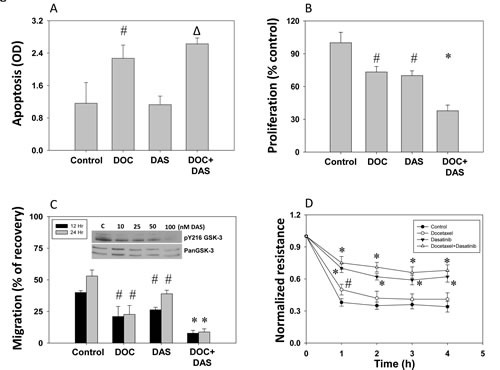
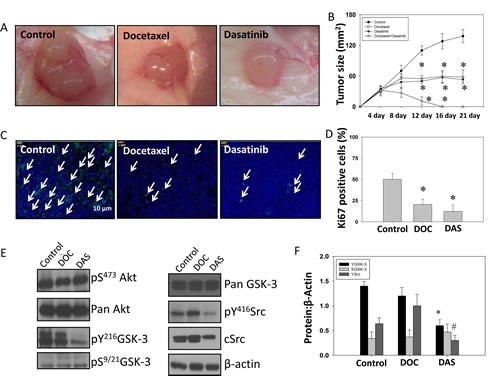
Recent studies suggest a positive correlation between glycogen synthase kinase-3 (GSK-3) activation and tumor growth. Currently, it is unclear how both Akt that inhibits GSK-3 and active GSK-3 are maintained concurrently in tumor cells. We investigated the role of GSK-3 and the existence of an Akt-resistant pathway for GSK-3 activation in prostate cancer cells. Our data show that Src, a non-receptor tyrosine kinase is responsible for Y216GSK-3 phosphorylation leading to its activation even when Akt is active. Experiments involving mouse embryonic fibroblasts lacking cSrc, Yes and Fyn, as well as Src activity modulation in prostate cancer cells with constitutively active (CA-Src) and dominant negative Src (DN-Src) plasmids demonstrated the integral role of Src in Y216GSK-3 phosphorylation and activity modulation. Inhibition of GSK-3 with SB415286 in PC3 cells resulted in impaired motility, proliferation and colony formation. Treatment of PC3 cells with the Src inhibitor dasatinib reduced Y216GSK-3 phosphorylation and inhibited proliferation, invasion and micrometastasis in vitro. Dasatinib treatment of athymic nude mice resulted in impaired growth of PC3 cell tumor xenograft. Together, we provide novel insight into the Src-mediated Y216GSK-3 phosphorylation and activation in prostate cancer cells and reveal the potential benefits of targeting Src-GSK-3 axis using drugs such as dasatinib.


Figures

Figure 1
Figure 1. GSK-3 inhibition and gene knockdown impairs migration and invasion of prostate cancer cells
Murine metastatic TRAMP (TR-C2N) cells were treated with 50 nM EGF plus 20 μM of GSK-3 inhibitor (SB415286), and human metastatic PC3 cells transiently transfected with SiRNA for GSK-3 followed by treatment with EGF were plated for migration and invasion assays for 12 h and 24 h. Control cells were either treated with 50 nM EGF or transient transfected with scrambled SiRNA. A) Bar graph showing decreased motility of TR-C2N and PC3 cells after GSK-3 activity inhibition and gene knockdown, respectively. B) Bar graph showing decreased invasiveness of TR-C2N and PC3 cells after GSK-3 activity inhibition and gene knockdown, respectively. The data are presented as mean ± SD (n=3) of triplicate experiments (* p<0.001, Δ p< 0.01, # p<0.05 vs. control experiments within the same group).
Figure 2
Figure 2. GSK-3 inhibition and gene knockdown impairs cell survival, proliferation and colony formation of prostate cancer cells
Murine metastatic TRAMP (TR-C2N) cells were treated with 50 nM EGF plus 20 μM of GSK-3 inhibitor (SB415286), and human metastatic PC3 cells transiently transfected with SiRNA for GSK-3 followed by treatment with EGF were subjected for apoptosis, proliferation and colony formation assays. Control cells were either treated with 50 nM EGF or transient transfected with scrambled SiRNA. A) Bar graph showing increased TR-C2N and PC3 cell apoptosis after GSK-3 activity inhibition and gene knockdown as determined based on cytoplasmic histone-associated DNA fragments detection after 12 h incubation. B) Bar graph showing decreased proliferation rate of TR-C2N and PC3 cells with GSK-3 activity inhibition and gene knockdown as detected by BrDU Labeling and Detection. C) Bar graph showing decreased colony formation by TR-C2N and PC3 cells with GSK-3 activity inhibition and gene knockdown as quantified using by the NIH ImageJ software. The data are presented as mean ± SD (n=4) of triplicate experiments (* p<0.001, Δ p< 0.01, # p<0.05 vs. control experiments within the same group).
Figure 3
Figure 3. EGF treatment increases phosphorylation of Y416Src and Y216GSK-3 concurrently
A) Human metastatic PC3 and murine metastatic TRAMP (TR-C2N) cells were treated with 50 nM EGF and cell lysates were prepared at different time points (0, 15, 30, 60 and 300 minutes). Figure shows Western blot analysis of cell lysates for changes in phosphorylation of S473Akt, Ser9/21GSK-3, Y216GSK-3 and Y416Src, compared to actin. B and C) Bar graph showing densitometry analysis of PC3 and C2N prostate tumor cell lysates as explained above for Y416Src and Y216GSK-3, respectively. The data are presented as mean ± SD (n=4) (Δ p< 0.01, # p<0.05 vs. control experiments within the same group).
Figure 4
Figure 4. Src activity is necessary for phosphorylation of GSK-3 Y216 in mouse embryonic fibroblasts and PC3 cells
A) Transiently transfected human prostate cancer (PC3) cells expressing plasmids for empty pBabe-Puro-vector (control), CA-Akt1, DN-Akt1, CA-Src, and DN-Src, or a combination of CA-Src with DN-Akt1 and DN-Src with CA-Akt1 were lysed and subjected for Western blot analysis for changes in phosphorylation and expression level of Akt, GSK-3, Src and βCatenin. B) Bar graph showing densitometry analysis of PC3 cell lysates as explained above for Y416Src, S9/21GSK-3 and Y216GSK-3, respectively. C) WT and SYF (cSrc, Yes and Fyn triple knockout) mouse embryonic fibroblasts transiently transfected with CA-Src plasmids were lysed and subjected for Western blot analysis for changes in phosphorylation and expression level of Akt, GSK-3 Src and βCatenin. Control cells were transiently transfected with empty pBabe-Puro-vector. D) Bar graph showing densitometry analysis of PC3 cell lysates as explained above for Y416Src, S9/21GSK-3 and Y216GSK-3, respectively. The data are presented as mean ± SD (n=3) (* p<0.001, Δ p< 0.01, # p<0.05 vs. control experiments within the same group).
Figure 5
Figure 5. Dasatinib, a Src family kinases and Bcr/Abl inhibitor inhibits GSK-3 Y216 phosphorylation
A) PC3 cells were treated with docetaxel (25 nM) and dasatinib (50 nM), respectively, or with a combination of docetaxel (25 nM) and dasatinib (50 nM) for 3 h, 6 h, and 12 h in serum free medium. Cell lysates from respective time points were subjected for Western blot analysis for changes in phosphorylation and expression levels of Akt, GSK-3 and Src. B) Bar graphs showing band densitometry analysis for phosphorylated and total Akt, GSK-3 and Src. The data are presented as mean ± SD (n=4) (* p<0.001, Δ p< 0.01, # p<0.05 vs. control experiments within the same group).
Figure 6
Figure 6. Dasatinib inhibits prostate cancer (PC3) cell apoptosis, proliferation, migration and micro-metastasis in vitro
PC3 cells were treated with docetaxel (25 nM) and dasatinib (50 nM), or with a combination of docetaxel (25 nM) and dasatinib (50 nM) for 12 h in serum free medium. A) Bar graph showing increased apoptosis of PC3 cells after treatment with docetaxel, dasatinib and a combination of docetaxel with dasatinib determined based on cytoplasmic histone-associated DNA fragments detection. B) Bar graph showing decreased proliferation of PC3 cells after treatment with docetaxel, dasatinib and a combination of docetaxel with dasatinib as determined by the measurement of the amount of BrDU incorporation. C) Bar graph showing decreased migration of PC3 cells after treatment with docetaxel, dasatinib and a combination of docetaxel with dasatinib. Cells were grown to reach confluence and then serum starved for 3 h. A scratch assay for the assessment of motility was performed for 12 h and 24 h post treatment. Insert show Western blot images on the effect of various doses of dasatinib on pY216GSK-3 phosphorylation with no changes in total GSK-3 expression D) Trans-endothelial migration (micro-metastasis) of prostate cancer (PC3) cells measured using electric cell-substrate impedance sensing (ECIS) technology with human dermal micro-vascular endothelial cells plated on 8W10E array chips. Control PC3 cells and cells treated with docetaxel, dasatinib or a combination of docetaxel with dasatinib were collected from the plate by using cell dissociation buffer [20mM EDTA in PBS (pH=7.4)] were directly added onto the endothelial cell monolayer at a density of 5X10⁴ cells/well in 50 serum-free DMEM. Figure shows Real-Time measurements on the trans-endothelial migration of PC3 cells as recorded by the ECIS instrument up to 5 h. The data are presented as mean ± SD (n=4) (* p<0.001, Δ p< 0.01, # p<0.05 vs. control experiments within the same group).
Figure 7
Figure 7. Dasatinib inhibits GSK-3 Y216 phosphorylation and growth of PC3 tumor xenograft in athymic nude mice in vivo
PC3 cells were implanted subcutaneously into athymic nude mice at a concentration of 1.5 X 10⁶ cells in 100 μl of sterile saline. Mice were treated with drugs at the following doses; docetaxel (5 mg/kg), dasatinib (10 mg/kg) and a combination of docetaxel (5 mg/kg) with dasatinib (10 mg/kg). Docetaxel was administrated for 3 days per week for 2 weeks total, whereas dasatinib was administrated 5 days per week for 3 weeks total. A) Images showing tumor xenographs collected on day 21. B) Bar graph representing the tumor progression during drug administration for 21 days. The data are presented as mean ± SD (n=6). C) Images showing fluorescent immunohistochemistry of tumor xenograft frozen sections probed with Ki67 antibodies. D) Bar graph showing number of Ki67-positive cells on day 21 in tumor xenograft frozen sections from animals treated with sterile saline, docetaxel and dasatinib. The data are presented as mean ± SD (n=6). E) The western blot analysis of changes in phosphoryation and expression levels of Akt, GSK-3 and Src molecules in the tumor lysates. F) Bar graph showing densitometry analysis of the tumor lysates for Akt, GSK-3 and Src molecules. The data are presented as mean ± SD (n=4) (* p<0.001, Δ p< 0.01, # p<0.05 vs. control experiments within the same group).

Similar articles

Cited by

References

    1. Li J, Yen C, Liaw D, Podsypanina K, Bose S, Wang SI, Puc J, Miliaresis C, Rodgers L, McCombie R, Bigner SH, Giovanella BC, Ittmann M, Tycko B, Hibshoosh H, Wigler MH, et al. PTEN, a putative protein tyrosine phosphatase gene mutated in human brain, breast, and prostate cancer. Science. 1997;275(5308):1943–1947. - PubMed
    1. Boormans JL, Korsten H, Ziel-van der Made AC, van Leenders GJ, Verhagen PC, Trapman J. E17K substitution in AKT1 in prostate cancer. Br J Cancer. 2010;102(10):1491–1494. - PMC - PubMed
    1. Goc A, Al-Husein B, Kochuparambil ST, Liu J, Heston WW, Somanath PR. PI3 kinase integrates Akt and MAP kinase signaling pathways in the regulation of prostate cancer. Int J Oncol. 2011;38(1):267–277. - PubMed
    1. Kochuparambil ST, Al-Husein B, Goc A, Soliman S, Somanath PR. Anticancer efficacy of simvastatin on prostate cancer cells and tumor xenografts is associated with inhibition of Akt and reduced prostate-specific antigen expression. J Pharmacol Exp Ther. 2011;336(2):496–505. - PubMed
    1. Goc A, Kochuparambil ST, Al-Husein B, Al-Azayzih A, Mohammad S, Somanath PR. Simultaneous modulation of the intrinsic and extrinsic pathways by simvastatin in mediating prostate cancer cell apoptosis. BMC Cancer. 2012;12:409. - PMC - PubMed

Publication types

MeSH terms