. 2014 Mar;137(Pt 3):860-72.
doi: 10.1093/brain/awt372. Epub 2014 Feb 11.

Nerve growth factor metabolic dysfunction in Down's syndrome brains

Affiliations

Nerve growth factor metabolic dysfunction in Down's syndrome brains

M Florencia Iulita et al. Brain. 2014 Mar.

Abstract

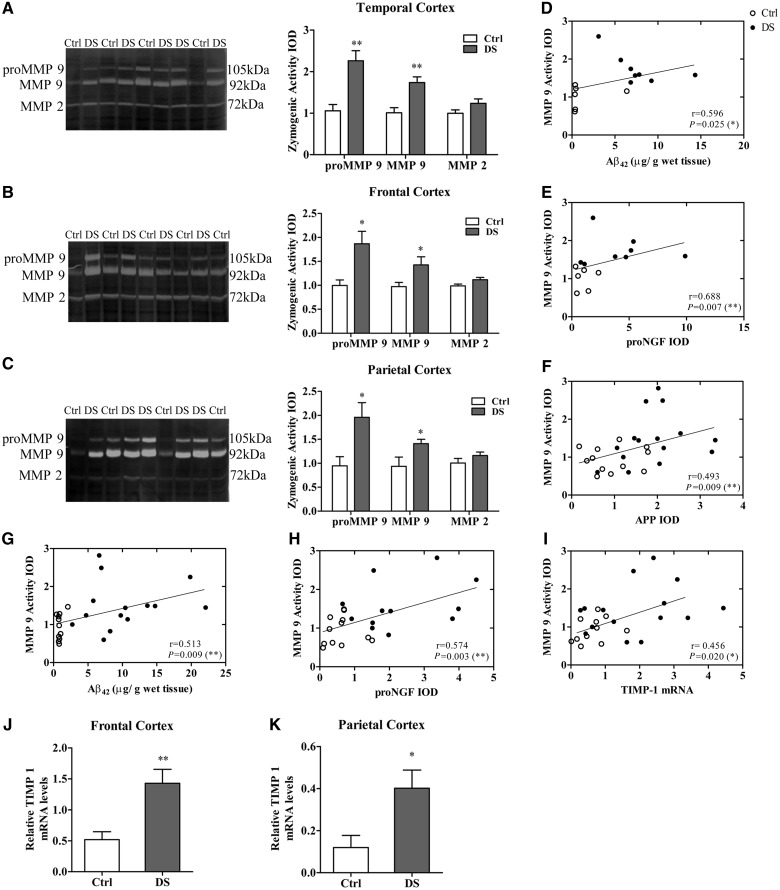
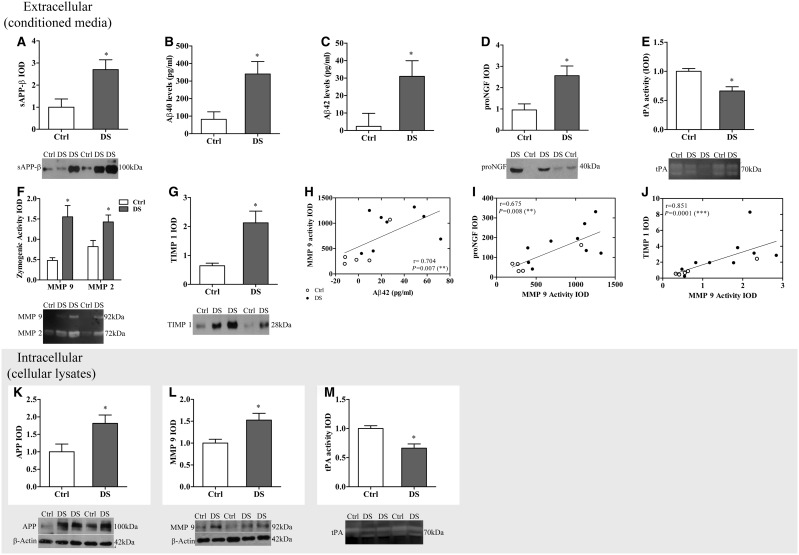
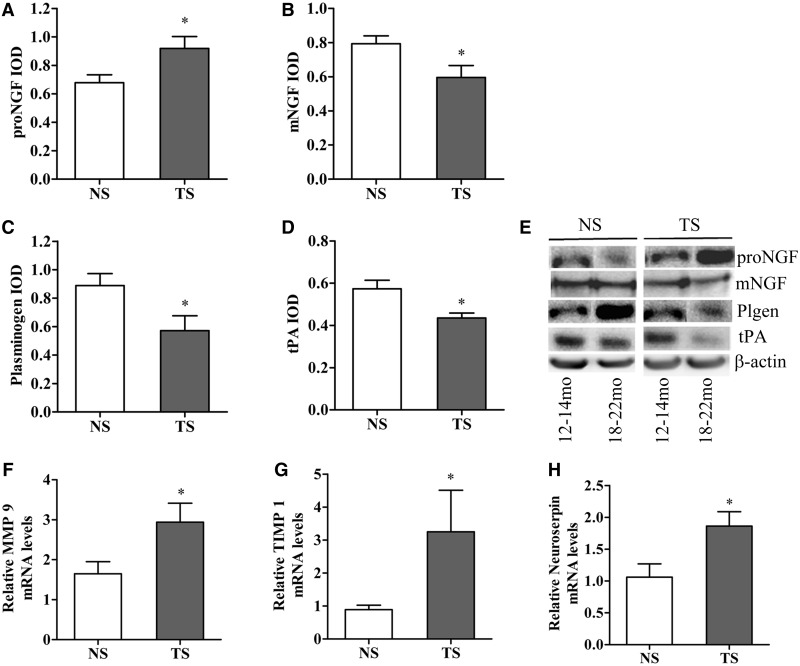
Basal forebrain cholinergic neurons play a key role in cognition. This neuronal system is highly dependent on NGF for its synaptic integrity and the phenotypic maintenance of its cell bodies. Basal forebrain cholinergic neurons progressively degenerate in Alzheimer's disease and Down's syndrome, and their atrophy contributes to the manifestation of dementia. Paradoxically, in Alzheimer's disease brains, the synthesis of NGF is not affected and there is abundance of the NGF precursor, proNGF. We have shown that this phenomenon is the result of a deficit in NGF's extracellular metabolism that compromises proNGF maturation and exacerbates its subsequent degradation. We hypothesized that a similar imbalance should be present in Down's syndrome. Using a combination of quantitative reverse transcription-polymerase chain reaction, enzyme-linked immunosorbent assay, western blotting and zymography, we investigated signs of NGF metabolic dysfunction in post-mortem brains from the temporal (n = 14), frontal (n = 34) and parietal (n = 20) cortex obtained from subjects with Down's syndrome and age-matched controls (age range 31-68 years). We further examined primary cultures of human foetal Down's syndrome cortex (17-21 gestational age weeks) and brains from Ts65Dn mice (12-22 months), a widely used animal model of Down's syndrome. We report a significant increase in proNGF levels in human and mouse Down's syndrome brains, with a concomitant reduction in the levels of plasminogen and tissue plasminogen activator messenger RNA as well as an increment in neuroserpin expression; enzymes that partake in proNGF maturation. Human Down's syndrome brains also exhibited elevated zymogenic activity of MMP9, the major NGF-degrading protease. Our results indicate a failure in NGF precursor maturation in Down's syndrome brains and a likely enhanced proteolytic degradation of NGF, changes which can compromise the trophic support of basal forebrain cholinergic neurons. The alterations in proNGF and MMP9 were also present in cultures of Down's syndrome foetal cortex; suggesting that this trophic compromise may be amenable to rescue, before frank dementia onset. Our study thus provides a novel paradigm for cholinergic neuroprotection in Alzheimer's disease and Down's syndrome.

Keywords: Alzheimer’s disease; Down’s syndrome; basal forebrain cholinergic neurons; matrix metallo-protease 9; proNGF.


Figures

Figure 1
Figure 1
Increased APP and amyloid-β levels in Down’s syndrome brains. Western blot analysis from human cortical homogenates revealed increased APP levels in Down’s syndrome brains compared to control cases in (A) temporal (P = 0.017; n = 14), (B) frontal (P = 0.0004; n = 34) and (C) parietal (P = 0.004; n = 20) cortex. Representative immunoblots probed with 22C11 and β-actin antibodies are shown. (DF) ELISA analysis of amyloid-β40 and amyloid-β42 peptides, from guanidine hydrochloride-homogenized brains. Down’s syndrome brains exhibited significantly higher levels of amyloid-β40 and amyloid-β42 peptides in (D) temporal (P = 0.003, P = 0.002) (E) frontal (P = 0.007, P < 0.0001) and (F) parietal cortex (P = 0.076, P = 0.005). Data are expressed as µg amyloid-β/g tissue. Error bars represent mean ± SEM. *P < 0.05; **P < 0.01; ***P < 0.001, Student’s t-test. Aβ = amyloid-β; Ctrl = control; DS = Down’s syndrome.
Figure 2
Figure 2
Increased proNGF levels in Down’s syndrome brains. Western blot analysis of proNGF in cortical brain homogenates. Down’s syndrome subjects exhibited significantly higher proNGF levels compared to age-matched control cases in (A) temporal (P = 0.026), (B) frontal (P = 0.004) and (C) parietal (P = 0.018) cortex. Representative immunoblots probed with proNGF and β-actin antibodies are shown. (DG) Scattergrams showing positive correlation between proNGF and APP in (D) temporal (r = 0.688, P = 0.007) and (F) frontal cortex (r = 0.409, P = 0.047) and between proNGF and amyloid-β42 in (E) temporal (r = 0.626, P = 0.017) and in (G) frontal cortex (r = 0.629, P = 0.001). Error bars represent mean ± SEM. *P < 0.05; **P < 0.01; ***P < 0.001, Student’s t-test; Spearman Rank analysis for correlations. Aβ = amyloid-β; DS = Down’s syndrome.
Figure 3
Figure 3
Increased MMP9 activity and TIMP1 expression in Down’s syndrome brains. AC) Representative gelatin zymographs depicting MMP9 precursor (proMMP9), MMP9 and MMP2 proteolytic activity. Analysis revealed significantly elevated MMP9 precursor and MMP9 zymogenic activity in Down’s syndrome cortical homogenates compared to control cases in (A) temporal (P = 0.002 and P = 0.003, respectively) (B) frontal (P = 0.011 and P = 0.043) and (C) parietal cortex (P = 0.018, P = 0.039). MMP2 activity did not differ between Down’s syndrome and control subjects in none of the areas investigated. Values are expressed as fold increase versus control. Independent statistical analysis was done for each metallo-protease, comparing its levels between control and Down’s syndrome cases. In temporal cortex there was a positive correlation between (D) MMP9 activity and amyloid-β42 levels (r = 0.596, P = 0.025) as well as a strong link between (E) MMP9 activation and proNGF accumulation (r = 0.688, P = 0.007). Correlation analysis in frontal cortex also revealed positive associations between (F) MMP9 zymogenic activity and APP levels (r = 0.493, P = 0.009), (G) MMP9 and amyloid-β42 (r = 0.513, P = 0.009) and (H) MMP9 and proNGF (r = 0.577, P = 0.003). Quantitative real-time PCR analysis revealed significantly higher TIMP1 messenger RNA levels in (J) frontal (P = 0.0003) and (K) parietal cortex (P = 0.015). TIMP1 messenger RNA expression was normalized to the housekeeping gene HPRT. (I) Scattergram showing positive correlation between MMP9 activity and TIMP1 messenger RNA levels in frontal cortex (r = 0.457, P = 0.020). Error bars represent mean ± SEM. *P < 0.05; **P < 0.01; Student’s t-test; Spearman Rank analysis for correlations. Aβ = amyloid-β; DS = Down’s syndrome.
Figure 4
Figure 4
Alterations in neuroserpin, tPA and plasminogen in Down’s syndrome brains. Down’s syndrome brains exhibited significantly higher neuroserpin messenger RNA levels in (A) temporal (P = 0.017), (B) frontal (P = 0.029) and (C) parietal cortex (P = 0.051), compared with age-matched control cases. (D–F) Western blot analysis revealed a significant increase in neurosepin protein levels in (D) temporal (P = 0.047), (E) frontal (P = 0.045) and (F) parietal cortex (P = 0.031). (GH) Scattergrams showing positive correlation between (G) neuroserpin messenger RNA and amyloid-β42 (r = 0.471, P < 0.05) and (H) neuroserpin protein levels and amyloid-β42 (r = 0.442, P < 0.05) in frontal cortex. PCR analysis revealed marked reductions in tPA messenger RNA levels in (I) frontal (P = 0.016) and (J) parietal (P = 0.058) cortex. Down’s syndrome brains also exhibited reduced plasminogen protein levels in Down’s syndrome (K) frontal (P = 0.0079) and (L) parietal cortex (P = 0.045). (DF and KL) Representative immunoblots probed with neuroserpin, plasminogen and β-actin antibodies are shown. (AC, I and J) PCR data are expressed as the normalized ratio between each protein of interest and HPRT. Error bars represent mean ± SEM. *P < 0.05; **P < 0.01; Student’s t-test; Spearman Rank analysis for correlations. Aβ = amyloid-β; DS = Down’s syndrome.
Figure 5
Figure 5
Early signs of NGF dysmetabolism in primary cultures from foetal Down’s syndrome cortex. (A) Western blot analysis revealed significantly higher soluble APP-β levels (P = 0.015) in conditioned media from Down’s syndrome cultures. Down’s syndrome cultures exhibited significantly higher levels of secreted (B) amyloid-β40 (P = 0.036) and (C) amyloid-β42 (P = 0.047), compared with controls. The concentration of amyloid-β peptides is expressed in pg/ml. (D) Western blot analysis revealed a significant increase in proNGF levels in conditioned media from Down’s syndrome cultures (P = 0.029). (E) Reduced tPA zymogenic activity in Down’s syndrome conditioned media (P = 0.046). (F) The activity of MMP9 and MMP2 was significantly increased in Down’s syndrome conditioned media (P = 0.011 and P = 0.026, respectively). (H) Scattergram showing positive correlation between MMP9 activity and amyloid-β42 (r = 0.718, P = 0.009). (I) Positive correlation between proNGF and MMP9 activity (r = 0.676, P < 0.011). (G) Western blot analysis revealed significantly higher TIMP1 levels in Down’s syndrome conditioned media (P = 0.029). (J) Positive correlation between TIMP1 and MMP9 activity (r = 0.851, P = 0.0001). For western blot and zymography analysis, IOD values were normalized by total protein concentration in each conditioned media sample. (KM) Western blot analysis from cortical cell homogenates revealed (K) increased APP (P = 0.042) and (L) MMP9 protein levels (P = 0.030) in Down’s syndrome. (M) There was a marked reduction in tPA activity in Down’s syndrome cells, as determined by casein zymography (P = 0.017). Representative tPA zymogram and immunoblots probed with 22C11, MMP9 and β-actin antibodies are shown. Error bars represent mean ± SEM, (n = 5 for control and n = 9 for Down’s syndrome cultures). *P < 0.05; **P < 0.01; Student’s t-test, Spearman Rank analysis for correlations. Aβ = amyloid-β; DS = Down’s syndrome; IOD=Integrated optical density.
Figure 6
Figure 6
Deficits in proNGF cleavage in Ts65Dn mice, a genetic mouse model of Down’s syndrome. Western blot analysis of NGF pathway markers in basal forebrain target tissue (hippocampus) of 12–14 and 18–22 month-old mice. Trisomic mice exhibited significantly higher (A) proNGF levels (P = 0.035) and lower (B) mature NGF levels (P = 0.010), compared with normosomic littermates. Analysis also revealed a significant reduction in (C) plasminogen (P = 0.031) and (D) tPA (P = 0.026) protein levels. Graphs depict data combined from the two time points. (E) Representative immunoblots probed with NGF, plasminogen, tPA and β-actin antibodies are shown. (FH) Quantitative real-time PCR analysis of NGF pathway markers in frontal cortex from trisomic mice and normosomic littermates. Trisomic mice exhibited higher (F) MMP9 (P = 0.044) and (G) TIMP1 messenger RNA levels (P = 0.049). (H) Increased neuroserpin messenger RNA levels in trisomic mice (P = 0.039). Data are expressed as the normalized ratio between each protein of interest and the housekeeping gene Hprt. Error bars represent mean ± SEM. *P < 0.05; Student’s t-test, NS = normosomic; TS = trisomic.
Figure 7
Figure 7
Schematic representation of the NGF metabolic pathway in healthy brains and its deregulation in Down’s syndrome. (A) The NGF precursor is released to the extracellular space along with the convertases and zymogens necessary for its maturation and subsequent degradation. ProNGF is cleaved extracellulary and converted to mature NGF by plasmin. Plasmin derives from plasminogen by the action of tPA. Neuroserpin is the endogenous tPA inhibitor in the CNS. Mature NGF (mNGF) is degraded by MMP9, which is also released from neurons along with its endogenous inhibitor TIMP1. (B) In Down’s syndrome brains there is a failure in proNGF maturation due to reduced plasminogen and tPA as well as enhanced neuroserpin levels. Down’s syndrome brains also exhibit increased MMP9 activity and higher TIMP1 levels, likely contributing to enhanced mature NGF degradation.

Similar articles

Cited by

References

    1. Allard S, Leon WC, Pakavathkumar P, Bruno MA, Ribeiro-da-Silva A, Cuello AC. Impact of the NGF maturation and degradation pathway on the cortical cholinergic system phenotype. J Neurosci. 2012;32:2002–12. - PMC - PubMed
    1. Azizeh BY, Head E, Ibrahim MA, Torp R, Tenner AJ, Kim RC, et al. Molecular dating of senile plaques in the brains of individuals with Down syndrome and in aged dogs. Exp Neurol. 2000;163:111–22. - PubMed
    1. Bartus RT, Dean RL, 3rd, Beer B, Lippa AS. The cholinergic hypothesis of geriatric memory dysfunction. Science. 1982;217:408–14. - PubMed
    1. Bowen DM, Smith CB, White P, Davison AN. Neurotransmitter-related enzymes and indices of hypoxia in senile dementia and other abiotrophies. Brain. 1976;99:459–96. - PubMed
    1. Bruno MA, Cuello AC. Activity-dependent release of precursor nerve growth factor, conversion to mature nerve growth factor, and its degradation by a protease cascade. Proc Natl Acad Sci USA. 2006;103:6735–40. - PMC - PubMed

Publication types

MeSH terms