

Heteroresistance at the single-cell level: adapting to antibiotic stress through a population-based strategy and growth-controlled interphenotypic coordination
- PMID: 24520060
- PMCID: PMC3950525
- DOI: 10.1128/mBio.00942-13
Heteroresistance at the single-cell level: adapting to antibiotic stress through a population-based strategy and growth-controlled interphenotypic coordination
Abstract
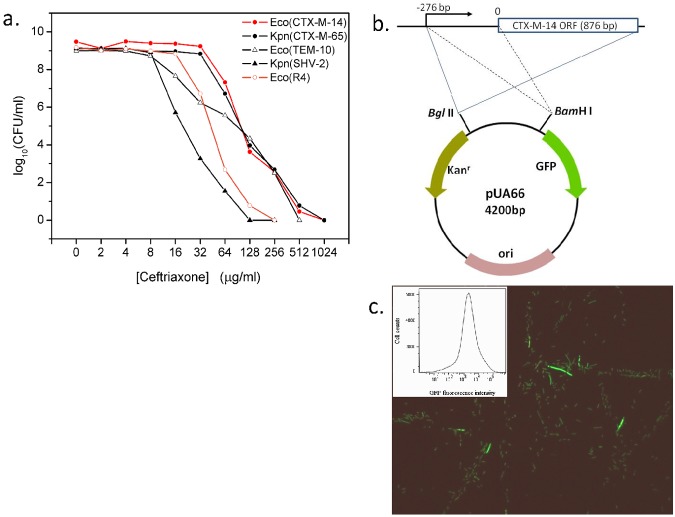
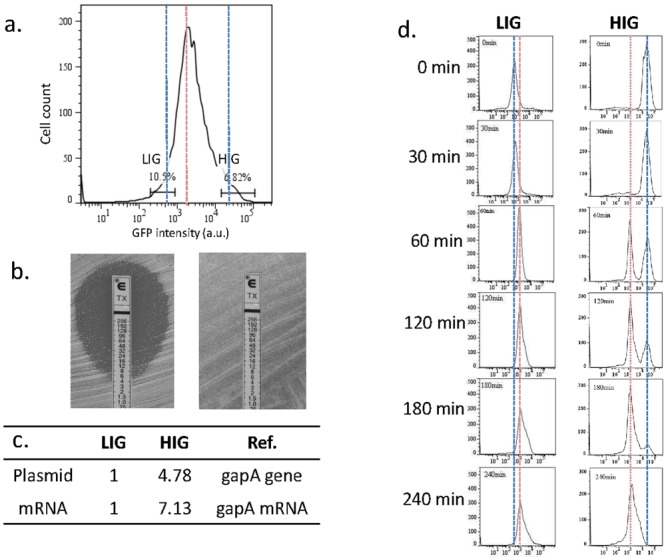
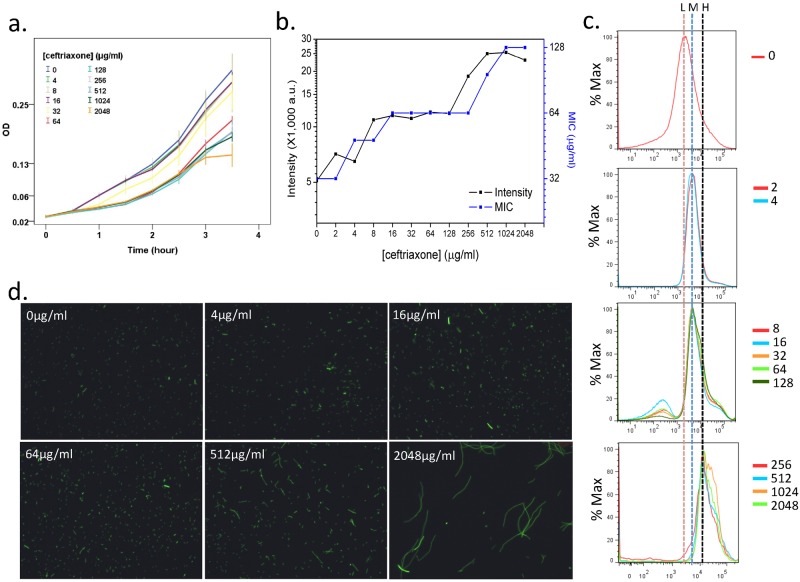
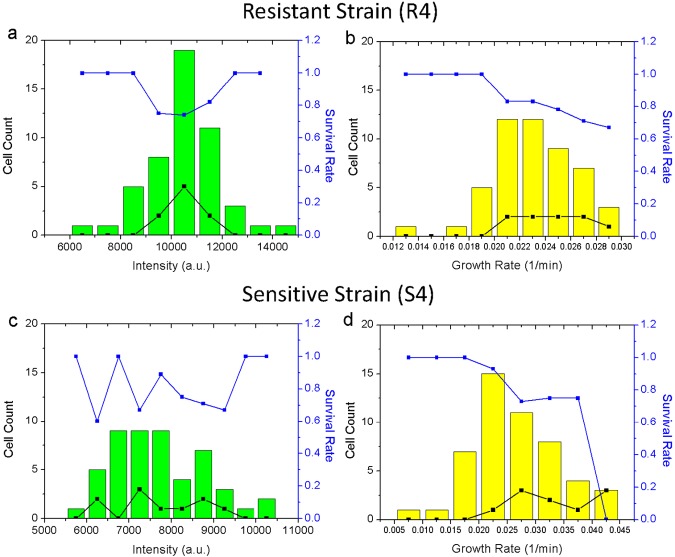
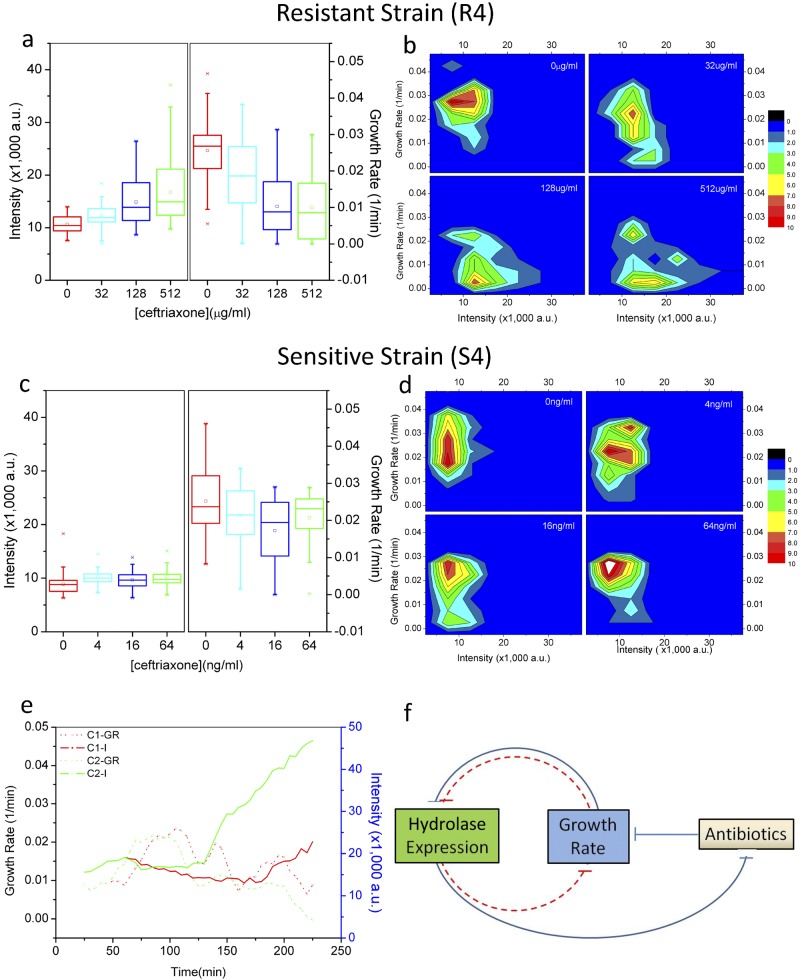
Heteroresistance refers to phenotypic heterogeneity of microbial clonal populations under antibiotic stress, and it has been thought to be an allocation of a subset of "resistant" cells for surviving in higher concentrations of antibiotic. The assumption fits the so-called bet-hedging strategy, where a bacterial population "hedges" its "bet" on different phenotypes to be selected by unpredicted environment stresses. To test this hypothesis, we constructed a heteroresistance model by introducing a blaCTX-M-14 gene (coding for a cephalosporin hydrolase) into a sensitive Escherichia coli strain. We confirmed heteroresistance in this clone and that a subset of the cells expressed more hydrolase and formed more colonies in the presence of ceftriaxone (exhibited stronger "resistance"). However, subsequent single-cell-level investigation by using a microfluidic device showed that a subset of cells with a distinguishable phenotype of slowed growth and intensified hydrolase expression emerged, and they were not positively selected but increased their proportion in the population with ascending antibiotic concentrations. Therefore, heteroresistance--the gradually decreased colony-forming capability in the presence of antibiotic--was a result of a decreased growth rate rather than of selection for resistant cells. Using a mock strain without the resistance gene, we further demonstrated the existence of two nested growth-centric feedback loops that control the expression of the hydrolase and maximize population growth in various antibiotic concentrations. In conclusion, phenotypic heterogeneity is a population-based strategy beneficial for bacterial survival and propagation through task allocation and interphenotypic collaboration, and the growth rate provides a critical control for the expression of stress-related genes and an essential mechanism in responding to environmental stresses.
Importance: Heteroresistance is essentially phenotypic heterogeneity, where a population-based strategy is thought to be at work, being assumed to be variable cell-to-cell resistance to be selected under antibiotic stress. Exact mechanisms of heteroresistance and its roles in adaptation to antibiotic stress have yet to be fully understood at the molecular and single-cell levels. In our study, we have not been able to detect any apparent subset of "resistant" cells selected by antibiotics; on the contrary, cell populations differentiate into phenotypic subsets with variable growth statuses and hydrolase expression. The growth rate appears to be sensitive to stress intensity and plays a key role in controlling hydrolase expression at both the bulk population and single-cell levels. We have shown here, for the first time, that phenotypic heterogeneity can be beneficial to a growing bacterial population through task allocation and interphenotypic collaboration other than partitioning cells into different categories of selective advantage.
Figures
References
-
- Fernández Cuenca F, del Carmen Gomez Sanchez C, Caballero-Moyano FJ, Vila J, Martínez-Martínez L, Bou G, Baño JR, Pascual A. 2012. Prevalence and analysis of microbiological factors associated with phenotypic heterogeneous resistance to carbapenems in Acinetobacter baumannii. Int. J. Antimicrob. Agents 39:472–477. 10.1016/j.ijantimicag.2012.01.015 - DOI - PubMed
-
- Lo-Ten-Foe JR, de Smet AM, Diederen BM, Kluytmans JA, van Keulen PH. 2007. Comparative evaluation of the VITEK 2, disk diffusion, Etest, broth microdilution, and agar dilution susceptibility testing methods for colistin in clinical isolates, including heteroresistant Enterobacter cloacae and Acinetobacter baumannii strains. Antimicrob. Agents Chemother. 51:3726–3730. 10.1128/AAC.01406-06 - DOI - PMC - PubMed
-
- Nunes AP, Teixeira LM, Iorio NL, Bastos CC, de Sousa Fonseca L, Souto-Padrón T, dos Santos KR. 2006. Heterogeneous resistance to vancomycin in Staphylococcus epidermidis, Staphylococcus haemolyticus and Staphylococcus warneri clinical strains: characterisation of glycopeptide susceptibility profiles and cell wall thickening. Int. J. Antimicrob. Agents 27:307–315. 10.1016/j.ijantimicag.2005.11.013 - DOI - PubMed
Publication types
MeSH terms
Substances
LinkOut - more resources
Full Text Sources
Other Literature Sources
Medical
